Search
IOP 11, 10-11 Feb 2001
IOP 11: 10-11 February 2001
Time Period of IOP:
0400 UTC 10 Feb. 2001 - 0921 UTC 11 Feb. 2001
Overview of IOP
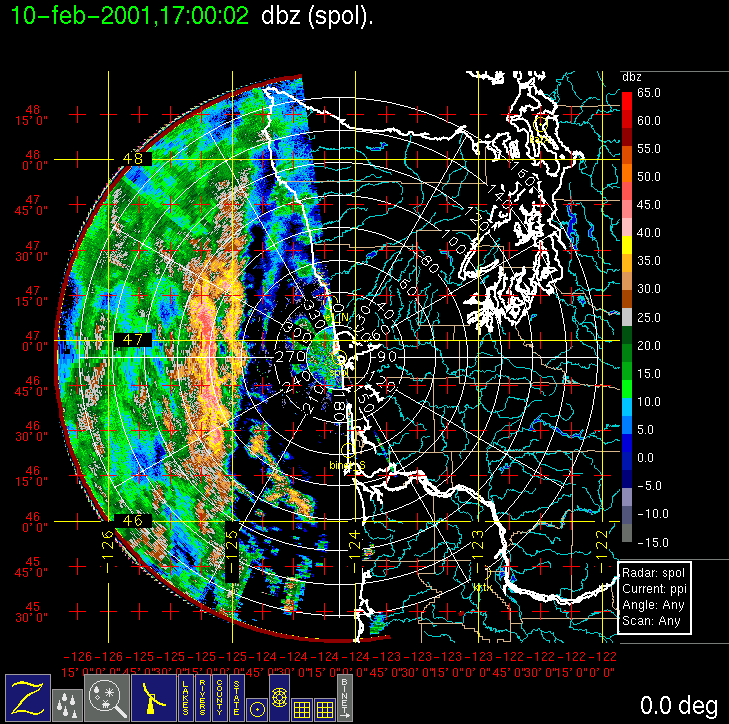
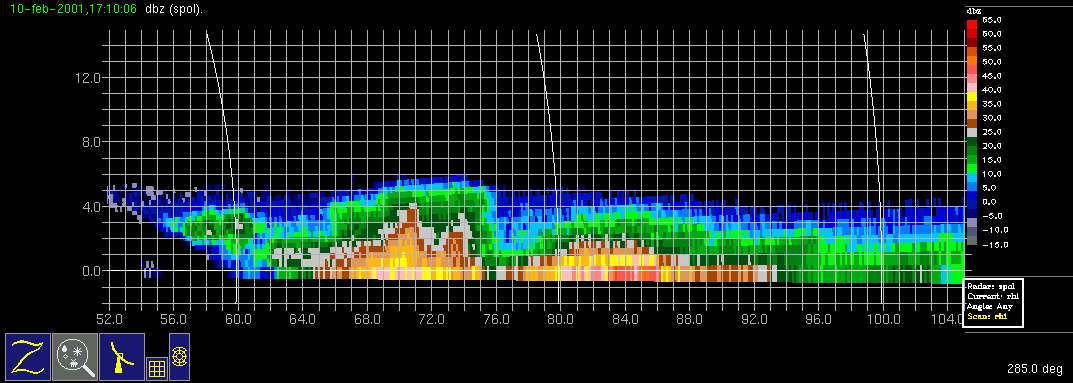
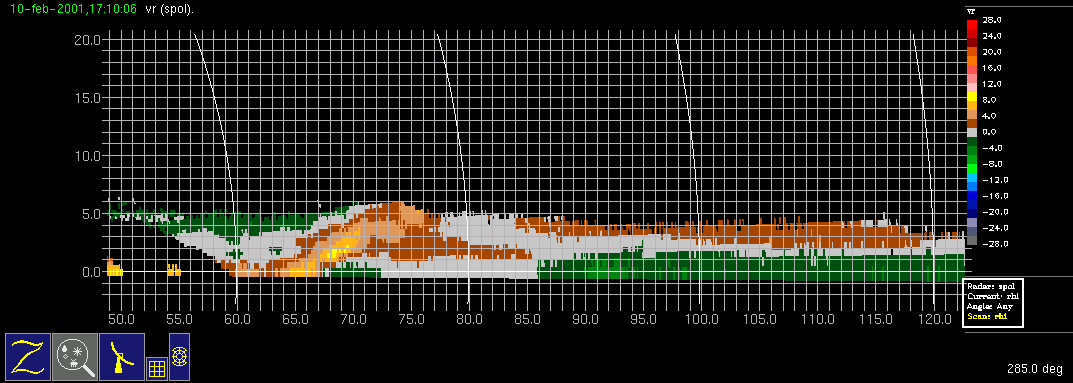
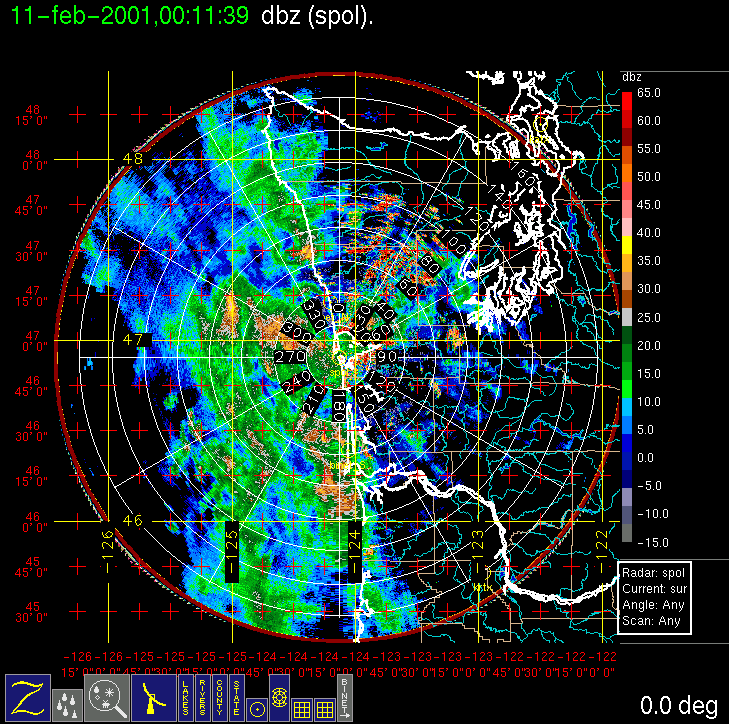
On (Friday) 9 February 2001 the models showed that another surface low-pressure center was forecast to develop in northwesterly flow and pass through the study area on (Saturday) February 10. We called for a research flight of the Convair-580 with a doors closed time of 7 am local time on Saturday morning, with the possibility of two flights. What appeared to be yet another occluded frontal system entered the study area early Saturday morning, a bit faster than the previous model run had indicated, prompting a hastening of the aircraft take-off to 6:30 am local time. The morning flight probed the main precipitation band that entered the study area, although immediately east of the main band, a more convective band also developed (the left and right bands, respectively, between 60 and 100 km range, in this radar image). The convective band, at least for a short time, was a distinctly separate and deeper band [compare the left (convective) and right (main precipitation) bands in this RHI image.] The convective band also represented a significant kinematic feature, with front to rear flow (outbound yellow and brown Doppler velocities) approaching the band at low levels and then ascending over its leading edge, suggesting a squall line or narrow cold-frontal rainband type circulation. The main precipitation band eventually merged with the convective band, becoming a single strong band of precipitation. In one of its passes through the convective band, the Convair-580 was struck by lightning, temporarily knocking out some of the instruments (and draining the blood from the faces of some of the first-time passengers!). The convective band was avoided from that point on. The flight continued without incident, probing the main precipitation band with several legs at 2000-ft intervals from the surface to 20,000 ft. The aircraft landed at Hoquiam and then (in UW Flight 1860) returned to the same precipitation band and studied it during its weakening stage.
Convair-580 Summary
UW Flight Number:
1859 (First flight for this IOP)
Period of Flight:
1430-2005 UTC, 10 february 2001
Main Accomplishments of Flight:
Measurements from 2,000-20,000 ft in wide cold-frontal (?) rainband.
Instrument Problems:
Electrical discharge to aircraft at 1703 UTC caused permanent failure of Johnson-Williams liquid water meter and temporary failure of SPEC CPI.
Flight Scientist:
Peter Hobbs
Approximate UTC Timeline (Local time = UTC – 8 hours) Activity for UW Flight 1859:
1430 Engines on.
1437 Take off from Paine Field.
1437-1447 freezing level at ~2,200 ft. Climb to 9,500 ft (–14 deg C)
1500-1507 Descend to 2,000 ft near Washington coast.
1507-1540 Head to west point (47 deg 10'/125 deg 56') at 2,000 ft. Some precipitation.
1540-1543 Turn at west point.
1543-1612 Head east at –2 deg C level in cloud. Turn back west to 47 deg 11'/125 deg 37', climb to 4,500 ft.
1617-1633 Head west at 4,500 ft (–6 deg C).
1633-1636 Turn.
1636-1642 Head east, climbing to 6,500 ft.
1642-1645 Turn.
1645-1654 Head west at 6,500 ft (–8 deg C).
1654-1656 Turn.
1656-1708 Head east climbing to 8,500 ft.
170310 Electrical discharge from aircraft. Lost CPI temporarily and Johnson-Williams liquid water meter permanently.
1708 Turn at easterly point.
1710-1720 Head west at 8,500 ft. (–13 deg C).
1720-1723 Turn.
1723-1731 Head east climbing to 10,500 ft.
1731-1732 Turn.
1732-1739 Head west at 10,500 ft (–16 deg C).
1739-1749 Turn and head east climbing to 13,500 ft (–22 deg C).
1749-1750 Turn at easterly point.
1750-1759 Head west at 13,500 ft.
1800 Turn.
1802-1809 Head east climbing to 16,500 ft.
1809-1817 Head west at 16,500 ft (–30 deg C).
1817-1819 Turn.
1819-1824 Head east climbing to 19,500 ft (–38 deg C). Breaking out of top of band clouds to east.
1824-1826 (?) Turn.
1826 (?)-1834? Head west at 19,500 ft.
1834 (?) Turn and climb.
1942-1903 Head east to Westport at 20,700 ft (–40 deg C).
1905-1945 Spiral descent on coast at 500 ft/min then 1,000 ft/min to 2,000 ft ahead of rainband but in "interesting precipitation" (S-Pol operator).
~2000 Land at Hoquiam.
UW Flight Number:
1860 (Second flight for this IOP)
Period of Flight:
2148-0225 UTC, 10-11 February 2001
Main Accomplishments of Flight:
Continued to sample same (almost stationary) rainband as on UW Flight 1859.
Instrument Problems:
Some poor images on SPEC CPI. Could not switch 35 GHz radar from up to down at low temperatures.
Flight Scientist:
Peter Hobbs
Approximate UTC Timeline (Local time = UTC – 8 hours) Activity for UW Flight 1860:
2148 Engines on.
2153 Take off from Hoquiam.
2153-2213 Head west to 47 deg 15'/125 deg 02' at 7,000 ft.
2215-2232 Head east at 1,500 ft (1 deg C).
2233 Turn at easterly point.
2134-? Head west climbing at 300 ft/min to 3,500 ft to 47 deg 15'/125 deg 02'.
?-2258 Head east at 3,500 ft (–2.5 deg C).
2300-? Head west climbing to 5,500 ft.
2310 Turn.
2313-2327 Head east at 5,500 ft (–6 deg C).
2327-2329 Turn.
2330-2341 Head west climbing to 8,500 ft.
2341 Turn.
2345-2358 Head east at 8,500 ft (–12 deg C).
2358-0002 Turn.
0002-0013 Head west climbing to 10,500 ft.
0014-0016 Turn.
0017-0026 Head east at 10,500 ft. (–15 deg C).
0026-0029 Turn.
0030-0039 Head west climbing to 13,500 ft.
0040-0055 Headed south to (wrong) coordinate from radar. Returned to original west point location.
0056-0108 Head east at 13,500 ft (–22 deg C). Cirrus fallstreaks.
0108-0111 Turn.
0111-0121 Head west climbing to 16,500 ft (–29 deg C).
0122-0139 Sampled cirrus near westerly point at 18,000 ft (–33 deg C). This cirrus was seeding lower cloud earlier in flight but had drifted to north.
0139 Head back to Paine Field.
0222 Land at Paine Field.
0225 Engines off.
S-Pol Radar Summary
0400 UTC Sat 10 Feb.:
Radar switched from dual-pol to long-range mode.
Scan cycle switched from NWS-Surveillance to Long Range.
1452 UTC Sat 10 Feb.:
Radar switched from long-range to dual-pol mode.
Scan cycle switched from Long Range to Research.
0921 UTC Sun 11 Feb.:
Scan cycle switched from Research to NWS-Surveillance.
Summary of Navy Sonde Launches from Westport
Launch times:
1149 UTC Sat 10 Feb.
1449 UTC Sat 10 Feb.
1746 UTC Sat 10 Feb.
2050 UTC Sat 10 Feb.
2349 UTC Sat 10 Feb.
Note: All sondes launched successfully.
Summary of NWS Sonde Launches from Quillayute (UIL) and Salem (SLE)
Launches are generally started ~1 h before a standard 3-hourly synoptic time, so some sondes are reported as occurring 1 h before the standard synoptic hour.
UIL Launch Times:
1200 UTC Sat 10 Feb. (standard)
1400 UTC Sat 10 Feb. (special)
1800 UTC Sat 10 Feb. (special)
2000 UTC Sat 10 Feb. (special)
0000 UTC Sun 11 Feb. (standard)
0200 UTC Sun 11 Feb. (special)
SLE Launch Times:
1100 UTC Sat 10 Feb. (standard)
1400 UTC Sat 10 Feb. (special)
1800 UTC Sat 10 Feb. (special)
2000 UTC Sat 10 Feb. (special)
0000 UTC Sun 11 Feb. (standard)
0200 UTC Sun 11 Feb. (special)
Note: A miscommunication resulted in no sonde launch at 0600 UTC Sun 11 Feb. at either UIL or SLE.


IMPROVE (University of Washington)
IMPROVE-2 IOPs
IOP 1, 28-29 Nov 2001
IOP 1: 28-29 November 2001
Time Period of IOP
1200 UTC 28 Nov-0300 UTC 29 Nov
Overview of IOP
A very intense short wave trough formed over the
The S-Pol radar showed precipitation moving through the Oregon Cascades from 0400 UTC
After the cold front passed through
After 1600 UTC 29 November there were a few decaying convective cells to the east of the radar Fig. 16. From 1700-1922 UTC 29 November, the Convair flew a vertical profile for microphysical measurements over
The ETL S-band vertically-pointing radar showed detailed vertical and horizontal structures during the passage of the storm over
Convair-580 Summary
UW Flight Number:
1891
Period of Flight:
1810-2329 UTC,
Main Accomplishment of Flight:
Measurements in pre-frontal, frontal and postfrontal conditions across the Oregon Cascades. Landed in
Instrument Problems:
SPEC CPI,
Flight Scientist:
Peter V. Hobbs
Approximate UTC Timeline (Local time= UTC-8 hours) Activity for UW Flight 1891:
1822 |
Takeoff from Paine Field |
1822-2015 |
Transit to |
2035-2048 At 43˚16.1'/124˚29. |
9' (on |
2048-2053 . |
NE --> SW descending |
2053-2107 . |
SW-NE at 19,500 ft |
2109-2132 |
NE --> SW descending to 17,000 ft. |
2134-2148 |
|
2149-3 |
NE --> SW descending to 14,500 ft. Picked up significant ice on descent to 14,500 ft. Circled in clear air at SW point to shed ice. |
~2225-2240 |
|
2240 |
Return to SW with slow descent (more icing in Cu). |
Land at |
|
2329 |
2330 Engines off. |
UW Flight Number:
1892
Period of Flight:
0011-0129 UTC,
Main Accomplishment of Flight:
Transit from
Instrument Problems:
As for Flight 1891.
Flight Scientist:
Peter V. Hobbs
Approximate UTC Timeline (Local time= UTC-8 hours) Activity for UW Flight 1892:
00?? |
Takeoff. |
0016-0031 |
Climb to 10,000 ft. Cloud tops |
UW Flight Number:
1893
Period of Flight:
1558-2039 UTC,
Main Accomplishment of Flight:
Vertical profile from 15,000 ft down to 2,000 ft between Sweet Home and Santiam Pass, Oregon, in postfrontal conditions. Measured CCN spectra in inflow to clouds over Cascades and in outflow. Profile through small cumulus clouds over PNNL PARSL site at
Instrument Problems:
Discrepancy between FSSP-100 and PVM-100. Intermittent outages of HVPS.
Flight Scientist:
Peter V. Hobbs
Approximate UTC Timeline (Local time= UTC-8 hours) Activity for UW Flight 1893:
1606 |
Takeoff. |
1606-1709 |
Transit to Sweet Home. |
1709-1725 |
Sweet Home à Santiam à 15,000 ft à 10,500 ft. No cloud at this height. |
1725-1750 |
Return to Sweet Home à descending to get into cloud tops, 10,000 ft à 5,000 ft à 2,000 ft. |
1755-1810 |
CCN spectra in inflow air to clouds just west of Santiam at 2,000 ft. |
1810-1830 |
West à Sweet Home à Santiam. |
1830-1855 |
To PARSL site. |
1857-1912 |
CCN spectra in outflow below cloud base near PARSL site. |
1914-1922 |
Spiral up over |
1922 . |
Transit home |
P-3 Summary
P-3 Flight Number:
011128H, IMPROVE 01
Period of Flight:
1936 UTC 28 November-0122 UTC
Main Accomplishment of Flight:
Support of UW Convair operations (SW-NE transect) over
Instrument Problems:
-
Flight Scientist:
Nick Bond
Approximate UTC Timeline (Local time= UTC-8 hours) Activity for P-3 Flight 01:
193613 UTC (47.90024, -122.28056) .755°, 965.6 mb, 3.0 m Engine Start
194312 UTC (47.90022, -122.28049) 5.593°, 965.0 mb, 3.0 m Block Out. Taxi to 16R
195517 UTC (47.90895, -122.28560) 179.130°, 968.6 mb, 5349.0 m Takeoff
195859 UTC (47.77825, -122.42265) 260.415°, 884.1 mb, 901.0 m Cloud physics system up but with some initialization problems.
200534 UTC (47.53393, -122.76604) 181.575°, 689.7 mb, 2593.0 m Radar system up, recording on DR1. Slewable (AOC) antenna. LF at 2 RPM.
201207 UTC (47.20762, -122.95032) 205.434°, 574.3 mb, 4289.0 m Tech swapping cards on precip/cloud probes to get data into proper size range. Echo tops near 6km.
201939 UTC (46.76801, -123.12292) 181.582°, 554.9 mb, 4436.0 m PMS data looked good as we came through echo last few min; now in clear. ETA Pt A is 2047UTC. Echoes thinning out here.
203124 UTC (46.07021, -123.10075) 175.955°, 556.5 mb, 4275.0 m Crossing Columia; echoes picking up, especially east of track
204001 UTC (45.53973, -123.02272) 175.024°, 561.6 mb, 4428.0 m Descending to 7kft, requesting 6kft. Echoes not too horizontally extensive, a little spotty, shallow.
204407 UTC (45.29348, -123.01978) 183.274°, 745.8 mb, 2191.0 m Tech bringing cloud physics back online. Top of BB near 2km.
204853 UTC (45.01687, -123.03389) 180.966°, 794.4 mb, 1774.0 m At Pt A, tracking 180. On tail view (out only to 40km range), echo generally more extensive west of track, tho some stuff hanging over Cascades to east.
205138 UTC (44.86903, -123.03319) 180.763°, 792.6 mb, 1691.0 m Passing over
205603 UTC (44.61491, -123.03305) 180.067°, 795.4 mb, 1733.0 m Echo picking up slightly to west of track.
210014 UTC (44.37672, -123.03346) 180.964°, 795.7 mb, 1719.0 m Some orographic enhancement/echo slant suggested on LHS. Cloud & precip probe data continue to look high quality. Melting aggregates, clusters of needles.
210737 UTC (43.97016, -123.03192) 179.703°, 795.6 mb, 1640.0 m Precip picking up as we
210917 UTC (43.87938, -123.03072) 178.763°, 795.4 mb, 1651.0 m Cold-frontal type shear (w/ suggestion of head structure) between 10-20 km range on LHS; some precip enhancement, but certainly no strong NCFR signature
211025 UTC (43.81692, -123.03029) 180.692°, 795.7 mb, 1625.0 m At Pt F, turning east, climbing to 9kft.Top of solid echos 3-3.5 km; top of BL near 2 km (round numbers)
211431 UTC (43.76334, -122.62691) 88.611°, 736.9 mb, 1098.0 m At Pt G, turning to track 360.Nice fallstreaks originating near 4-5 km.
211821 UTC (44.03061, -122.56519) .182°, 736.8 mb, 1827.0 m Continued fallstreaks w/evidence of generating cells
212338 UTC (44.43035, -122.56558) 359.102°, 736.6 mb, 1867.0 m Vr data show continued suggestion of cold-frontal type shear, immediately west of our track. Still no hint of NCFR enhancement however. Bulk of steady precip appears to be ahead of cold-frontal wind transition.
212718 UTC (44.71851, -122.56601) 1.039°, 736.7 mb, 2004.0 m Echoes again on the wane; perhaps general decrease of precip intensity to north, or alt. Tendency for SW-NE cold-frontal orientation putting best echoes farther east at north end of pattern.
213056 UTC (44.99189, -122.55467) 40.073°, 725.5 mb, 2200.0 m At Pt B, turning east & climbing to 11kft
213503 UTC (45.01260, -122.11125) 115.543°, 656.1 mb, 2077.0 m At Pt C, turning to track 180. Echo coverage more extensive to east of track.
213710 UTC (44.89366, -122.08392) 181.803°, 656.6 mb, 1972.0 m Some evidence of orographic enhancement (sharp western edge to heavier precip) 5-10 km west of our track. Tech took brief MPEG movie of tail showing frontal-like shear and associated west edge of frontal and/or orographic precip enhancement.
214242 UTC (44.54816, -122.08353) 179.451°, 656.2 mb, 2152.0 m Suggestion of KH waves at echo top to west of track last few min. More gen cells on RHS 2143-44. Some perturbations on J-W liquid water 2145-46.
215055 UTC (44.07003, -122.08437) 181.335°, 656.6 mb, 1670.0 m Picking up some significant rime ice on wings, J-W reaching ~0.5 g/kg
215303 UTC (43.94911, -122.08315) 179.848°, 656.5 mb, 2403.0 m Radar down at 2148:17. Lost de-ice on Prop #2, need to climb.
215510 UTC (43.82835, -122.08342) 181.248°, 656.4 mb, 2046.0 m Radar back up & recording on DR1. Convair will be at 14.5 kft, so we are requesting 16kft. At Pt H, turning east.
215937 UTC (43.77388, -121.64743) 89.487°, 572.1 mb, 3064.0 m At
220753 UTC (44.18489, -121.61774) .023°, 537.2 mb, 3475.0 m Nice visualization of precip spillover on crest to LHS. Echo dissipates totally 10-20 km east of our track.
221729 UTC (45.00552, -121.61293) 28.210°, 542.6 mb, 3719.0 m At Pt D. More precip extending east of our track here at north end, so will proceed with last leg (east-J).
222503 UTC (44.81872, -121.13411) 180.539°, 682.9 mb, 2419.0 m Now south-bound on east-J. Still at -6.1 oC, so not much hope of getting rid of ice. Fairly smooth even here in lee.
223217 UTC (44.36913, -121.13553) 179.246°, 682.9 mb, 2174.0 m Some echo on this leg, but not much, principally west of track, desert in view below. Planning J-K-G.
223621 UTC (44.11808, -121.12251) 179.916°, 682.8 mb, 2040.0 m Running out of echo, 5 min from turn. Shedding some ice here at –5 oC. Planning 10 kft J-K. Then climb to >13kft.
224244 UTC (43.74215, -121.11388) 123.986°, 682.9 mb, 1258.0 m At Pt J. Convair preparing to land for refueling; they had major icing issues, unsure if they want to execute 2nd pattern.
225306 UTC (44.26260, -121.47310) 322.695°, 683.2 mb, 2079.0 m Plan climb to FL 130 at K. Once again nice spillover coming off crest LHS
225459 UTC (44.36508, -121.55649) 356.377°, 654.3 mb, 2370.0 m At K, spiraling up. Consulted w/ Roles; suspended recording of Spectal Width and saved to IMPR1; according to Roles this will improve radar system stability (and save tape ;) Mix of pristine crystals (needles, dendrites) and amorphous forms as we climb.
230621 UTC (44.13600, -121.88629) 233.935°, 606.1 mb, 2316.0 m LF suggests increasing postfrontal activity (NNE-SSW bands?) immediately off shore. Some discussion of sticking with today's situation (vs. A separate flight tomorrow) to do postfrontal work.
231008 UTC (44.01292, -122.12607) 234.278°, 606.0 mb, 2636.0 m Elevated "secondary BB" feature exhibits top near our FL
232200 UTC (43.73032, -122.49013) 339.262°, 724.1 mb, 1865.0 m At Pt G. Turning to track 360. Dynamic slip pressure is iced up, so winds messed up, but can be corrected post-flight.
233106 UTC (44.37158, -122.57019) 1.593°, 735.5 mb, 2025.0 m Further suggestion of echo "plumes" coming off sloped terrain features to east (RHS) of our track past few min. However, echo definitely on wane as we proceed north abeam of less impressive terrain. Temps on this leg are running 3 °C cooler than 1st iteration.
234008 UTC (45.04402, -122.55222) 34.309°, 719.1 mb, 2224.0 m At Pt B, climbing to 11kft. Minimal shallow echoes here.
234417 UTC (45.09106, -122.12123) 103.131°, 655.0 mb, 2111.0 m At Pt C, turning to track 180.
000625 UTC (43.79105, -122.03868) 163.161°, 651.1 mb, 1831.0 m At Pt H, climbing to 13 kft. Precip once again picked up toward south end of pattern abeam of higher terrain
000950 UTC (43.71880, -121.70859) 87.814°, 606.4 mb, 2634.0 m At Pt I, turning to track 360. LF continues to suggest NNE-SSW banded structures--one roughly through our present location, and another more closely tied to coastal range, perhaps additional band(s) about 100 km offshore
001656 UTC (44.26968, -121.61063) 1.643°, 606.2 mb, 2874.0 m Just went through biggest bump of day, though nothing obvious on radar.
002258 UTC (44.75838, -121.61922) 359.929°, 606.3 mb, 2829.0 m Still has been suggestion of nice sloped (hydraulic jump?) type flow transition coming off crest on LHS
Will ferry Paine via Olympia at FL 140
002620 UTC (45.03315, -121.62498) 358.606°, 604.8 mb, 2752.0 m At Pt. D. Beginning ferry home.
002926 UTC (45.23274, -121.73640) 334.783°, 537.3 mb, 3658.0 m Switched to dual-PRF (3200/2133, Nyquist of +/- 48) for ferry. Setup file is MPRS1. Evidence of contaminated 1st trip echo (by 2nd trip) at 0034 etc etc.
004957 UTC (46.79881, -122.78369) 332.549°, 537.1 mb, 4679.0 m Radar system temporarily offline
010138 UTC (47.64162, -122.55238) 352.935°, 851.3 mb, 1146.0 m Back in echo, but no sign of 2nd trip, likely owing to low freezing level & absence of nearby terrain. Expecting 16R.
010848 UTC (48.11996, -122.34639) 67.652°, 884.8 mb, 779.0 m Secured radar system
011521 UTC (47.91954, -122.28584) 179.790°, 968.5 mb, 1.0 m Landed
S-Pol Radar Summary
The S-Pol radar was run continuously in the same mode of operation for the complete length of the field project.
Summary of
Launch times at:
1726 UTC 28 Nov
1813 UTC 28 Nov
2051 UTC 28 Nov
Summary of Leeside Sonde Launches
Launch times at: Black Butte Ranch, OR (a.k.a. ISS-3), Lat: 44.379, Lon:-121.679, Elev: 1027 m
1530 UTC 28 Nov
2100 UTC 28 Nov
0000 UTC 29 Nov
0250 UTC 29 Nov
Summary of NWS Sonde Launches from Salem (SLE)
Launch times:
1200 UTC 28 Nov (standard)
1500 UTC 28 Nov (special)
1800 UTC 28 Nov (special)
2100 UTC 28 Nov (special)
0000 UTC 29 Nov (standard)
0300 UTC 29 Nov (special)
Summary of Snow Crystal Ground Measurements
Measurement times:Every 15 minutes from
2330 UTC 28 Nov-0200 UTC 29 Nov (at


IOP 2, 29-30 Nov 2001
IOP 2: 29-30 November 2001
Time Period of IOP
1200 UTC 29 Nov-0000 UTC 30 Nov
Overview of IOP
The major storm of 28-29 November was followed the next day by a much less intense short wave trough, which passed over the radar area between 0900 UTC 29 November and 2100 UTC 30 November 2001. At 500 mb, this weak short wave moved rapidly from the west northwest from a longitude of 150oW at 1200 UTC 29 November (Fig. 1a) to 135oW by 0000 UTC 30 November (Fig. 1b). It was over the Oregon-Washington area at 1200 UTC 30 November (Fig. 1c). The trough was evident at 850 mb at 135oW at 0000 UTC 30 November (Fig. 2a), and by 1200 UTC it was affecting
Convair-580 Summary
No flight
P-3 Summary
No flight
S-Pol Radar Summary
The S-Pol radar was run continuously in the same mode of operation for the entire length of the field project.
Summary of
Launch times at:
1625 UTC 29 Nov
1914 UTC 29 Nov
Summary of Leeside Sonde Launches
Launch times at: Black Butte Ranch, OR (a.k.a. ISS-3), Lat: 44.379, Lon: -121.679, Elev: 1027 m
1515 UTC 29 Nov
1700 UTC 29 Nov
1850 UTC 29 Nov
2055 UTC 29 Nov
2300 UTC 29 Nov
Summary of NWS Sonde Launches from Salem (SLE)
Launch times:
1200 UTC 29 Nov (standard)
1500 UTC 29 Nov (special)
1800 UTC 29 Nov (special)
2100 UTC 29 Nov (special)
0000 UTC 30 Nov (standard)
Summary of Snow Crystal Ground Measurements
Measurement times:Every 15 minutes from
1500 UTC 29 Nov-2215 UTC 29 Nov (at


IOP 3, 30 Nov-01 Dec 2001
IOP 3: 30 November –
Time period of IOP
1200 UTC 30 Nov-1400 UTC 1 Dec
Overview of IOP
The third short wave in this rapid succession of frontal systems passed through during the period 0900 UTC 30 November and 2100 UTC 1 December 2001. A 500 mb trough formed over the ocean to the west of Oregon (Fig. 1a), moved westward as it intensified (Fig. 1b), and was located so that the 500 mb jet was over Oregon at 1200 UTC on 1 December (Fig. 1c). The accompanying 850 mb trough formed (Fig. 2a) and moved westward while intensifying (Fig. 2b) until it was situated with strong south southeasterly warm advection over Oregon at 1200 UTC on 1 December (Fig. 2c). The surface low was initially about 987 mb (Fig. 3a). It deepened to 980 mb by 0000 UTC on 1 December (Fig. 3b), and further deepened to 973 mb by 1200 UTC, when it was centered just west of
The ETL S-band profiler observations from 1400-1700 UTC showed the precipitation to be in a nearly continuous layer of snow containing convective fallstreaks extending downward from about 4 km AGL into a bright band located just above the ground (Fig. 7a, Fig. 7b). At about 0000-0300 UTC the warm-frontal portion of the frontal cloud system was moving across the S-Pol radar area (Fig. 4c, Fig. 4d). The S-band profiler showed a continuous layer of cloud with a bright band rising from about 1.0 to 1.2 km AGL in this warm frontal zone (Fig. 7c). In the apparent warm sector, the S-band profiler showed deeper and more discrete convection with a melting level at about 1.3 km (e.g., Fig. 7d). From 0900-1500 UTC 01 December, satellite imagery suggested that the cold-frontal portion of the cloud system was moving across the radar area (Fig. 4e, Fig. 4f). The S-band profiler showed a continuous layer of precipitation with the bright band dropping rapidly from 1.3 down to about 0.8 km AGL (Fig. 7e). By 1800 UTC the postfrontal region of convective cloudiness was passing over the region (Fig. 4g), and the S-band profiler was showing discrete convective cells (Fig. 7f). By 2100 the comma of the bent back occlusion was moving over the S-Pol area (Fig. 4h). The leading portion of the frontal cloud system had SE-NW oriented bands of enhanced radar echo at 0300 UTC 1 December (Fig. 5a).
By 0600 UTC the regions of enhanced echo were more globular (Fig. 5b). By 0900 UTC a band of strong echo, oriented roughly north-south, was just west of the S-Pol radar (Fig. 5c). At 1200 UTC a continuous broad region of echo, apparently associated with the front, was centered over S-Pol, with the bright band evident near the radar location (Fig. 5d). At 1500 UTC the back edge of the continuous frontal echo was over the mountains with cellular postfrontal echo moving in behind it (Fig. 5e). The ETL S-band profiler showed the echo associated with the frontal band aloft and lowering to the surface from 0900-1200 UTC 1 December (Fig. 6a). From 1200-1500 UTC, the echo seen by the S-band profiler was in a thick continuous layer with the bright band dropping as the colder air moved in (Fig. 6b). From 1500-1800 the echo seen by the profiler became a pattern of discrete convective cells (Fig. 6c).
Convair-580 Summary
No flight
P-3 Summary
No flight
S-Pol Radar Summary
The S-Pol radar was run continuously in the same mode of operation for the length of the field project.
Summary of
Launch times:
No launches
Summary of Leeside Sonde Launches
Launch times:
No launches
Summary of NWS Sonde Launches from Salem (SLE)
Launch times:
1200 UTC 30 Nov (standard)
0000 UTC 01 Dec (standard)
1200 UTC 01 Dec (standard)
Summary of Snow Crystal Ground Measurements
Measurement times:
No Measurements


IOP 4, 01-02 Dec 2001
IOP 4:
Time Period of IOP
1200 UTC 1 Dec-0000 UTC 2 Dec
Overview of IOP
Postfrontal conditions prevailed following the third short wave trough (described above). The satellite infrared sequence shows the convective cloudiness passing over the radar area (Fig. 1a, Fig. 1b, Fig. 1c). The P-3 aircraft flew a mission this day. When the aircraft arrived in the S-Pol radar area from 1500-1600 UTC 1 December 2001, the back portion of the frontal precipitation was over the mountains to the east (Fig. 2a, Fig. 2b). The ETL S-band profiler showed convective cells (as described above (Fig. 3). For about two hours (~1600-1800 UTC) the aircraft executed a dual-Doppler radar pattern in the moderately intense postfrontal precipitation over the mountains east of the S-Pol radar (Fig. 2c, Fig. 2d). At 1907 UTC the S-Pol particle identification algorithm indicated graupel at or just above the melting level over an extensive region (Fig. 4). From ~1900-2100 UTC the aircraft executed a microphysical sampling pattern (Fig. 2e, Fig. 2f, Fig. 2g, Fig. 2h). The P-3 left the study region at about 2100 UTC.
Convair-580 Summary
UW Flight Number:
1894
Period of Flight:
1456-1656 UTC,
Main Accomplishment of Flight:
Convair-580 returned to Paine Field just after crossing the
Instrument Problems:
-
Flight Scientist:
Peter V. Hobbs
Approximate UTC Timeline (Local time= UTC-8 hours) Activity for UW Flight 1894:
1508 |
Takeoff. |
1508-~1610 |
Transit to south of |
~1610-1656 |
Return to Paine Field. |
P-3 Summary
P-3 Flight Number:
011201H, Improve 02
Period of Flight:
1456 UTC 1 December-? UTC
Main Accomplishment of Flight:
The P-3 took dual-Doppler measurements in intense postfrontal precipitation.
Instrument Problems:
-
Flight Scientist:
Nick Bond
Approximate UTC Timeline (Local time= UTC-8 hours) Activity for P-3 Flight 02:
Engine Start
Block Out
Takeoff
145652 UTC (47.91171, -122.28354) 7.621°, 965.3 mb, 1255.0 m taxiing
rain before takeoff
150438 UTC (47.87386, -122.31438) 237.682°, 923.3 mb, 402.0 m takeoff
150729 UTC (47.79729, -122.49591) 225.594°, 812.3 mb, 1568.0 m in mod snow
151348 UTC (47.48796, -122.65120) 199.355°, 609.9 mb, 3709.0 m in clear air ci above
152455 UTC (46.82231, -122.96526) 194.306°, 553.2 mb, 4461.0 m in higher cloud layer
152834 UTC (46.61064, -123.03784) 192.813°, 553.6 mb, 4391.0 m in clear air again
152931 UTC (46.55721, -123.05576) 192.804°, 553.6 mb, 4107.0 m back in cloud
154012 UTC (45.90298, -123.03680) 174.783°, 558.6 mb, 4013.0 m in clear after light jolt in and out of clouds
154645 UTC (45.47778, -122.97495) 139.437°, 575.8 mb, 4208.0 m descending into clouds
155657 UTC (45.15850, -123.00327) 185.158°, 794.1 mb, 1745.0 m tail radar indicates good convection to west
171047 UTC (43.77438, -121.83636) 94.728°, 607.6 mb, 2571.0 m broke out on top - sunshine!
181936 UTC (44.14136, -122.50940) 61.082°, 538.1 mb, 4178.0 m in cloud..
62) 242.829°, 557.1 mb, 3875.0 m broken layer below, scattered clouds at flight level
205749 UTC (45.97282, -123.09065) 355.921°, 466.3 mb, 5413.0 m NW of Portland at 20K, between layers
S-Pol Radar Summary
Summary of Mobile Upstream Sonde Launches
Launch times at: Creswell, OR, Lat: 43.9200, Lon: -123.0250, Elev: 165 m
1700 UTC 1 Dec
1913 UTC 1 Dec
2229 UTC 1 Dec
Summary of Leeside Sonde Launches
Launch times at: Black Butte Ranch, OR (a.k.a. ISS-3), Lat: 44.379, Lon: -121.679, Elev: 1027 m
1455 UTC 1 Dec
1755 UTC 1 Dec
2055 UTC 1 Dec
Summary of NWS Sonde Launches from Salem (SLE)
Launch times:
1200 UTC 1 Dec (standard)
1500 UTC 1 Dec (special)
1800 UTC 1 Dec (special)
2100 UTC 1 Dec (special)
0000 UTC 2 Dec (standard)
Summary of Snow Crystal Ground Measurements
Measurement times:Every 15 minutes from
1500 UTC 1 Dec-2245 UTC 1 Dec (at Santiam Pass, Corbett, and Tombstone Sno Park)


IOP 5, 02-03 Dec 2001
IOP 5: 2-3 December 2001
Time Period of IOP
1200 UTC 2 Dec-1200 UTC 3 Dec
Overview of IOP
The fourth short wave in this multi-day sequence was a comma cloud, which formed in the cold air behind the main frontal zone of the long wave trough. The comma cloud was associated with a well defined 500 mb short wave trough moving toward and over Oregon from 1200 UTC 2 December 2001 to 1200 UTC 3 December (Fig. 1a, Fig. 1b, Fig. 1c). The passage at 850 mb was accompanied by the winds weakening and changing from southerly to westerly to northerly (Fig. 2a, Fig. 2b, Fig. 2c). The surface low pressure centered moved northeastward across western Oregon while rapidly weakening (Fig. 3a, Fig. 3b, Fig. 3c). The infrared imagery shows this cloud system approaching Oregon at 0600 UTC 2 December 2001 (Fig. 4a), and it moved into the radar area at 1200 UTC (Fig. 4b). By 1800 UTC it was over the Oregon Cascades (Fig. 4c), and by 0000 UTC 3 December it had moved north into Washington (Fig. 1d). The precipitation area of the comma cloud was moving over the S-Pol radar at 1500-1700 UTC 2 December. The radar echo showed this region of precipitation to be a contiguous region of weaker echo with embedded cells of moderate intensity, suggesting a convective substructure (Fig. 5a, Fig. 5b, Fig. 5c).
Convair-580 Summary
No flight
P-3 Summary
No flight
S-Pol Radar Summary
The S-Pol radar was run continuously in the same mode of operation for the entire length of the field project.
Summary of Mobile Upstream Sonde Launches
Launch times:
No Launches
Summary of Leeside Sonde Launches
Launch times:
No launches
Summary of NWS Sonde Launches from Salem (SLE)
Launch times:
1200 UTC 2 Dec (standard)
0000 UTC 3 Dec (standard)
1200 UTC 3 Dec (standard)
Summary of Snow Crystal Ground Measurements
Measurement times:
No measurements


IOP 6, 04-05 Dec 2001
IOP 6: 04-05 December 2001
Time Period of IOP
1630 UTC 4 Dec-0600 UTC 5 Dec
Overview of IOP
The fifth and sixth short waves in this multi-day sequence moved in rapidly from the west northwest on 3-4 December 2001. At 500 mb the first short wave trough was evident at 1200 UTC 3 December at about 145 oW (Fig. 1a). By 0000 UTC 4 December, this trough was at about 132 oW (Fig. 1b), and it was centered over the Washington and Oregon Cascades at 1200 UTC 4 December (Fig. 1c). The infrared satellite imagery shows a quasi-frontal cloud system associated with the first short wave trough moving into the S-Pol radar area in Oregon at 2300 UTC 3 December 2001 (Fig. 2a). At 0500 UTC 4 December the cloud area of the short wave was centered over the radar area, with one major component still northwest of the radar, and another band of enhanced brightness east of the radar (Fig. 2b). By 1100 UTC, the quasi-frontal cloud band had moved east of the radar, and postfrontal convective clouds were located in the western part of the radar area (Fig. 2c). By 1700 UTC , the enhanced cloud pattern of the second short wave trough was moving over the radar and had the appearance of a jet streak cloud system (Fig. 2d). This feature strengthened and moved in and became centered over the southern portion of radar area (Fig. 2e). The S-Pol low-level PPI scans were picking up echoes of precipitation moving into the area at 0500 UTC 4 December (Fig. 3a). At 0800 UTC a solid frontal-like band of precipitation about 80 km in width was centered over the radar (Fig. 3b). By 1100 UTC this main band of echo had moved over the mountains to the east, and the echoes in the vicinity of the radar had begun to look more postfrontal in character (Fig. 3c). Cellular echoes were still present at 1400 UTC but were smaller and weaker (Fig. 3d).
The P-3 and Convair flew in the second short wave, as it continued to intensify over the radar area. At 0000 UTC 5 December the enhanced infrared cloud top image was covering the southwestern quadrant of the S-Pol radar area, and the cloud area was being cut off abruptly on its eastern edge, apparently, by orographically induced downward motion (Fig. 4a). The P-3 entered the radar area at about 2300 UTC 4 December and was starting its dual-Doppler pattern at 0000 UTC 5 December (Fig. 5a). At 0300 UTC the satellite infrared enhance cloud top formed a frontal-like band oriented SW-NE and centered over the S-Pol radar (Fig. 4b). At this time the P-3 was flying a microphysical sampling pattern on an east-west track across the mountains east of the S-Pol radar (Fig. 5b). The Convair flew a vertical profile from 16,000 to 13,000 ft above the P-3 on west-east track over Santiam Pass. The ETL S-band profiler showed that the precipitation at this time was highly convective, with updrafts appearing at about 1.5 km AGL (Fig. 6).
Convair-580 Summary
UW Flight Number:
1895
Period of Flight:
2247 UTC 4 December-0151 UTC 5 December 2001
Main Accomplishment of Flight:
Vertical profile from 16,000 to 13,000 ft on west-east track over Santiam Pass. (P-3 flew below Convair-580.) Landed in Eugene.
Instrument Problems:
Possible problems with PMS 1-D cloud probe
Flight Scientist:
Peter V. Hobbs
Approximate UTC Timeline (Local time= UTC-8 hours) Activity for UW Flight 1895:
2257 |
Takeoff. |
2257-~0001 (12/5) |
Transit to start point. |
~0001-0023 |
West à east, 16,000 ft. |
~0023 à |
0050 East à west desc. to 14,500 ft. |
0050 à 0115 |
(waiting for clearance) West à east at 14,5000 ft. |
~0118 à ~0125 |
East à west desc. to 13,000 ft. |
~0125 |
Broke off at ~0125 UTC on west bound leg due to pilot's airspeed indicator going out. Measurements on descent into Eugene. |
0151 |
Engines off. |
P-3 Summary
P-3 Flight Number:
011204H, IMPROVE 03
Period of Flight:
2227 UTC 4 December-0327 UTC 5 December 2001
Main Accomplishment of Flight:
The P-3 took dual-Doppler and microphysical data in conjunction with the flight of the Convair.
Instrument Problems:
-
Flight Scientist:
Nick Bond
Approximate UTC Timeline (Local time= UTC-8 hours) Activity for P-3 Flight 03:
2:27pm Engine Start
2:32pm Block Out
2:39 pm Takeoff
Actual takeoff
entered cloud base
224526 UTC (47.72373, -122.51717) 230.612°, 781.3 mb, 2035.0 m wind 250o at 15 kts
224807 UTC (47.60429, -122.62686) 192.210°, 718.2 mb, 2596.0 m tail radar up 5 minutes ago.
225854 UTC (46.91788, -122.93411) 185.375°, 569.8 mb, 4345.0 m radar down. Convective tops around aircraft to 4.5 km.
230331 UTC (46.59182, -123.05453) 196. 23 cloud station up and working.
230640 UTC (46.36724, -123.11476) 175.418°, 571.0 mb, 4140.0 m radar back up 5 minutes ago.
231136 UTC (45.99902, -123.06897) 172.824°, 572.2 mb, 4064.0 m radar down. Within widespread echo at mid-levels. Radar was filling in before it went down. Temp -25.2 oC
231741 UTC (45.57755, -123.00696) 175.738°, 572.0 mb, 4368.0 m all radars up again. Within widespread/uniform ice cloud from 5 km to surface. Echoes surprisingly uniform even if with steep lapse rates.
231904 UTC (45.48827, -123.02010) 189.826°, 594.5 mb, 4087.0 m started decent to 6 k ft one minute ago.
232448 UTC (45.11684, -123.04106) 178.609°, 810.6 mb, 1759.0 m at 6 kt feet. Widespread echo around the aircraft to 75 km. Echoes light < 25 dBZ
232735 UTC (44.94235, -123.03590) just south of point A. To 25 dBZ over foothills 20 km west of aircraft. Nice gradual sloping echo field over foothills. 4.5 km deep. Temp -5.5 oC, winds 250o at 37 kts.
234707 UTC (43.76271, -123.02628) 162.932°, 797.9 mb, 1619.0 m At point F, starting climb to 8kt. Radar echo was weakening as we approached point F. Just light echo to15 dBZ within 20 km of aircraft.
235138 UTC (43.73425, -122.61497) 56.622°, 753.0 mb, 1457.0 m At point G, starting northbound leg at 8kt ft. Temp -8C, winds 242/38kts. Echoes below aircraft to 24 dBZ.
000510 UTC (44.68037, -122.56819) 359.471°, 752.7 mb, 1741.0 m Stratiform precip has filled in more around aircraft. Getting great doppler coverage and microphysics at -9 oC, winds 244/31kts.
000955 UTC (45.01089, -122.56090) 9.463°, 743.5 mb, 2009.0 m At point B, starting climb to 11 kft. Got some nice dendrites around –10 oC.
001155 UTC (45.12153, -122.43289) 70.908°, 669.9 mb, 2837.0 m reached 11 kft. Winds 255o/43kts, temp-15.7 oC, dewpoint-16.7 oC.
001425 UTC (45.10608, -122.16867) 136.625°, 669.8 mb, 2585.0 m stratiform precip to 24 dBZ. Some evidence of a secondary bright band around 2.5 km, probably within max dendrite growth region.
001630 UTC (44.97415, -122.10022) 176.733°, 669.9 mb, 2680.0 m reached point C a couple minutes ago. Winds 250o/42kts. temp-17 oC
002758 UTC (44.22675, -122.08504) 179.899°, 669.9 mb, 2282.0 m temps have gradually increased to -15.2 oC. winds 257o/42kts. Right at top of enhanced precip to 22 dBZ.
003435 UTC (43.78763, -122.08191) 164.033°, 666.3 mb, 1788.0 m At point H, climbing to 13 kft. Still in widespread precip. Did not notice any distinct precip enhancements over individual peaks during past leg. At 13kt temp=-19 oC, 283o/43kts.
003906 UTC (43.74596, -121.63779) 14.105°, 618.3 mb, 2583.0 m At point G at 13kft. Winds 270o/41kts. Precip covereage drops off significantly 15 km to the west of plane.
005110 UTC (44.59812, -121.61647) 359.603°, 617.8 mb, 2882.0 m radar down.
005151 UTC (44.64896, -121.61702) 359.558°, 617.9 mb, 2952.0 m radar quickly back up. Echoes only to the left of plane. Some evidence of sloping echo along the lee slope. Temp -19.5 oC, wind 270o/43kts
005700 UTC (45.022011447 UTC (44.53233, -121.59709) at point D, descending back down to 10kt. Encountered some lee wave turbulence just before point D.
010607 UTC (44.75910, -121.13535) 180.062°, 693.3 mb, 2301.0 m no much precip arround plane. Just to 5 DBUTC.
010857 UTC (44.57002, -121.13284) 189.086°, 692.4 mb, 2176.0 m Breaking southbound leg at lat of point Q. To start west leg at 13 kft. Very little echo here.
011024 UTC (44.53767, -121.23328) 270.525°, 642.2 mb, 2788.0 m reached 13kft. Temp -17.7 oC, winds 270o/40kts.
011512 UTC (44.53263, -121.63080) 271.160°, radar down for a couple minutes. Nice wave length structure in vertical velocity and a few good bumps.
011913 UTC (44.53313, -121.95842) 269.604°, 642.0 mb, 2321.0 m more widespread precip and dendrites. Started descent at 0121 UTC.
012522 UTC (44.53279, -122.46231) 269.800°, 752.2 mb, 1842.0 m ambient temperature about –9 oC; with large rimed dendrites and what appears to be some liquid water in cloud.
013023 UTC (44.52911, -122.87538) 268.495°, 752.3 mb, 2036.0 m Convair headed home about 1:20 UTC (lost air speed indicator).
013241 UTC (44.52745, -123.06622) 271.598°, 750.7 mb, 2317.0 m started climb and turn; uniform precip to west before we initiated turn.
014011 UTC (44.46234, -122.61966) 237.720°, 645.4 mb, 2943.0 m Very obvious secondary bright band extending across tail radar display; well below level of aircraft
014430 UTC (44.40684, -122.90321) 32.776°, 645.7 mb, 3296.0 m about over point M. Will hold 12k ft until point 0. -16.5 oC ambient. rimed dendrites.
015501 UTC (44.43151, -121.71146) 90.902°, 643.4 mb, 2572.0 m Wind holding right near 50 kt. Precip very steady state with little horizontal variation.
020030 UTC (44.39371, -121.61902) 282.060°, 644.9 mb, 1948.0 m Started descent to 10k ft. Very close to crest of Cascades - westbound.
020344 UTC (44.38945, -121.87445) 267.629°, 694.7 mb, 1544.0 m 10k ft ambient temp -13.5 oC; plenty of dendrites.
021522 UTC (44.37776, -122.82436) 270.147°, 694.6 mb, 2747.0 m Very near point M. 10K ft ambient temp as warmed to about -12.5C. Wind 256o at 35kt.
021825 UTC (44.37933, -123.07571) 277.089°, 693.7 mb, 2922.0 m End of leg west bound beginning climb....up up and away. Heading home....a keeper!
025838 UTC (47.32586, -122.73151) 8.994°, 808.0 mb, 1747.0 m radar taken down.
032237 UTC (47.90707, -122.28560) 178.341°, 985.6 mb, 9.0 m landed.
032705 UTC (47.90024, -122.28056) 176.644°, 985.6 mb, 6920.0 m Engine off and block in
S-Pol Radar Summary
The S-Pol radar was run continuously in the same mode of operation for the length of the field project.
Summary of Mobile Upstream Sonde Launches
Launch times at: Rowland, OR, Lat: 44.2800, Lon: -123.0650, Elev: 97 m
1630 UTC 4 Dec
2059 UTC 4 Dec
0131 UTC 5 Dec
0327 UTC 5 Dec
Summary of Leeside Sonde Launches
Launch times at: Black Butte Ranch, OR (a.k.a. ISS-3), Lat: 44.379, Lon: -121.679, Elev: 1027 m
2255 UTC 4 Dec
0055 UTC 5 Dec
0250 UTC 5 Dec
0450 UTC 5 Dec
Summary of NWS Sonde Launches from Salem (SLE)
Launch times:
0000 UTC 5 Dec (standard)
0300 UTC 5 Dec (special)
0600 UTC 5 Dec (special)
Summary of Snow Crystal Ground Measurements
Measurement times:Every 15 minutes from
2145 UTC 4 Dec-0300 UTC 5 Dec (at Santiam Pass, Corbett, and Tombstone Sno Park)


IOP 7, 05-07 Dec 2001
IOP 7: 5-7 December 2001
Time Period of IOP
2125 UTC 5 Dec-0030 UTC 7 Dec
Overview of IOP
Another short wave and frontal cloud band crossed Oregon between about 0000 and 1200 UTC 6 December 2001. The 500 mb trough was at 135o west at 0000 UTC (Fig. 1a) and had moved past Oregon by 1200 UTC (Fig. 1b). The 850 mb wind was turning to southwesterly at 850 mb at 0000 UTC (Fig. 2a) and had turned westerly following the front at 1200 UTC (Fig. 2b). The satellite imagery for the 12 hour period preceding the passage of the frontal system showed an interesting development in the enhanced cloud top pattern in the southern half of the S-Pol radar area (Fig. 3a, Fig. 3b). Precipitation associated with this feature was present on the S-Pol radar at 1200 UTC 5 December (Fig. 4a). This feature was passing over the ETL S-band profiler between 1200 and 1500 UTC 5 December (Fig. 5a). The S-band profiler showed convective structure in the form of vertically extensive fallstreaks.
By 1700 UTC only postfrontal-type orographic showers were evident over the mountains east of the radar (Fig. 4b). The Convair flew a brief mission in the radar area at around 2200 UTC, as the echo aloft (as defined by the circular echo at the 1.5 deg elevation angle of the S-Pol display) was moving into the S-Pol radar area (Fig. 6).
At 0000 UTC 6 December, the satellite imagery showed a solid SSW-NNE oriented band of cold cloud top passing over the radar area in association with the frontal system (Fig. 3c). On radar it appeared as a broad continuous region of light precipitation, with a bright band evident as a circle of high reflectivity near the radar in the 1.5 degree elevation base scan (Fig. 4c). Most of the echo in the picture is evidently snow above the 0 deg C level. At 0300 UTC, the echo in the frontal cloud band took on a fine scale cellular structure, seen both on the S-Pol radar and by the ETL S-band profiler (Fig. 4d, Fig. 5b) There was a double structure in the high cloud band associated with the frontal system.
The second band of enhanced infrared imagery passed through the radar area at 0600 UTC (Fig. 3d). The back edge of this feature corresponded to the surface frontal passage. The radar echo associated with this cloud band associated with the front was generally very light except over the mountains where it was manifested as showers of moderate intensity, which were aligned in the manner of wavelike rainbands (Fig. 4e). For many hours following the frontal passage orographic clouds remained over the mountains in the westerly flow. The cloud tops were quite low (e. g. at 1200 and 1800 UTC; Fig. 3e , Fig. 3f). Despite the low cloud tops the precipitation in this postfrontal orographic regime was of moderate intensity (Fig. 4f, Fig. 4g). This persistent postfrontal orographic precipitation was at least as intense and continuous as the earlier prefrontal (Fig. 4c) and frontal (Fig. 4e) periods. The persistent postfrontal precipitation appeared on the ETL S-band profiler as a continuous layer of precipitation with a well defined melting layer and fine-scale embedded cellular structure (Fig. 5c).
Convair-580 Summary
UW Flight Number:
1896
Period of Flight:
2125-2249 UTC, 5 December 2001
Main Accomplishment of Flight:
Transit flight from Eugene, Oregon, to Paine Field, Washington. Passage through ice clouds and virga at ~13,000 ft over Oregon.
Instrument Problems:
As for UW Flight 1895.
Flight Scientist:
Peter V. Hobbs
Approximate UTC Timeline (Local time= UTC-8 hours) Activity for UW Flight 1896:
No timeline form
P-3 Summary
No flight
S-Pol Radar Summary
The S-Pol radar was run continuously in the same mode of operation for the entire length of the field project.
Summary of Mobile Upstream Sonde Launches
Launch times at: Creswell, OR, Lat: 43.9200, Lon: -123.0250, Elev: 165 m
0058 UTC 6 Dec
0358 UTC 6 Dec
0602 UTC 6 Dec
Summary of Leeside Sonde Launches
Launch times at: Black Butte Ranch, OR (a.k.a. ISS-3), Lat: 44.379, Lon: -121.679, Elev: 1027 m
0000 UTC 6 Dec
0300 UTC 6 Dec
0600 UTC 6 Dec
Summary of NWS Sonde Launches from Salem (SLE)
Launch times:
0000 UTC 6 Dec (standard)
0300 UTC 6 Dec (special)
0600 UTC 6 Dec (special)
Summary of Snow Crystal Ground Measurements
Measurement times:Every 15 minutes from
0000 UTC 6 Dec-0600 UTC 6 Dec (at Santiam Pass, Corbett, and Tombstone Sno Park)
and from
2000 UTC 6 Dec-0030 UTC 7 Dec (at Santiam Pass Sno Park)


IOP 8, 08-09 Dec 2001
IOP 8: 8-9 December 2001
Time Period of IOP
1200 UTC 8 Dec-0600 UTC 9 Dec
Overview of IOP
A 500 mb short wave trough was at 137 deg west and approaching Oregon at 1200 UTC 8 December (Fig. 1). At 850 mb, the winds over Oregon were southwesterly ahead of the trough (Fig. 2), and the band of moisture being advected from the southwest at this level extended to 20 deg north (Fig. 3). The surface pressure pattern exhibited a rather weak trough off the coast at this time (Fig. 4). The frontal cloud band was approaching the northwest Oregon coast at 1200 UTC 8 December 2001 (Fig. 5a). By 1800 UTC the main frontal cloud zone was centered over the S-Pol radar (Fig. 5b). By 2100 UTC, S-Pol was seeing echo associated with the frontal cloud band ; it was a contiguous region of weak echo with some embedded cellular elements; the P-3 aircraft was beginning to fly a dual-Doppler pattern in this echo (Fig. 6a). The surface front was reportedly near the leading edge of this cloud band. The rear portion of the frontal cloud region had a more intense appearance with a sharp back edge and patches of colder cloud top that looked wavelike in some enhancements. Possibly these are another example of wavelike rainbands. This cloud band was moving across the northwestern portion of the S-Pol area by 0000 UTC 9 December (Fig. 5c). The radar echo was a contiguous region of diffuse snow echo of moderate intensity with a bright band surrounding the radar location in the 1.5 deg elevation PPI, and the two aircraft were flying a coordinated pattern, with the P-3 continuing the dual-Doppler pattern and the Convair flying a microphysics vertical profile (Fig. 6b, Fig. 6c).
The back edge of the radar echo associated with the frontal cloud band had a wavy continuous pattern of narrow intense echo when it passed the radar at 0300 UTC (Fig. 6d). It looked like a narrow cold frontal rain band but apparently was not, as the front was reportedly in the leading edge of the cloud band, as noted above. By 0600 UTC the frontal cloud region had passed the radar area (Fig. 5d), and the radar showed only weak postfrontal cells over the mountains to the east of S-Pol (Fig. 6e).
Convair-580 Summary
UW Flight Number:
1897
Period of Flight:
2018-2351 UTC, 8 December 2001
Main Accomplishment of Flight:
Profile from 7,000 to 17,000 ft through postfrontal rainband on Oregon coast (P-3 flew below Convair-580). Landed in Eugene.
Instrument Problems:
Counts in clear air on PMS 1-D cloud probe.
Flight Scientist:
Peter V. Hobbs
Approximate UTC Timeline (Local time= UTC-8 hours) Activity for UW Flight 1897:
2028 |
Takeoff. |
2028-2151 |
Transit. |
2151-2206 |
East à west through front at 7,000 ft. |
2209- |
2219 West à east climb 7,000 ft à 9,000 ft. |
2223-2232 |
East à west at 9,000 ft. |
2235-2244 . |
West à east at 11,000 ft |
2244-2255 |
East à west at 11,000 ft. |
2257-2310 . |
West à east climb to 13,000 ft |
2310-2317 |
East à west at 13,000 ft. |
2318 |
West à east climb to 17,000 ft. |
UW Flight Number:
1898
Period of Flight:
0024-0600 UTC, 9 December 2001
Main Accomplishment of Flight:
Takeoff from Eugene, Oregon. Profile from 19,000 ft down to minimum allowable altitude over Santiam Pass in postfrontal conditions (possibly same rainband in which measurements were obtained on UW Flight 1897).
Instrument Problems:
Counts in clear air on PMS 1-D cloud probe.
Flight Scientist:
Peter V. Hobbs
Approximate UTC Timeline (Local time= UTC-8 hours) Activity for UW Flight 1898:
0032 |
Takeoff. |
0032-0056 |
Transit to start point southwest at 17,000 ft. |
0056-0130 |
Southwest à northeast at 17,000 ft. |
0130 à 0151 |
Northeast à southwest climb to 19,000 ft. |
0151 à 0206 |
Southwest à northeast at 19,000 ft. |
0211 à 0225 |
Southwest ß northeast descent to 15,000 ft. |
0230 à 0240 |
Southwest à northeast at 15,000 ft. |
0243 à 0258 |
Southwest ß northeast descent. to 13,000 ft. |
0300 à 0312 |
Southwest à northeast at 13,000 ft. |
0318 à 0337 |
Southwest ß northeast descent to 11,000 ft. |
0341 à 0400 |
Southwest à northeast at 11,000 ft. |
0400-0430 |
From northeast to southwest at minimum altitude above terrain. (Little icing picked up—rainband?) |
0430-0447 |
CCN spectra measurements below cloud base just south of Eugene in in-flow air to orographic clouds. |
P-3 Summary
P-3 Flight Number:
011208H, Improve 04
Period of Flight:
1930 UTC 8 December-0324 UTC 9 December 2001
Main Accomplishment of Flight:
The P-3 flew a mixture of east-west legs through the rainband, and north-south box pattern legs.
Instrument Problems:
-
Flight Scientist:
Nick Bond
Approximate UTC Timeline (Local time= UTC-8 hours) Activity for P-3 Flight 04:
193042 UTC (47.0024, -122.28056) 348.466°, 990.1 mb, 9.0 m Engine Start
193746 UTC (47.90020, -122.28056) 178.822°, 989.9 mb, 9.0 m Block Out
194929 UTC (47.91655, -122.28580) 178.704°, 991.2 mb, 8.0 m Takeoff temp 8.2 oC, wind 185o/12 kts
195119 UTC (47.85594, -122.33766) 235.451°, 915.1 mb, 826.0 m at 700 m, wind 190o/43kts temp 4.3 oC; cloud base 1000 m; 210/40kts at 1500 m, temp 2.6 oC/0.4
195928 UTC (47.55371, -122.66574) 195.373°, 654.2 mb, 3474.0 m radar up, wind 217o/55kts at 3600 m; winds at 700 mb 10-20deg more southerly than progged by models.
200853 UTC (47.07281, -122.91345) 180.152°, 570.6 mb, 4545.0 m FSSP has been in zero bin (default) (not much except for top bin). Wind 220o/65Kts and temp -15.5 oC/-15.8, flying through mid-level ice, see precip 60 km to west over coastal mts.
202002 UTC (46.41760, -123.12372) 194.735°, 573.5 mb, 4103.0 m switched FSSP to bin 3 (seeing 4-5 bins) at 570 mb. Wind 216o/56kts
203052 UTC (45.76229, -123.04787) 174.400°, 585.2 mb, 3930.0 m start decent down to 6 kft.
203913 UTC (45.24809, -123.01306) 184.851°, 813.5 mb, 1780.0 m reached 6kft at point A; switched FSSP back to 1 bin as we descend into precip. Temp –8 oC at 3500m plan to head west to the coast at 44 23".
205349 UTC (44.34367, -123.03656) 187.153°, 813.8 mb, 1727.0 m turning towards west, will track along lat to 124.5o at 7kt ft, temp at 7kft is -2.2 oC, well defined precip band 25 km west of coast
210051 UTC (44.31748, -123.62224) 268.013°, 756.2 mb, 2252.0 m temp dropped to -4.8 oC at 7kft. Entering the leading edge of band.
210424 UTC (44.31105, -123.92717) 269.664°, 756.3 mb, 2044.0 m encountered some mod turbulence over coastal range. Well defined ne-SW band 20 nmi from coast. Near the coast, there is cyclonic shear, wind reduction to 226o/12kts
211219 UTC (44.29455, -124.59361) 266.523°, 754.2 mb, 2422.0 m penetrating band at 7kft. Winds slowly coming up to 240o/33kts. Temp at -5.0 oC. going to 125 oW then turning back to east.
212711 UTC (44.30285, -124.21559) 88.861°, 622.4 mb, 3915.0 m at the coast heading west at 13kft, temp -10.5 oC, precip band not as well defined near coast. FSSP set to level 1 a few minutes ago.
213240 UTC (44.30750, -123.61615) 90.302°, 629.5 mb, 3571.0 m started decent down to 7kft. A lot of SCW at –8 oC, not much ice.
213612 UTC (44.35722, -123.29138) .689°, 745.9 mb, 2428.0 m started turn to the northwest. Not much precip just to the east of coastal mountains.
214020 UTC (44.59759, -123.48404) 326.896°, 784.3 mb, 1740.0 m getting a lot of needles here at –4 oC. Heading to 123 50" to start first north-south leg.
214720 UTC (44.94147, -123.80867) 325.684°, 784.5 mb, 1636.0 m entering band. Mod turb. Winds came around to 280/20kts. Descending down to 6kft.
215032 UTC (45.03992, -123.79863) 153.784°, 815.6 mb, 1629.0 m heading south for Doppler leg at 6kft. Lots of nice dendrites at -3 oC.
215655 UTC (44.62613, -123.84238) 180.432°, 815.8 mb, 1552.0 m back in the needles. At -3 oC. Winds 280o/38kts. A nice sloping echo of leading edge of precip 20 nm east of plane
220607 UTC (44.03448, -123.84196) 177.844°, 815.3 mb, 1722.0 m winds have decreased 300o/11kts. More SCW and some needles
221023 UTC (43.75362, -123.83566) 219.179°, 815.4 mb, 1453.0 m stared turn to west at 6fkt.
221447 UTC (43.74487, -124.17946) 329.985°, 815.1 mb, 1790.0 m heading north along band at 6kft. Right along precip band (to 25 dbZ), which has broadened as it made landfall. Temp -3.5 oC, wind 283o/35kts
221832 UTC (43.97832, -124.17075) 359.193°, 815.7 mb, 1806.0 m right in frontal band, nice dendrites, wind 280o/43kts. Some mod bumps. Winds down to 304o/12kts 8 minutes later.
222950 UTC (44.65799, -124.16823) 359.817°, 816.8 mb, 1783.0 m precip is quite stratiform (no defined band anymore). Very little or no enhancement of precip over coastal range even though winds 280o/12kts.
223518 UTC (44.99809, -124.15778) 42.150°, 816.8 mb, 1782.0 m started turn to east. Wind 293o/21Kts at 6kft. Temp -3.5 oC; nice dendrite-like particles.
223837 UTC (44.98188, -123.84419) 147.255°, 816.9 mb, 1500.0 m turn to south. Retracing previously done southbound leg. Wind 300o/23kts. Precip enhancement more evident over coastal range.
225430 UTC (43.91177, -123.82748) 185.301°, 816.6 mb, 1534.0 m winds increasing again to 290o/35kts
225603 UTC (43.81120, -123.83583) 195.913°, 816.2 mb, 1463.0 m turn to head west back to coast for another box. Winds 288o/37kts temp -3.8C. Within a broad straitform band to 30 dBZ near surface.
225852 UTC (43.76714, -124.04846) 258.232°, 816.4 mb, 1635.0 m radar taken down (LF was frozen). Winds up to 280o/43kts at 6kft
230227 UTC (43.90622, -124.16901) 1.529°, 816.8 mb, 1791.0 m made turn to north a few minutes ago. Radar back up.
232009 UTC (44.99059, -124.15999) 27.526°, 816.3 mb, 1790.0 m start turn to east at 6kft. Temp -4.0 oC. 262o/14kts.
232849 UTC (44.64435, -123.83098) 179.288°, 816.7 mb, 1682.0 m aircraft turned to south ~10 min ago along same southbound leg.
233214 UTC (44.41893, -123.81813) 124.741°, 816.8 mb, 1571.0 m turn to east half way through track. Report of fropa at S-pol and precip is at the Casacade foothills. Still in widespread stratiform echo to25 dBUTC.
233643 UTC (44.38310, -123.40706) 164.631°, 816.6 mb, 1459.0 m turn to south to finish leg in the lee of the coastal range. Temp -2.6 oC, wind 290o/27kts
234650 UTC (43.76064, -123.32285) 84.884°, 816.4 mb, 1436.0 m turn east to head towards point to start lawnmower patterns. Wind 266o/17Kts some needles and SWC drops.
234953 UTC (43.78027, -123.03145) 34.979°, 816.7 mb, 1569.0 m heading north at point F. Wimd 264o/10Kts. Broader precip band orientated NNE-SSW.
000518 UTC (44.74072, -123.03261) 357.737°, 816.8 mb, 1723.0 m nice overhanging echo in the lee of the coastal range to the west of track. Wind 270o/14Kts. Temp -3.0 oC
000859 UTC (44.98566, -123.03218) 15.608°, 816.0 mb, 1750.0 m started east turn at point A. Ascending up to 8kt ft. At 8kft, temp -6.3 oC, wind 275o/39kts.
001259 UTC (45.01235, -122.60570) 107.345°, 756.6 mb, 2016.0 m At point B, heading south at 8kft. Wind 274o/33Kts temp -6.2 oC, plate like ice particles. Good radar coverage on either side of plane.
001546 UTC (44.83629, -122.56950) 180.569°, 757.2 mb, 1641.0 m radar down at 00:15:00, back up at 00:18:22UTC
003042 UTC (43.88220, -122.56665) 179.995°, 757.1 mb, 1632.0 m penetrated through front at 8kft 10 min ago. Winds now 235o/24kts. Downward sloping echo over windward slope (front?)
003208 UTC (43.79451, -122.56262) 151.953°, 755.1 mb, 1889.0 m At point G, heading east. Ascended up through shear layer. Wind 218o/47Kts at 11kft temp -9.0
003726 UTC (43.80333, -122.05820) 8.581°, 674.0 mb, 1853.0 m At point H, heading north. Echo very weak (5DBUTC) under plane, but some enhancement (to 25 dBZ) over windward slopes
005308 UTC (44.97742, -122.08389) 353.379°, 674.2 mb, 2660.0 m At point C, heading west back to point B. At 11kft, temp -11.3 oC, wind 242o/30kts. Start decent to 8kft at 00:56:00UTC
005849 UTC (45.00520, -122.53674) 245.799°, 747.5 mb, 1932.0 m At point B, heading south at 8kft. Temp -7.0 oC, wind 286o/30kts
011735 UTC (43.79920, -122.56389) 152.371°, 756.3 mb, 1947.0 m At point G, heading east to point H, climbing to 11 kft. At 11kft, winds 222o/43kts, temp -10.5 oC
012206 UTC (43.77466, -122.12546) 75.845°, 675.4 mb, 1608.0 m At point H, heading north to point C. Start of echo 20 nmi to the east of plane (which is near the crest),. Some spillover evident.
014008 UTC (45.00423, -122.17944) 272.472°, 706.2 mb, 1664.0 m At point C, heading west to point B. Descending down to 8kft.
014412 UTC (45.00835, -122.50406) 261.594°, 756.5 mb, 1869.0 m At point B, heading south to point G at 8 kft., wind 285o/17Kts, temp -7.1 oC
020310 UTC (43.78083, -122.55771) At point G, heading to point H, ascending to 11 kft. At 11kft, wind 245o/27kts.
020834 UTC (43.78786, -122.07257) 358.298°, 674.1 mb, 1863.0 m At point H, heading north. Wind 238o/35Kts. Temp -11.8 oC. echo extends to crest, but fairly weak to 24 dBZ, tops to 17 kft.
021406 UTC (44.18874, -122.08324) .261°, 674.0 mb, 2815.0 m winds slowly veering to 255o/23kts. Temp -12.0 oC. Echo tops becoming more shallow. Some enhancement over ridges.
022708 UTC (45.11547, -122.10173) 336.687°, 648.0 mb, 2305.0 m At C, heading home. Interesting case, great documentation of microphysical/precip evolution of a landfalling front.
025645 UTC (47.23756, -122.78838) 15.834°, 856.3 mb, 1344.0 m radar taken down. Freezing level 1200 m.
032022 UTC (47.91183, -122.28566) 179.097°, 991.3 mb, 9.0 m landed. Penetrated nice Puget Sound convergence zone to the north of Paine. +- 3-4 m/s vertical motion. Nice shear layer from 270o/20 kts at 900 m to 220o/12kts at 200 m
032440 UTC (47.90025, -122.28049) 260.359°, 250.6 mb, 9.0 m block in
S-Pol Radar Summary
The S-Pol radar was run continuously in the same mode of operation for the entire length of the field project.
Summary of Mobile Upstream Sonde Launches
Launch times at: Creswell, OR, Lat: 43.9200, Lon: -123.0250, Elev: 165 m
1816 UTC 8 Dec
2118 UTC 8 Dec
0021 UTC 9 Dec
Summary of Leeside Sonde Launches
Launch times at: Black Butte Ranch, OR (a.k.a. ISS-3), Lat: 44.379, Lon: -121.679, Elev: 1027 m
1600 UTC 8 Dec
1800 UTC 8 Dec
2100 UTC 8 Dec
0000 UTC 9 Dec
0300 UTC 9 Dec
0600 UTC 9 Dec
Summary of NWS Sonde Launches from Salem (SLE)
Launch times:
1200 UTC 8 Dec (standard)
1500 UTC 8 Dec (special)
1800 UTC 8 Dec (special)
2100 UTC 8 Dec (special)
0000 UTC 9 Dec (standard)
0300 UTC 9 Dec (special)
Summary of Snow Crystal Ground Measurements
Measurement times:Every 15 minutes from
1800 UTC 8 Dec-0500 UTC 9 Dec (at Santiam Pass, Corbett, and Tombstone Sno Park)


