IOP 13: 16-17 December 2001
Time Period of IOP
2300 UTC 16 Dec-0815 UTC 17 Dec
Overview of IOP
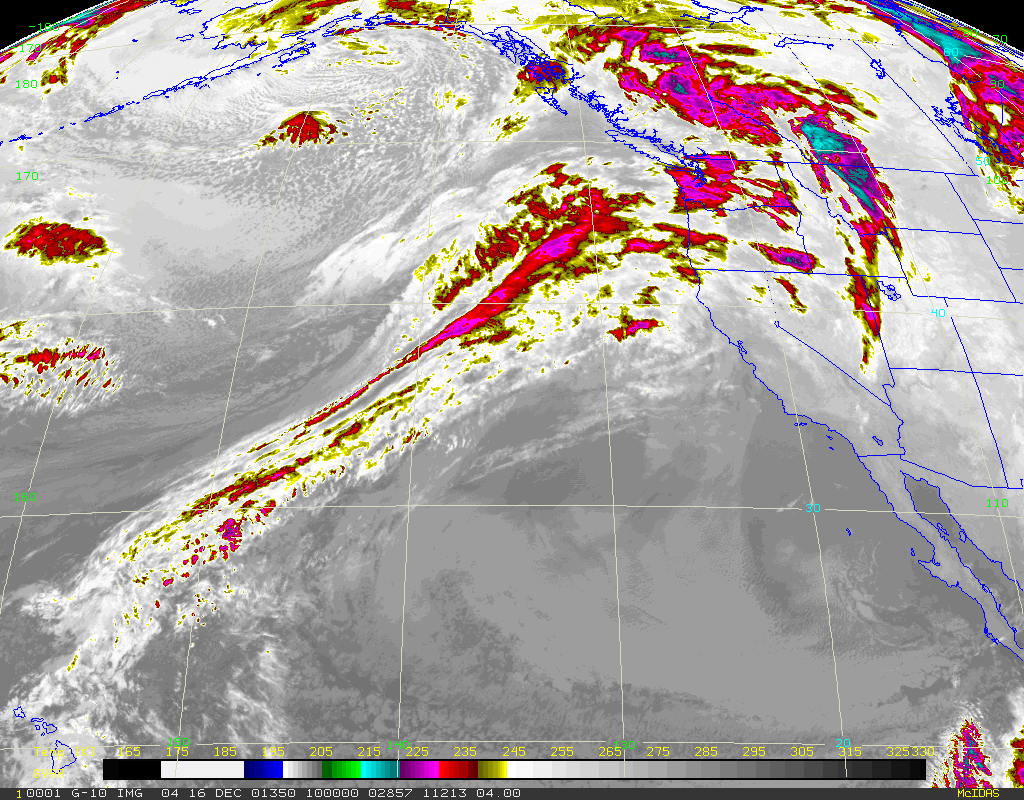
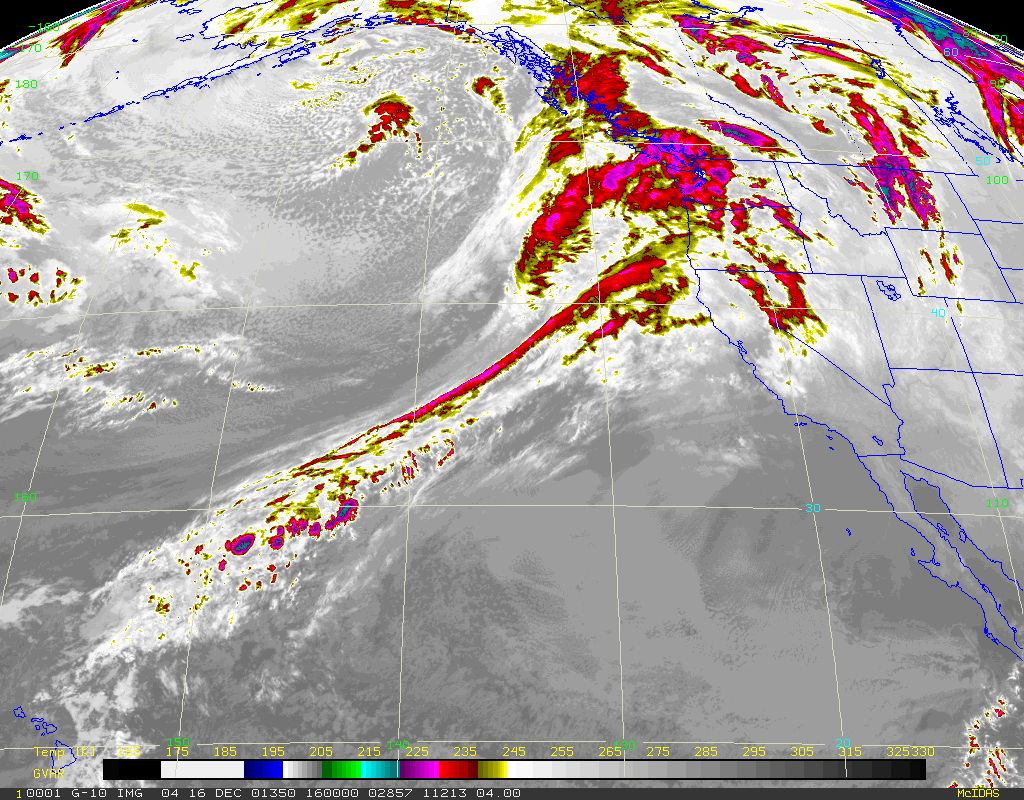
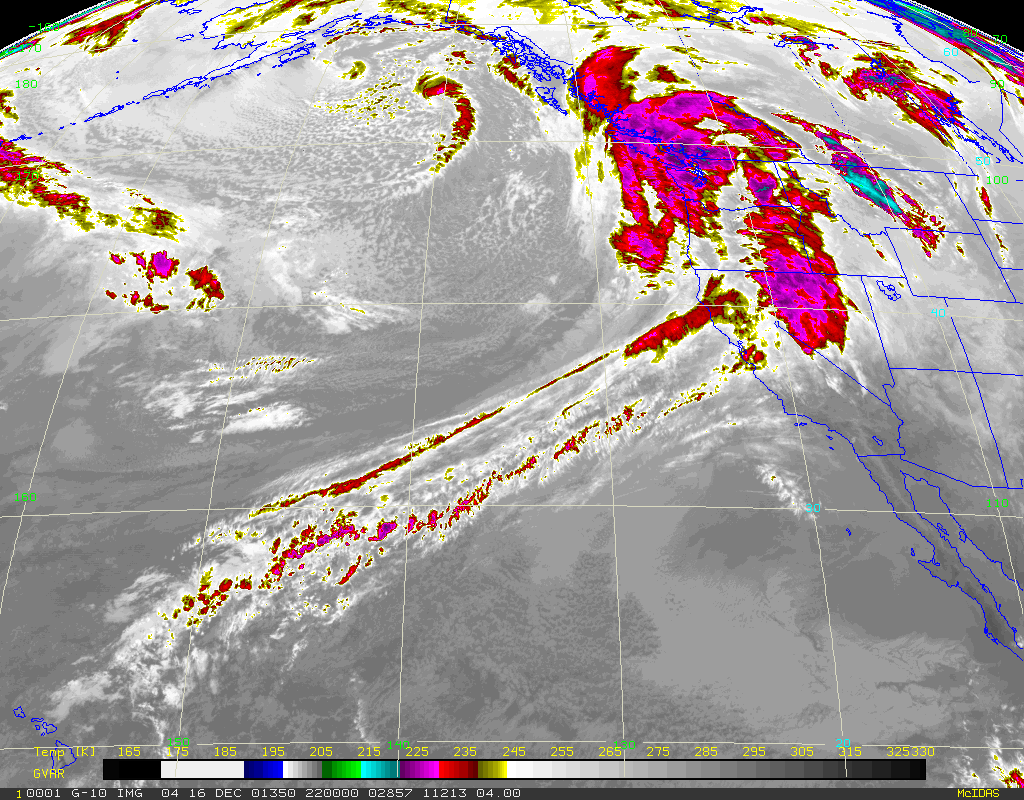
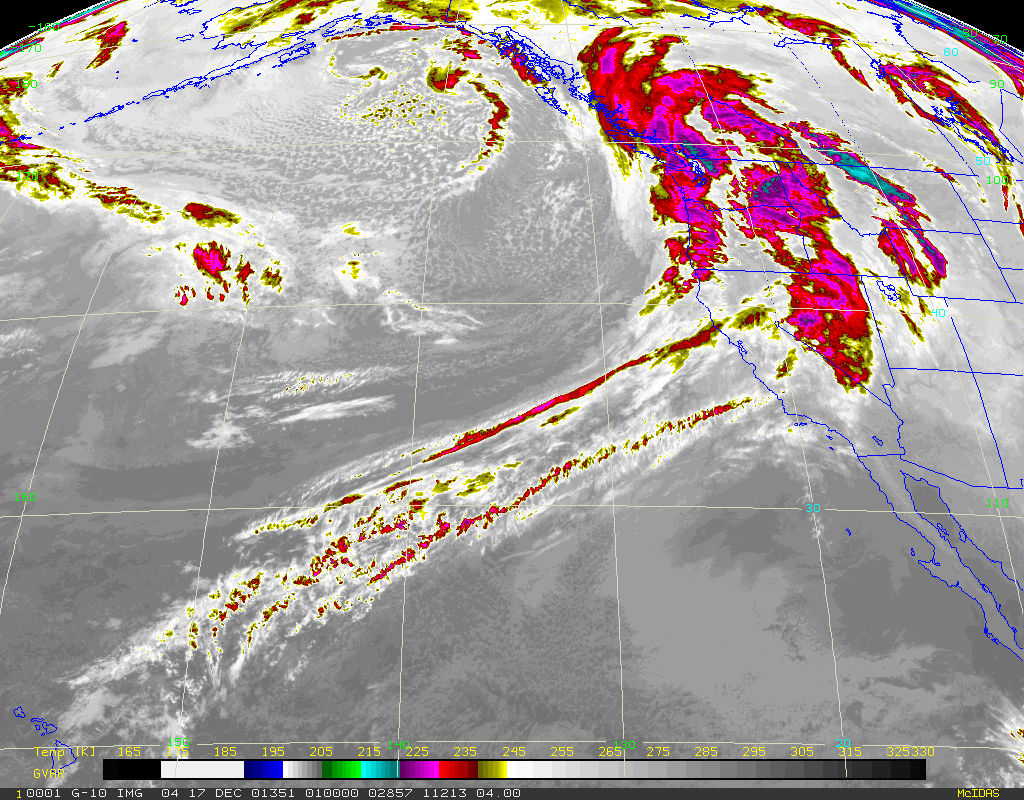
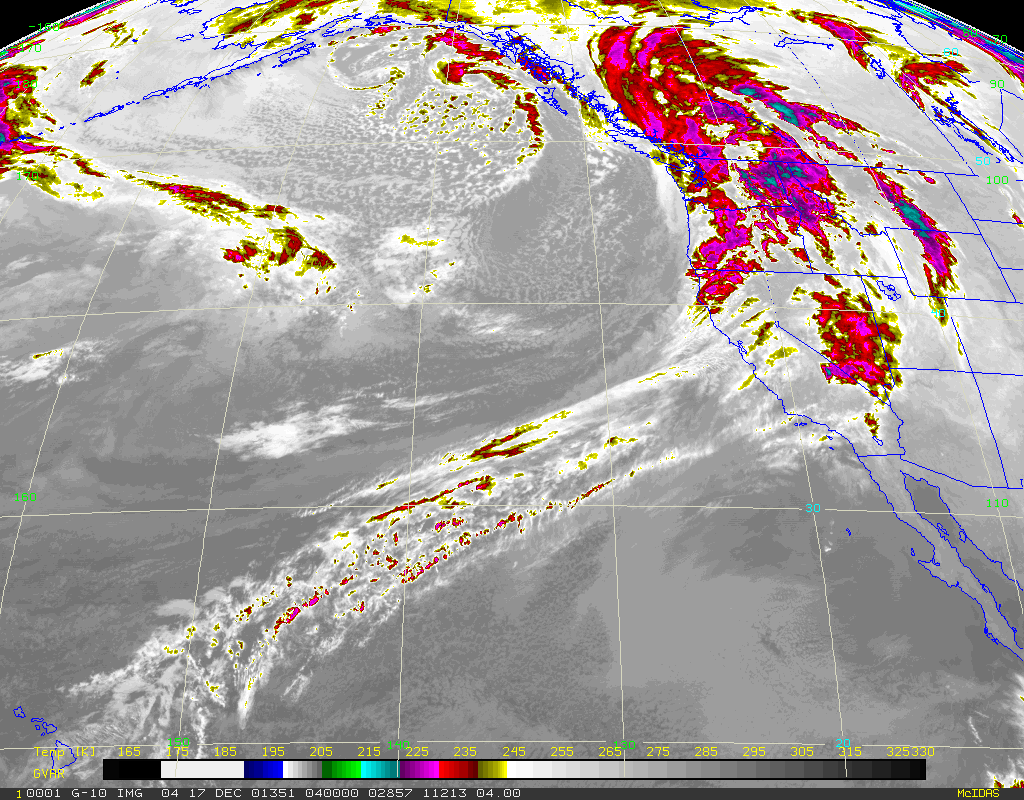
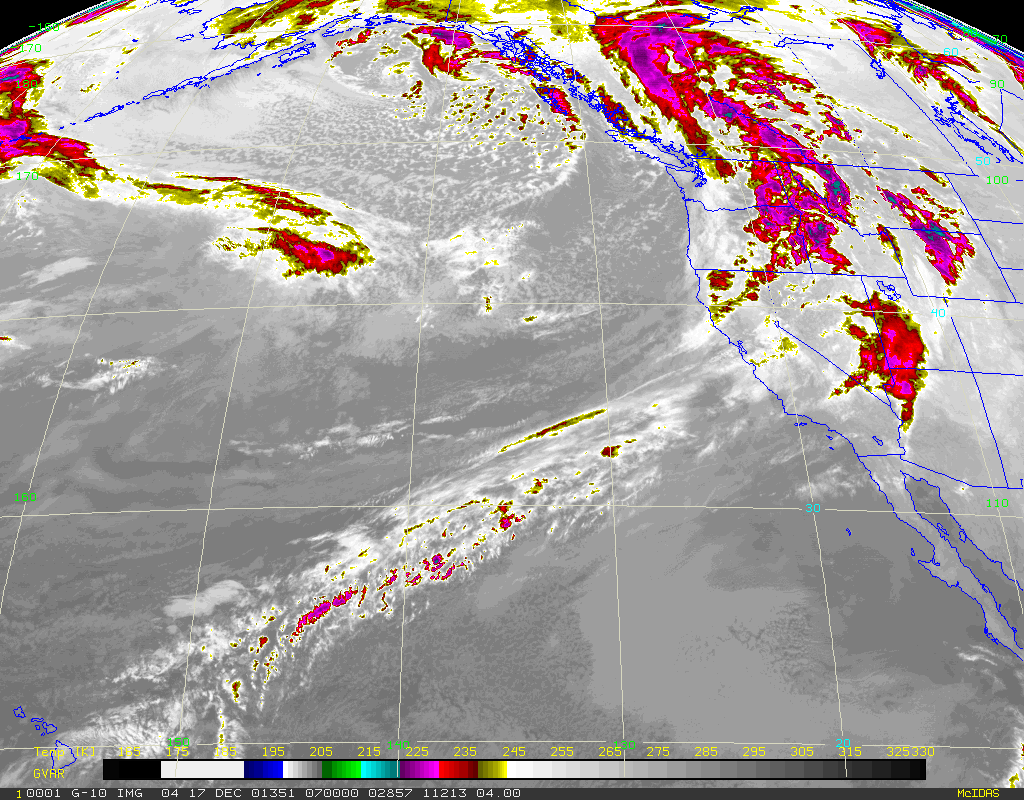
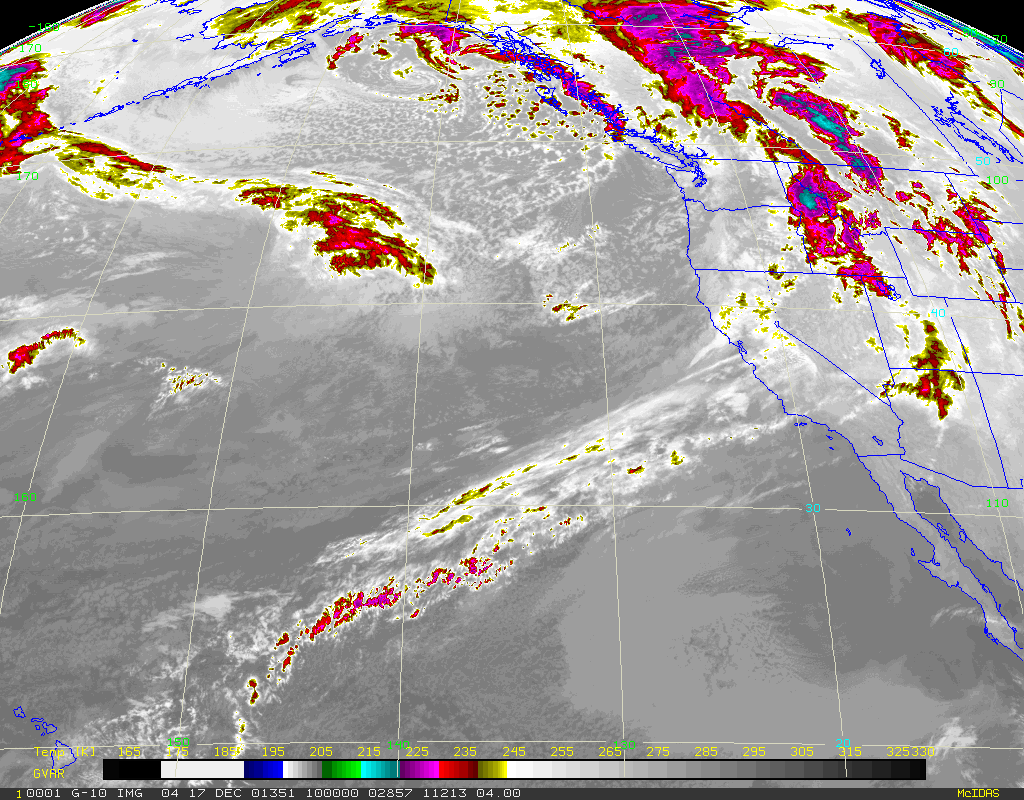
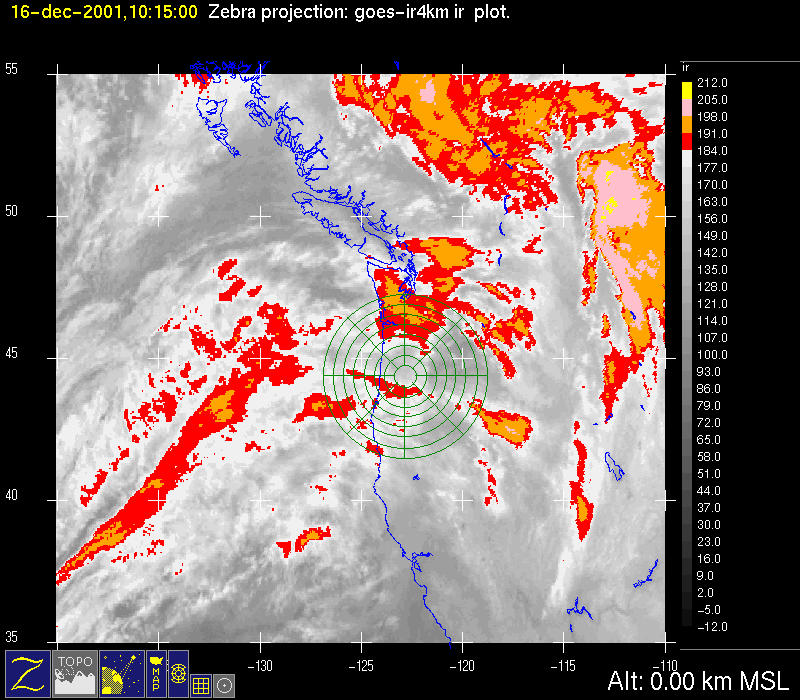
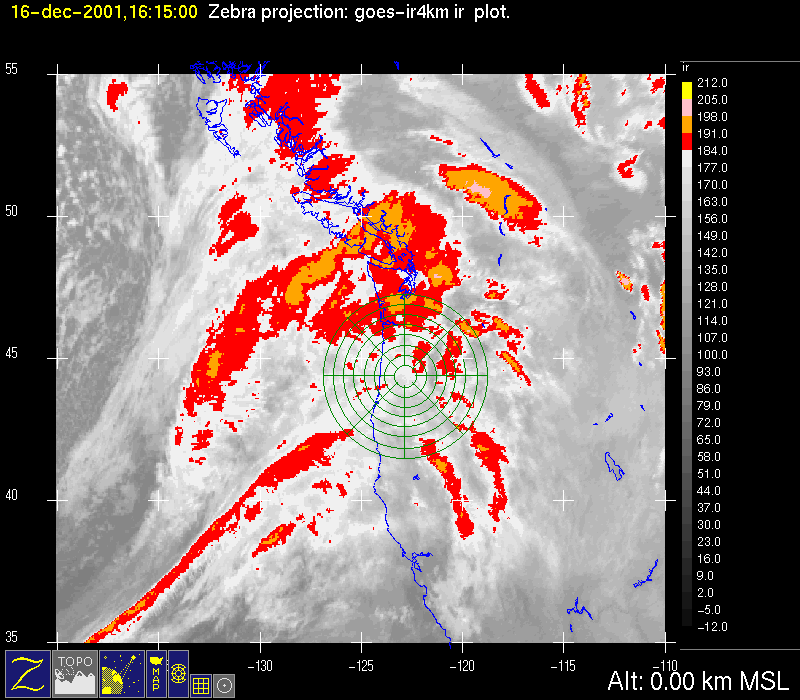
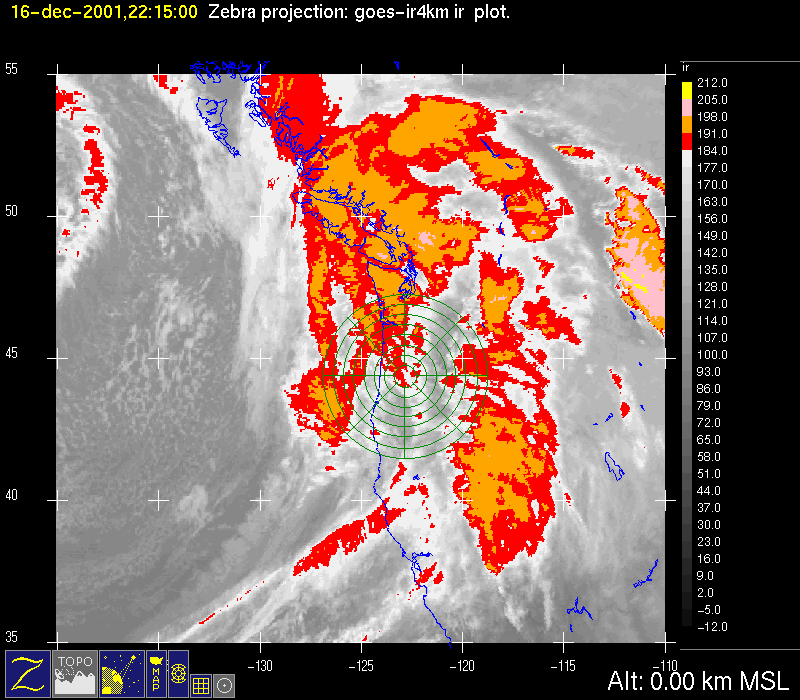
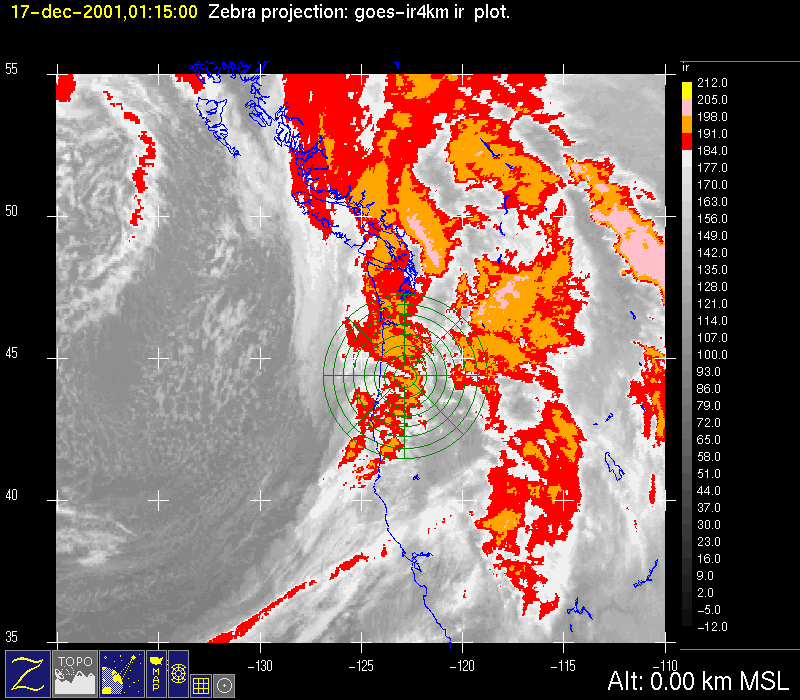
On 15-16 December, two frontal waves were located along the frontal system moving into the Pacific Northwest (see previous discussion). At 1000 UTC 16 December, the infrared satellite imagery showed the first frontal wave to the east of the Cascades; a region of enhanced cloudiness in advance of the leading edge of the warm-frontal clouds of the second wave was located over Washington at this time (Fig. 1a). A southward extension of the feature over Washington was over the S-Pol radar area (Fig. 2a). Warm-frontal clouds of the second wave were moving over the S-Pol area at 1600 UTC (Fig. 1b, Fig. 2b). By 2200 UTC, the cold-frontal cloud zone of the second wave was moving across the S-Pol radar area from the west (Fig. 1c), and clouds were being suppressed east of the Cascades (Fig. 2c).
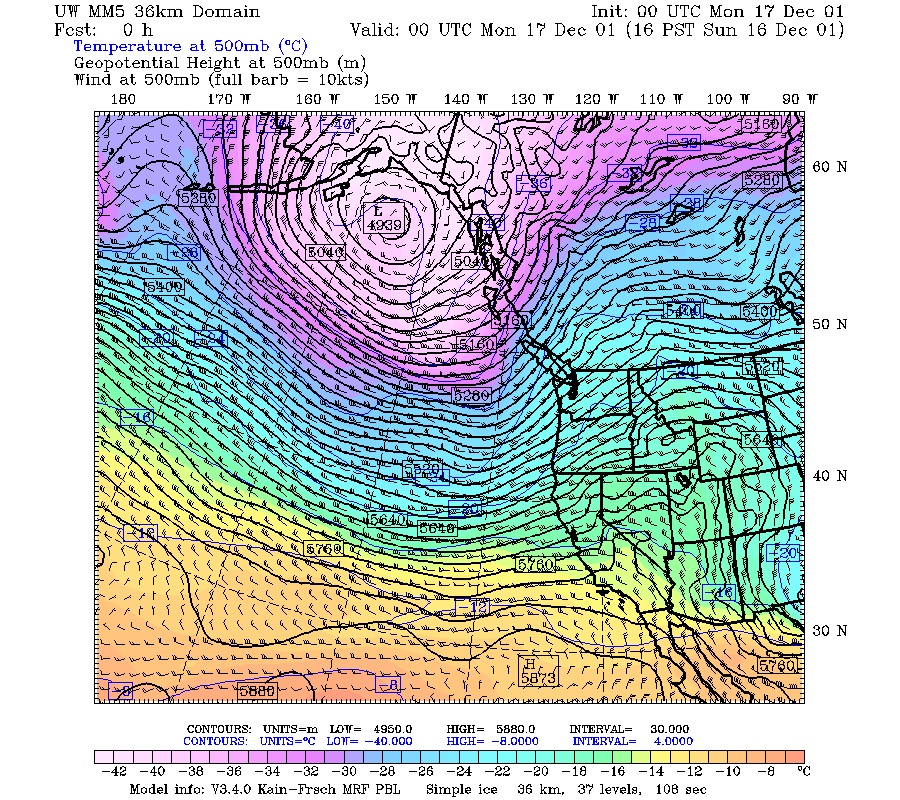
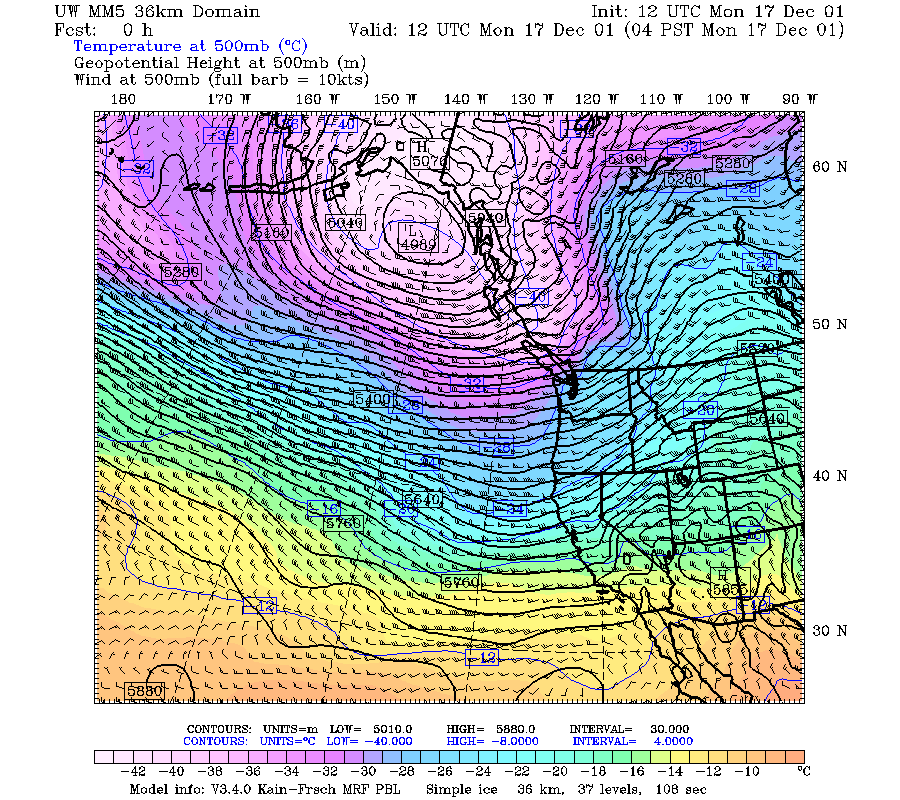
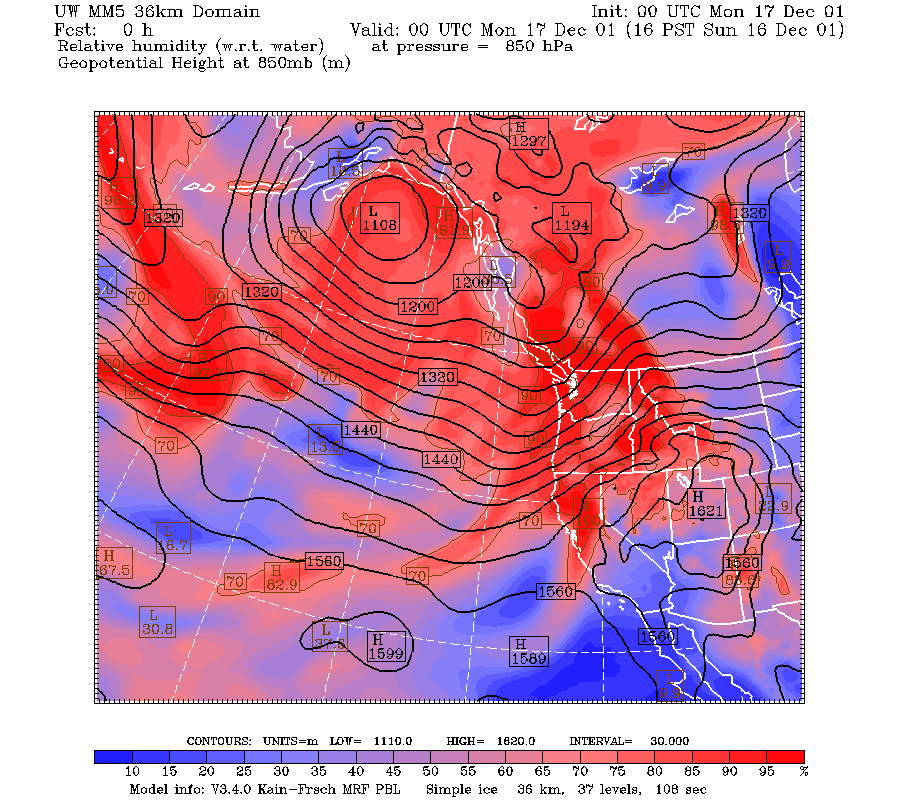
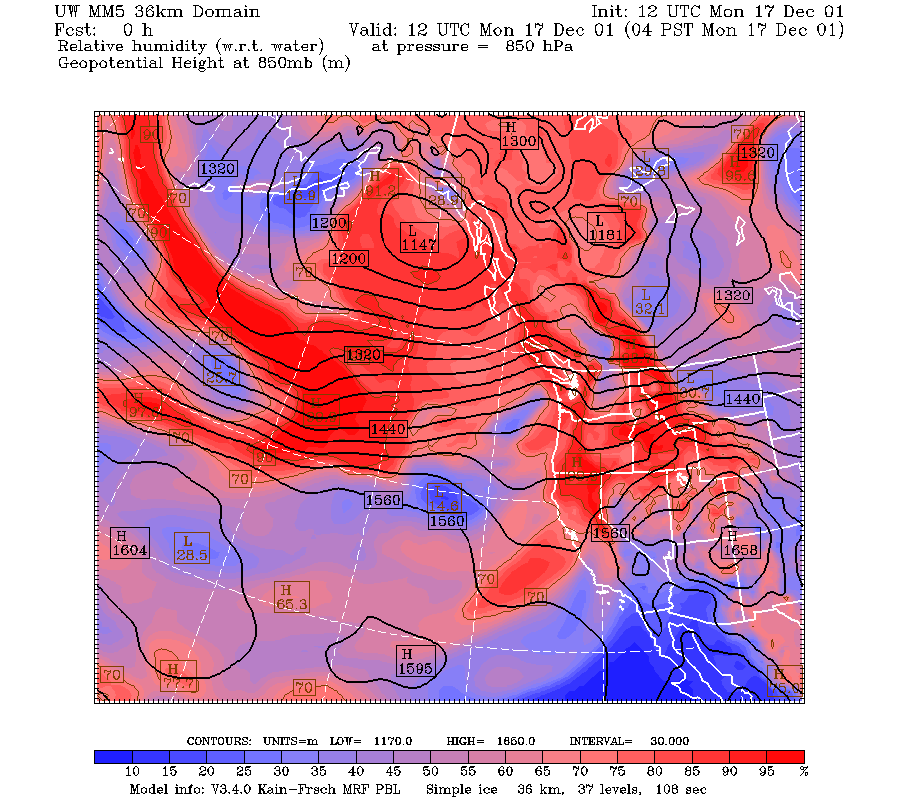
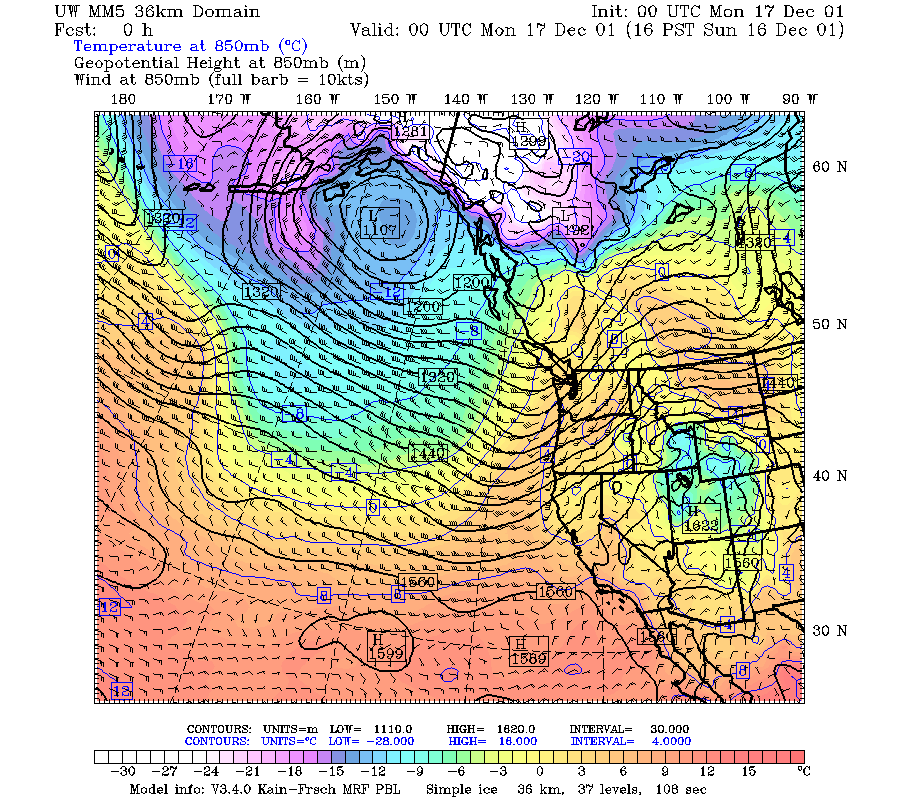
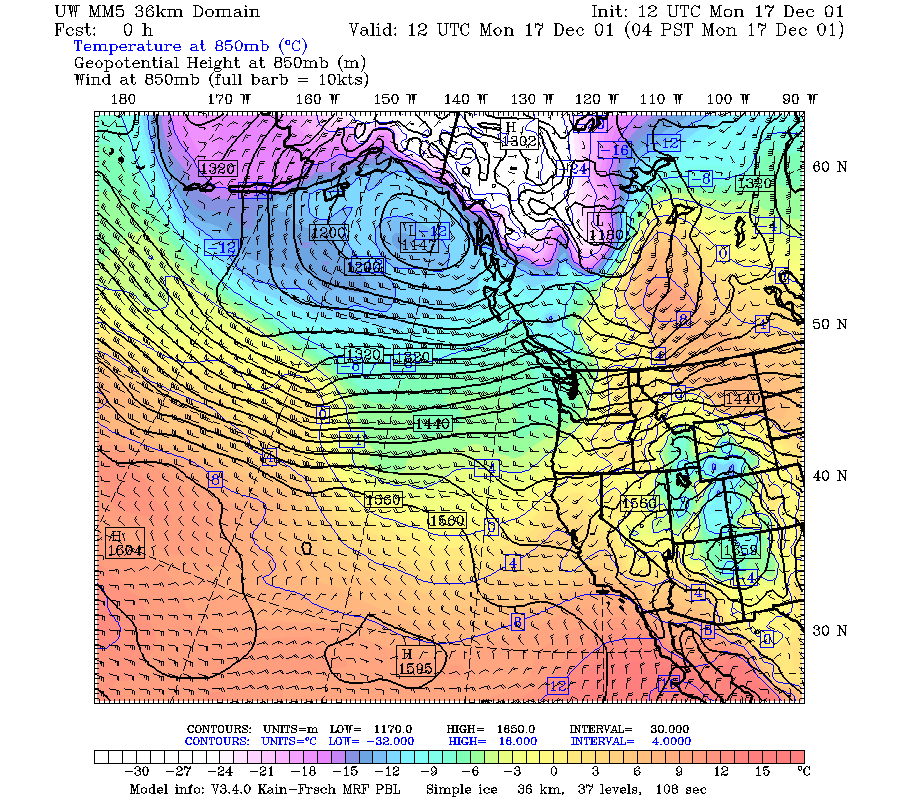
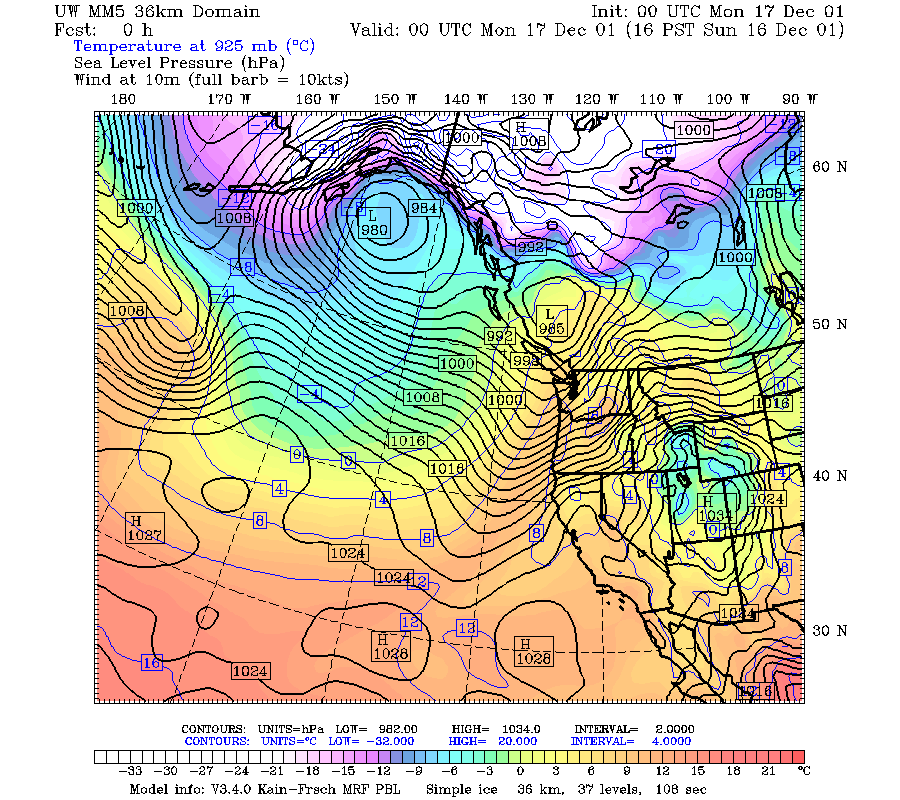
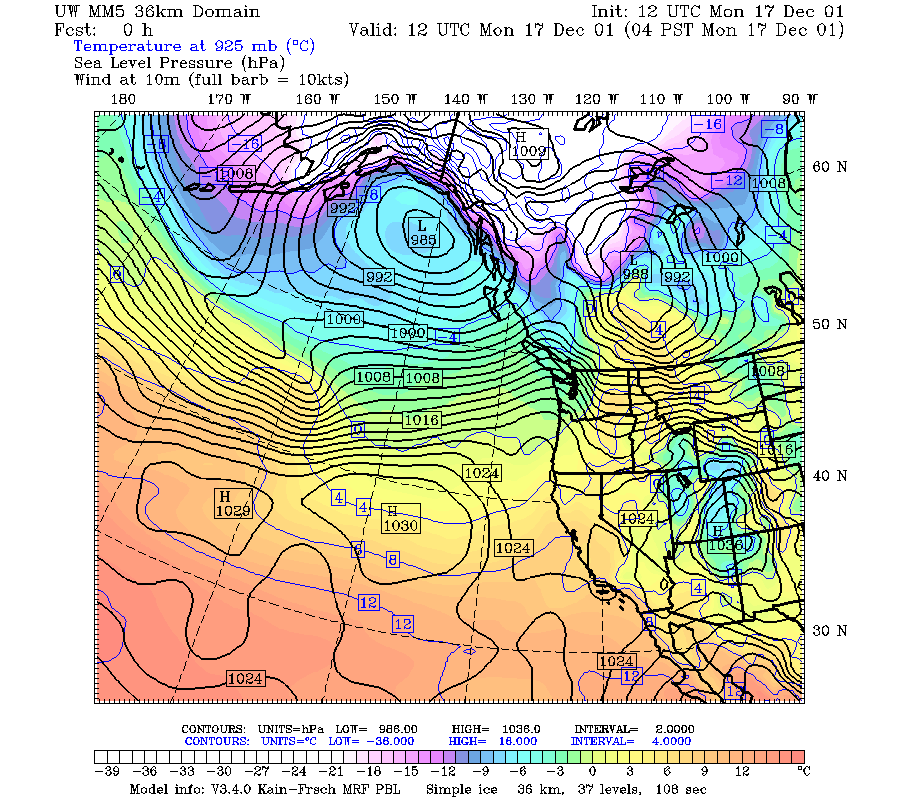
At 0000 UTC 16 December, the 500 mb trough was at 132 deg oW and moving rapidly toward Oregon and Washington (Fig. 3a). By 1200 UTC it had pass through the region (Fig. 3b). The 850 mb winds were strong southwesterly at 0000 UTC over Oregon in the warm air ahead of the trough (Fig. 4a). These winds turned to westerly with the trough passage (Fig. 4b). The tongue of high relative humidity extended southwestward into the tropics (Fig. 5a, Fig. 5b). At 0000 UTC, the cold front was approaching the coast (Fig. 6a), and by 1200 UTC it had passed through Oregon with the ridge building up behind it (Fig. 6b).
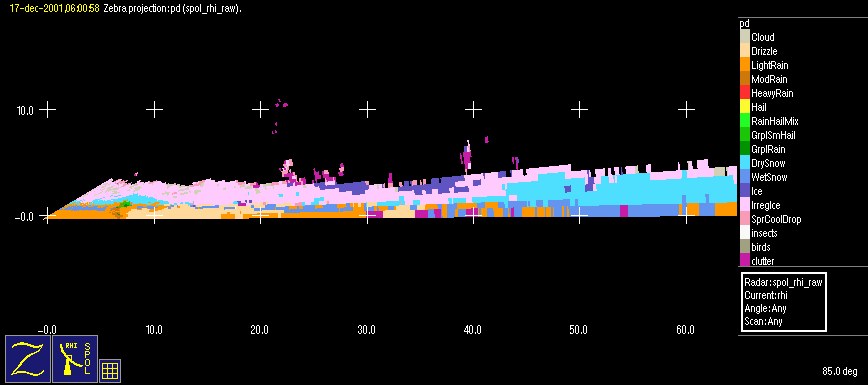
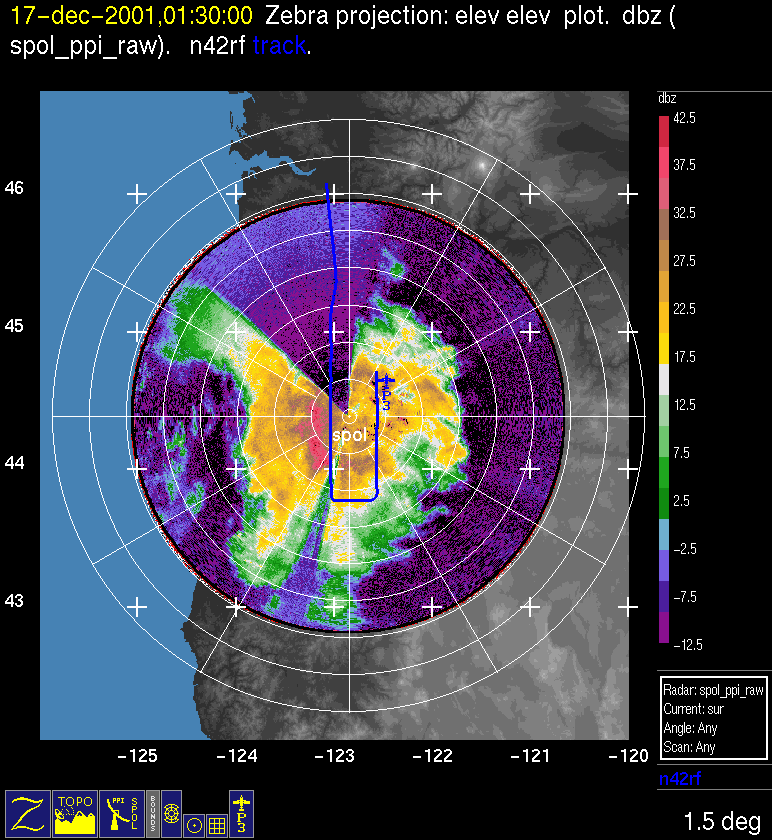
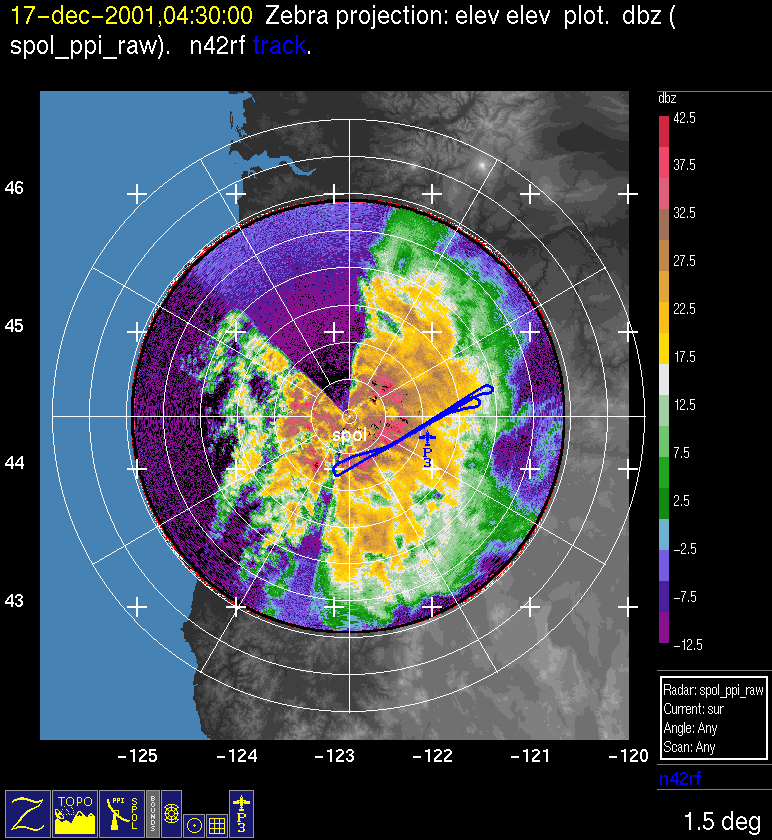
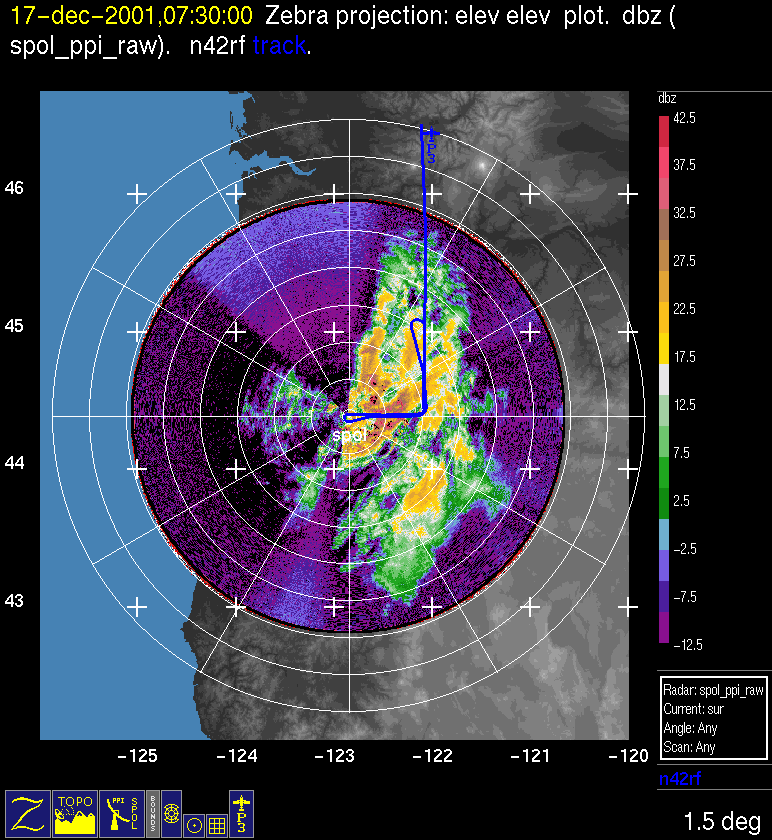
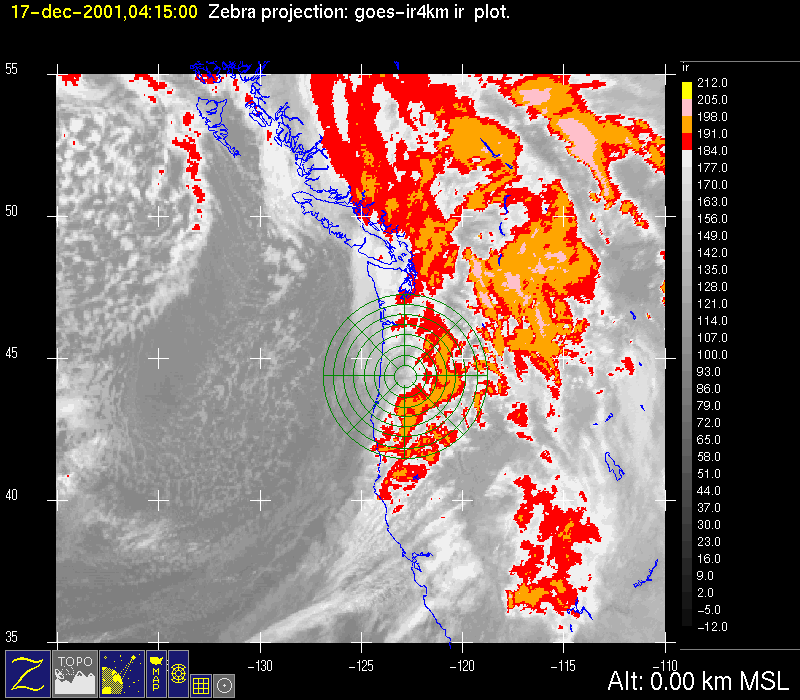
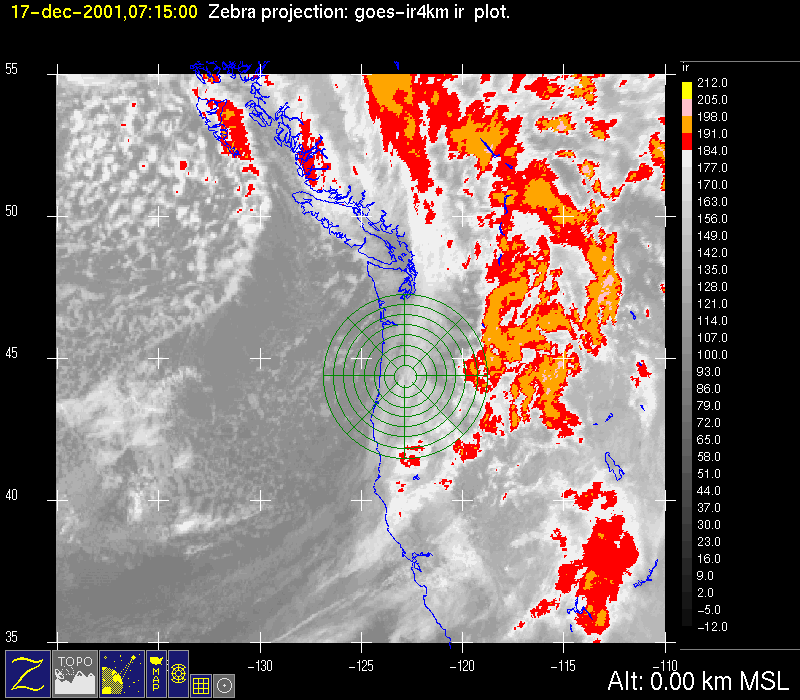
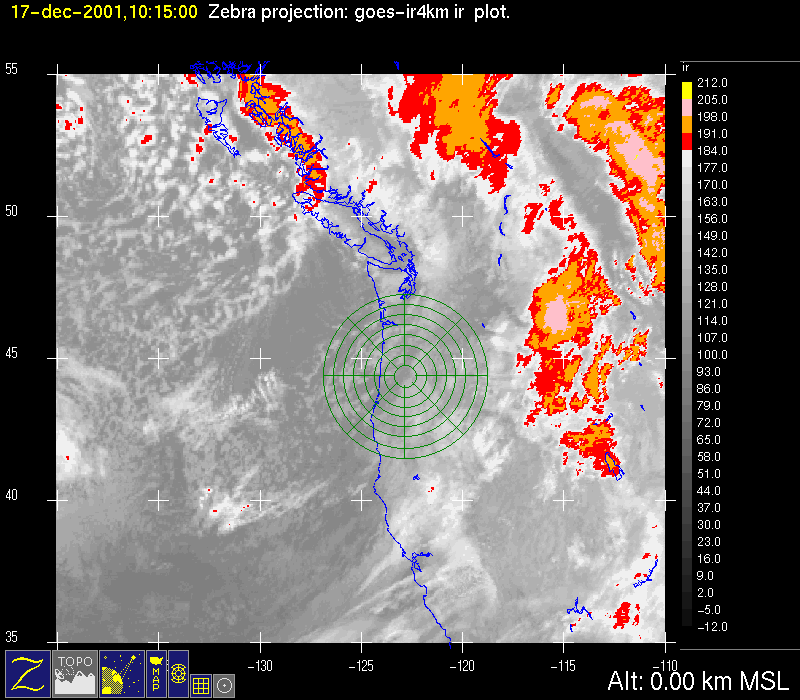
The P-3 flew a full duration mission from 2300 UTC 16 December-0900 UTC 17 December in this second wave (see further discussion and graphics below). At 0100 UTC 17 December, the cold-frontal cloud band was very well defined and intense in the infrared satellite imagery, and it was located over western Washington and Oregon (Fig. 1d, Fig. 2d). At this time, Bob Houze and Brad Smull were each driving along I-5 in southwest Washington in continuous heavy rain . Around Centralia and Chehalis, they experienced some of the heaviest rain they've seen in a Washington winter storm. Between 3 and 4 inches of rain fell at those locations. The P-3 was flying at this time (Fig. 7a). The radar echo at 1.5 deg elevation showed continuous snow over the S-Pol area with a well defined bright band. The echo maintained this structure for several hours. The P-3 was flying a dual-Doppler pattern through the snow layer. By 0400 UTC , the higher cloud tops had moved east of the mountains of central Oregon (Fig. 1e), but continuous cloud top of lesser height remained over the S-Pol radar area (Fig. 2e). The P-3 aircraft was flying a SW-NE microphysical track at this time, and the echo on S-Pol was beginning to appear more cellular in the western part of the region of radar coverage (Fig. 7b). At 0600 UTC, the S-Pol particle identification algorithms indicated a cellular echo with graupel just above the melting level (Fig. 8). At 0700 UTC, clouds related to the second frontal wave lingered over the Cascades, with a clear zone east of the mountains separating the clouds over the mountains from the higher clouds of the frontal wave far to the east (Fig. 1f, Fig. 2f). The P-3 was flying through the clouds over the mountains at this time, with isolated small cells of a postfrontal nature appearing over the western foothills of the mountains (Fig. 7c). By 1000 UTC 17 December, the cloud regime over western Oregon was entirely postfrontal (Fig. 1g, Fig. 2g).
Convair-580 Summary
No Flight
P-3 Summary
P-3 Flight Number:
011216H, IMPROVE 07
Period of Flight:
01?? UTC 17 December-07?? UTC 17 December 2001
Main Accomplishment of Flight:
The P-3 flew a partial box pattern followed by radar legs in a NCFR (narrow cold-frontal rainband)
Instrument Problems:
-
Flight Scientist:
Nick Bond
Approximate UTC Timeline (Local time= UTC-8 hours) Activity for P-3 Flight 01:
021911 UTC (43.70715, -123.58115) 328.251°, 500.6 mb, 5162.0 m starting over; at turn for start of SW-NE transect
022435 UTC (43.95130, -122.96837) 62.599°, 500.4 mb, 5316.0 m Can see hint of front about 40-50km west. Denser precip and horizontal shear are evident.
Storm is definitely picking up. We are at ~15000ft and still seeing lots of crystals.
031924 UTC (43.98421, -122.86287) 237.677°, 580.1 mb, 4024.0 m Belly radar shows clear line of heavier precip still offshore with NNE tilt. About 75km to the west.
032536 UTC (43.95229, -123.13086) 73.074°, 591.2 mb, 3836.0 m Just went through a dry spot. Are we near cloud top here?
032930 UTC (44.08142, -122.65938) 63.323°, 590.6 mb, 3586.0 m Keep going in and out of regions of crystals, maybe some weak imbedded convection here.
034714 UTC (44.33244, -122.03671) 240.765°, 608.4 mb, 2935.0 m Having radar troubles. I think tech guy is trying to reset it.
040608 UTC (44.12375, -122.67017) 75.041°, 640.1 mb, 3180.0 m Lost front in clutter of coastal range so it must be on shore now.
041138 UTC (44.35647, -122.02489) 57.504°, 639.9 mb, 2572.0 m icing looks to be picking up. Big sticky conglomerate globs of precip are building upon the wing.
042715 UTC (44.35844, -121.99722) 240.281°, 662.1 mb, 2350.0 m light-mod chop. Must be because we are low enough (11000ft) to feel terrain effects.
044240 UTC (44.12762, -122.67867) 73.919°, 691.9 mb, 2654.0 m interesting mix of needles and conglomerates.
044710 UTC (44.29021, -122.16708) 56.875°, 691.6 mb, 2080.0 m Tail radar stopped scanning so is being reset.
044903 UTC (44.38328, -121.96968) 59.209°, 691.6 mb, 1893.0 m Getting rougher. Steady mod chop with some roller coasters. We are at 10000ft and really feeling it.
Seeing large conglomerates again.
045910 UTC (44.48248, -121.67690) 240.882°, 691.9 mb, 2128.0 m ice appears to have cleared the wing. Probably got shaken off! We are still rockin and rollin.
051037 UTC (44.22898, -122.34285) 244.039°, 749.8 mb, 1138.0 mA At 8000ft now on leg of the stack. Catching some good up and down drafts.
051853 UTC (44.01534, -122.80423) 220.703°, 806.1 mb, 1305.0 m closing in on the cold front. Intense echos to our NW so as we make the turn to the north to start the lawn mower we will go right though it.
052202 UTC (43.89362, -122.93988) 217.630°, 807.0 mb, 1532.0 m Radar glitch...reset OK.
053222 UTC (44.03786, -123.01271) .102°, 806.4 mb, 1644.0 m at 6000ft headed north into front and near cloud base (can see lights below off and on). Steady light chop with occasional mod.
053606 UTC (44.29504, -123.01321) 358.893°, 806.2 mb, 1722.0 m Here it comes...nose radar shows narrow, intense band of precip oriented SW to NE.
053805 UTC (44.43284, -123.01038) 2.134°, 805.5 mb, 1751.0 m That was cool! Why did the wind shift from 260 to 220? Also decreased in speed from 50 to 30 kt
Nick's theory is we flew through divergence above a shallow cold front
060550 UTC (44.07926, -122.57018) 180.315°, 745.6 mb, 1344.0 m Radar Glitch. Tech guy is on it...
061607 UTC (43.80743, -122.06879) 357.591°, 663.0 mb, 2036.0 m Heading north on H to C leg. Can see good orographic effects with tail rader...that just went out again...just another reset.
070235 UTC (44.39352, -122.14847) 86.741°, 748.1 mb, 1145.0 m Going through the front again. Not as well defined as before but still holding together.
071458 UTC (45.20436, -122.07608) 1.648°, 648.4 mb, 2423.0 m exiting study area
S-Pol Radar Summary
The S-Pol radar was run continuously in the same mode of operation for the length of the field project.
Summary of Mobile Upstream Sonde Launches
Launch times at: Creswell, OR, Lat: 43.9200, Lon: -123.0250, Elev: 165 m
0001 UTC 17 Dec
0259 UTC 17 Dec
0332 UTC 17 Dec
Summary of Leeside Sonde Launches
Launch times at: Black Butte Ranch, OR (a.k.a. ISS-3), Lat: 44.379, Lon: -121.679, Elev: 1027 m
0000 UTC 17 Dec
0300 UTC 17 Dec
0600 UTC 17 Dec
Summary of NWS Sonde Launches from Salem (SLE)
Launch times:
0000 UTC 17 Dec (standard)
Summary of Snow Crystal Ground Measurements
Measurement times:Every 15 minutes from
0000 UTC 17 Dec-0815 UTC 17 Dec ( at Ray Benson Sno Park)
