IOP 12: 15-16 December 2001
Time period of IOP
1800 UTC 15 Dec-0600 UTC 16 Dec
Overview of IOP
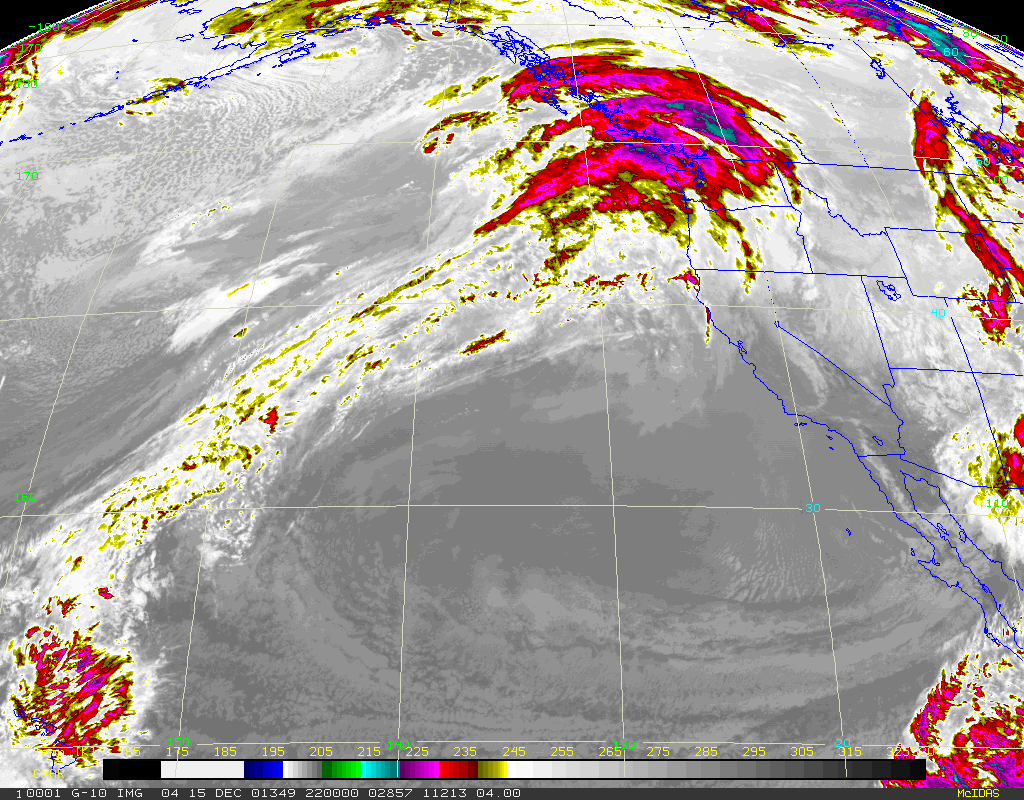
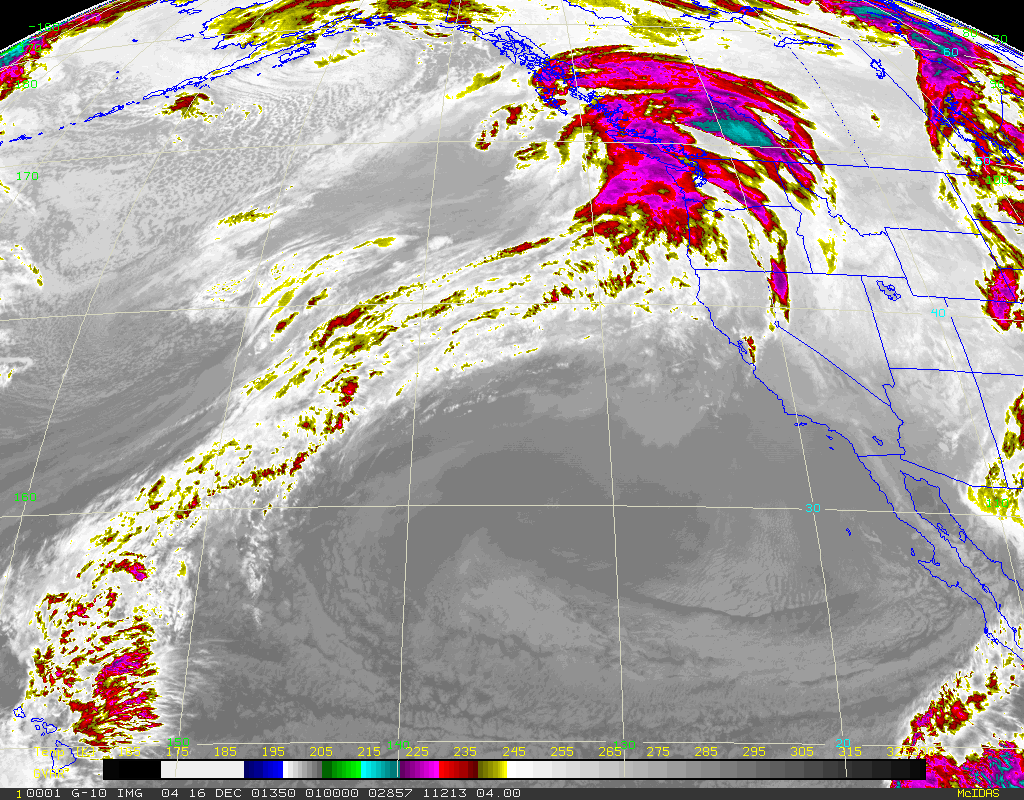
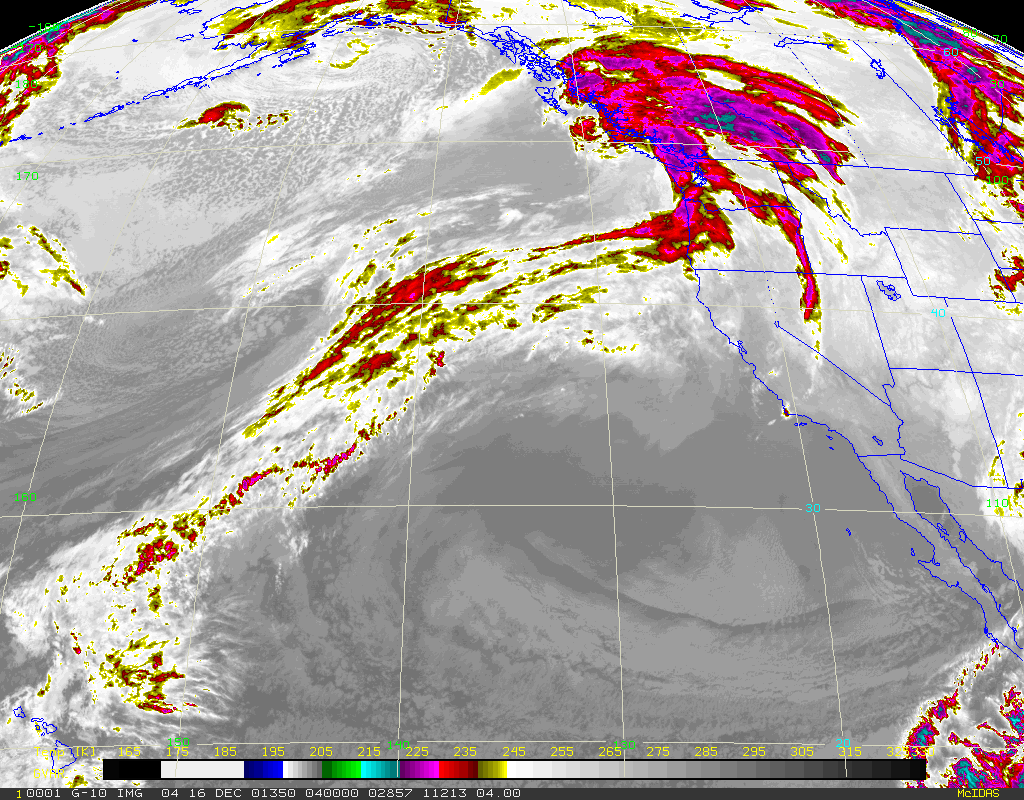
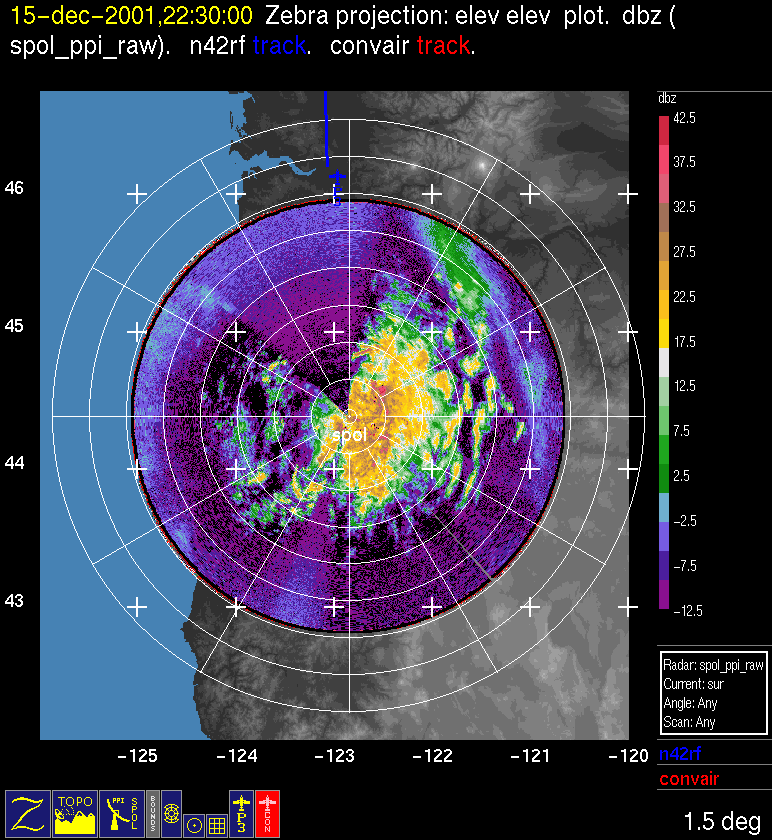
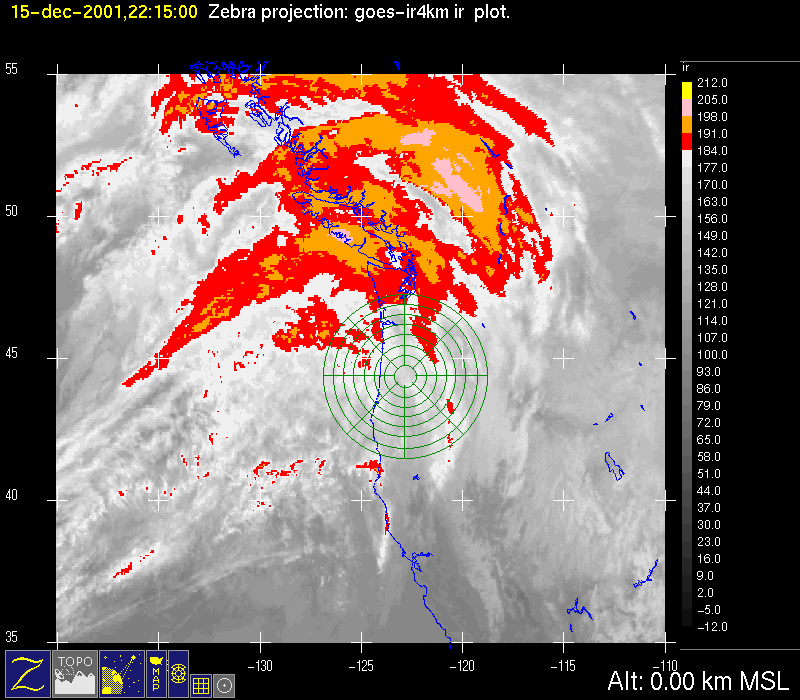
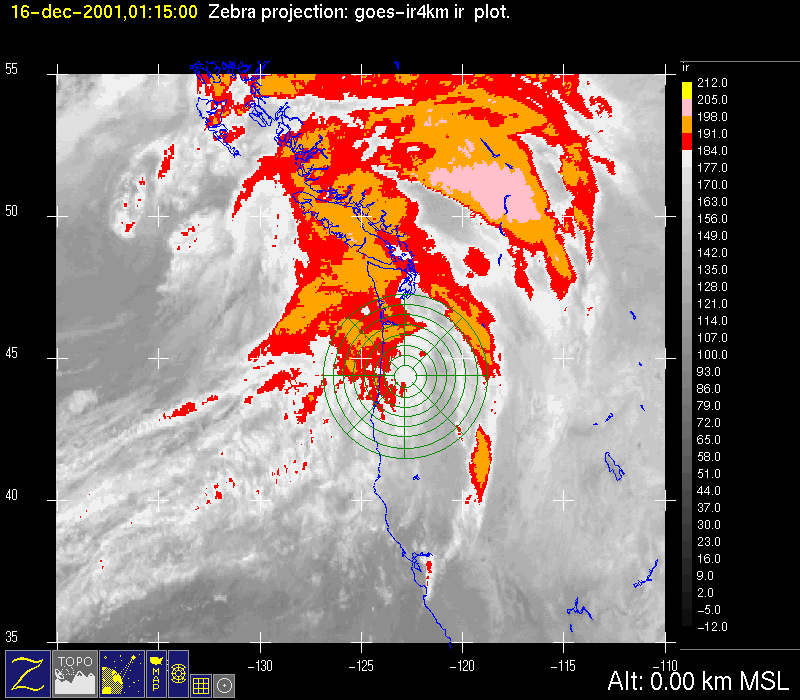
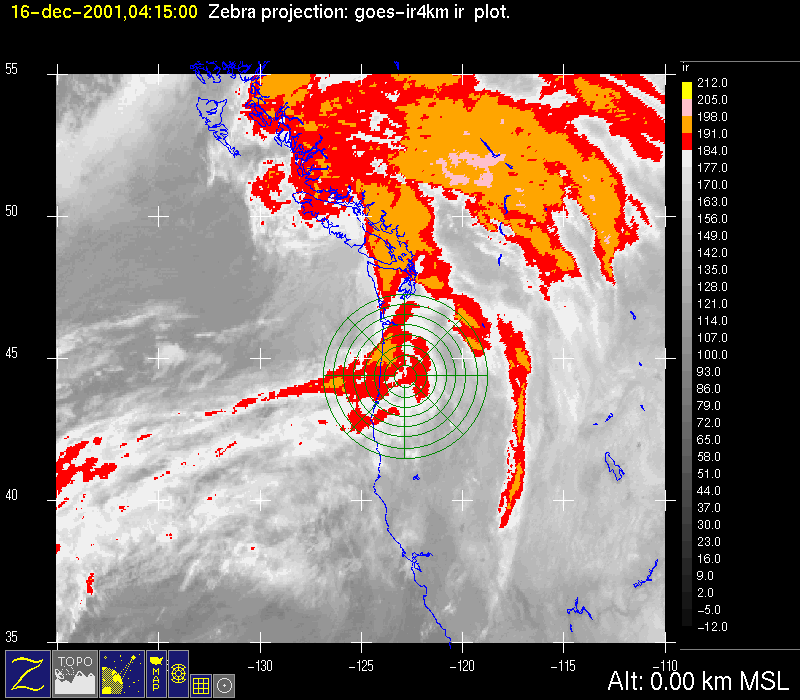
The P-3 flew from 2200 UTC 15 December-0400 UTC 16 December 2001. At 2200 UTC 15 December 2001, the infrared satellite imagery showed a frontal cloud pattern extending far to the southwest, into the tropics (Fig. 1a). A wave on the front centered at about 128 oW was just moving into the Pacific Northwest. A second wave was forming along the frontal cloud band at 150 oW. The warm-frontal sector of the first wave was moving across the S-Pol radar area (Fig. 2a). At 0100 UTC 16 December, the two waves on the frontal system were well defined and apparent at 125 oW and 145 oW (Fig. 1b). The warm-frontal clouds had moved east of the mountains. The region of most enhanced cloud cover (i.e. the leading portion of the cold-frontal cloud band), was moving across the radar area (Fig. 2b). At 0400 UTC, the cold-frontal cloud band of the first wave was over the radar area, with an apparent suppression of cloudiness east of the Cascade Range (Fig. 1c, Fig. 2c).
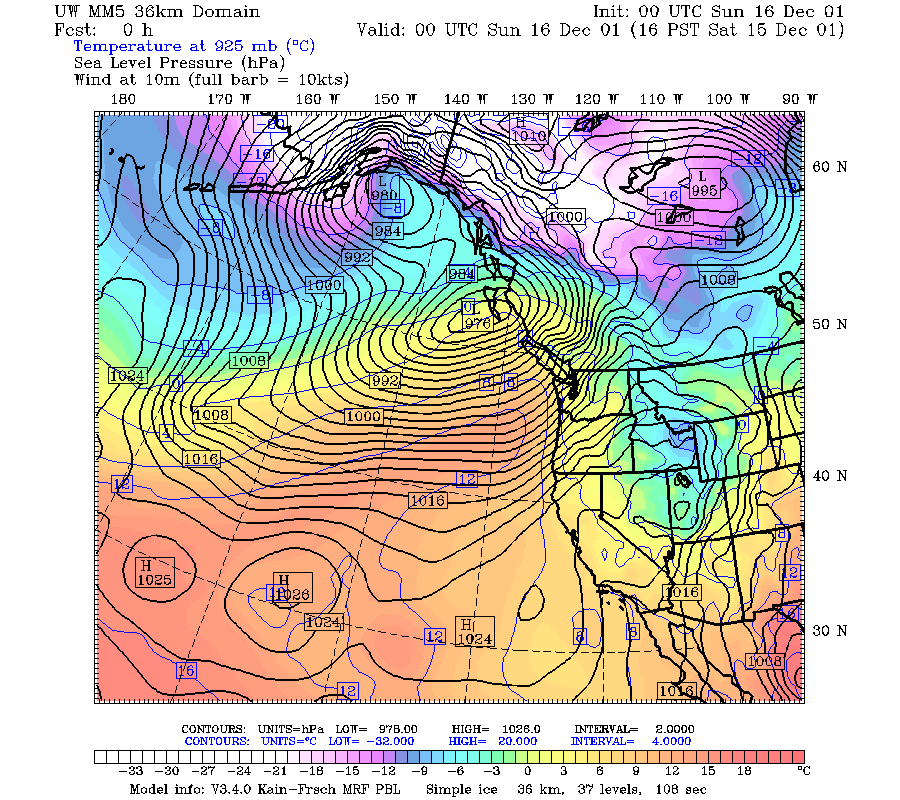
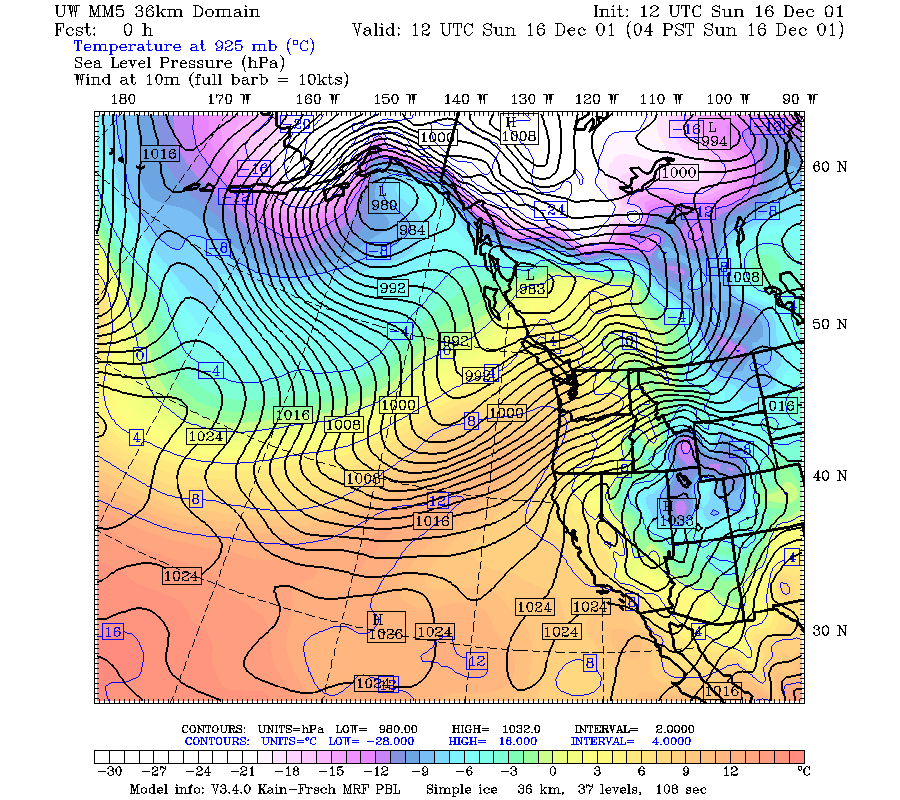
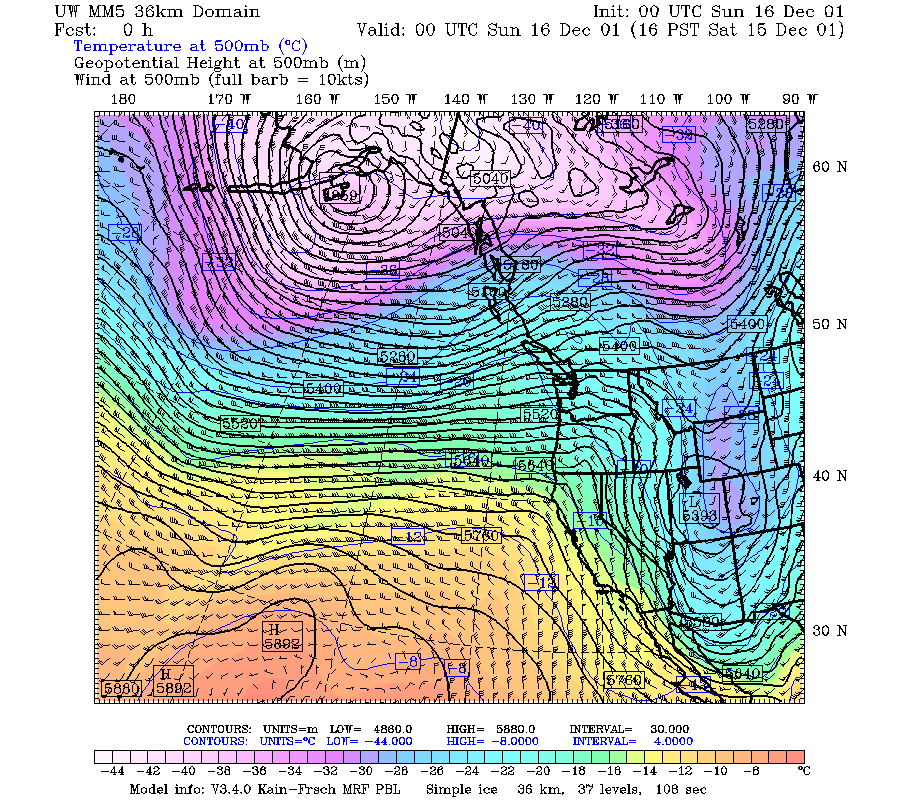
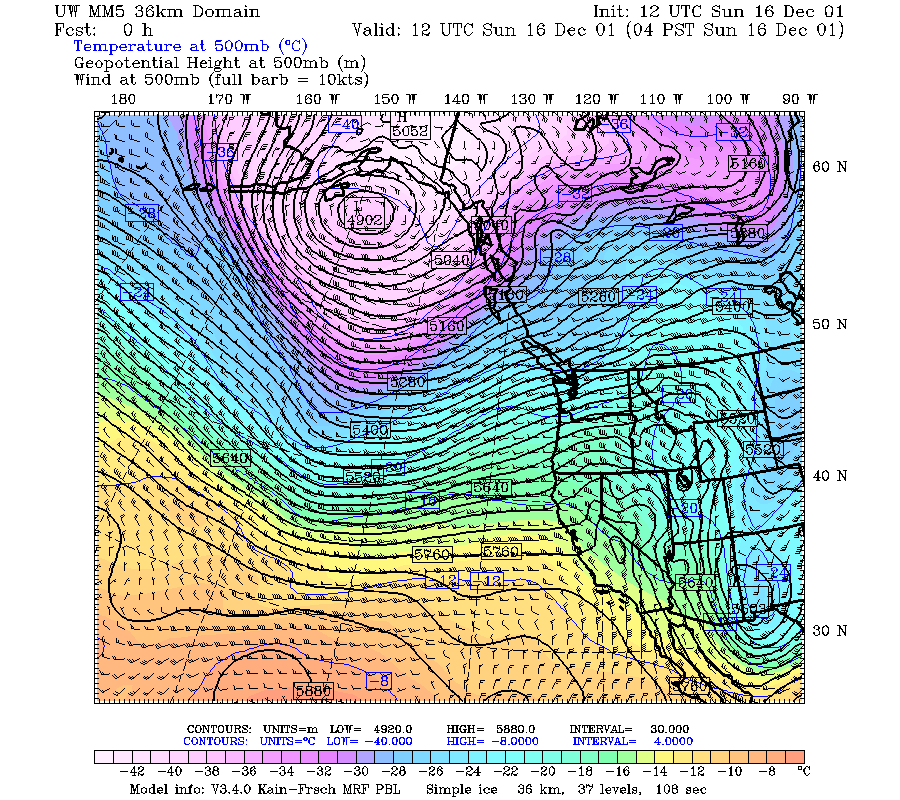
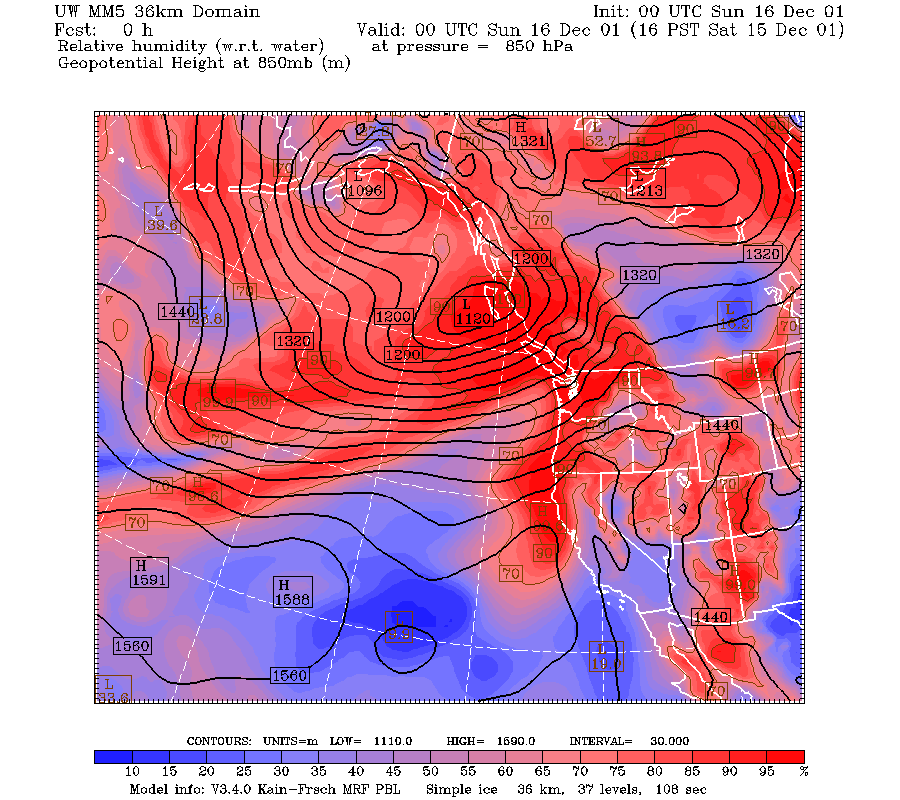
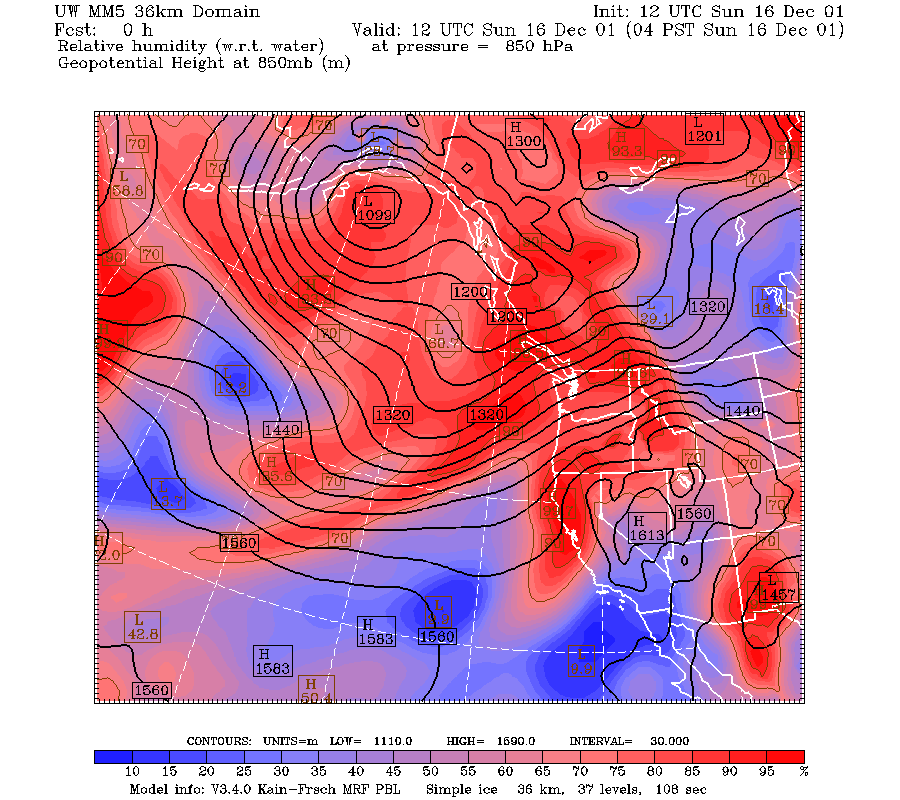
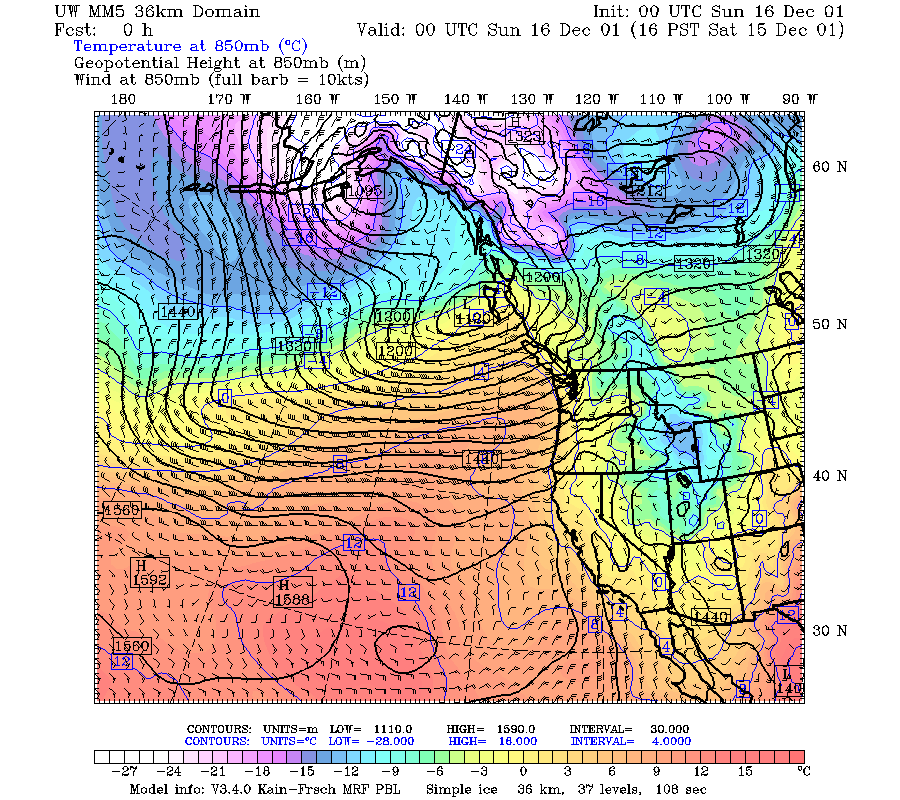
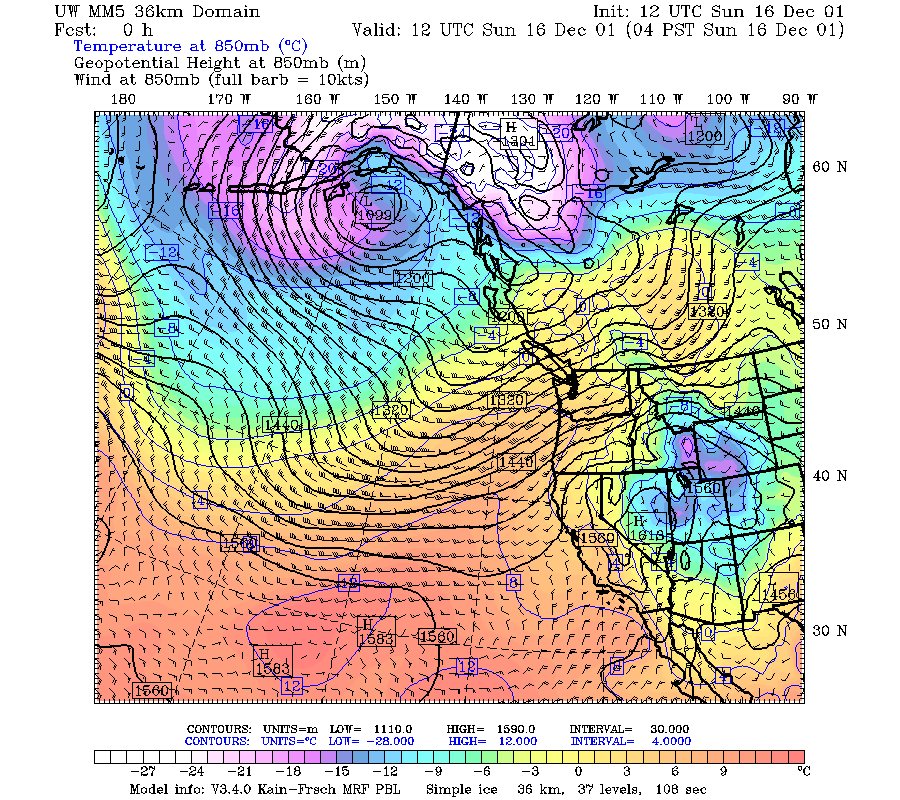
The two waves in the frontal cloud pattern were identifiable in the MM5 initial fields. At 0000 UTC 16 December, the 500 mb flow over the eastern Pacific was southwesterly, extending from a long wave trough line at 150 west all the way to the Oregon-Washington coast (Fig. 3a). The first short wave (hard to see in the 500 mb flow) was moving over the coast. The second short wave trough lay in the axis of the long wave trough at 150 west. By 1200 UTC, the first short wave had moved east of Washington and Oregon as had the long wave ridge, and the second trough had moved eastward over the ocean to about 145 west (Fig. 3b). The 850 mb map for 0000 UTC 16 December showed a frontal zone in the temperature pattern, extending from Vancouver Island southwestward to 160 west (Fig. 4a). The first wave seen in the satellite imagery was manifest as a warm front moving into Washington and Oregon. The P-3 flight described below took place in the warm frontal and warm sector region seen in this 850 mb pattern. By 1200 UTC 16 December the warm-frontal region had moved east of Oregon and Washington, and the frontal zone over the ocean had moved rapidly eastward (Fig. 4b). The 850 mb winds on these maps were strong southwesterly throughout the 0000-1200 UTC time period. The relative humidity pattern at 850 mb showed that this frontal system was drawing on humidity from well south of 20 north latitude (Fig. 5a, Fig. 5b). The surface map at 0000 UTC showed the warm front moving into the Washington-Oregon region (Fig. 6a). The surface map at 1200 UTC showed that the whole frontal system had moved rapidly eastward during the 0000-1200 UTC time period (Fig. 6b).
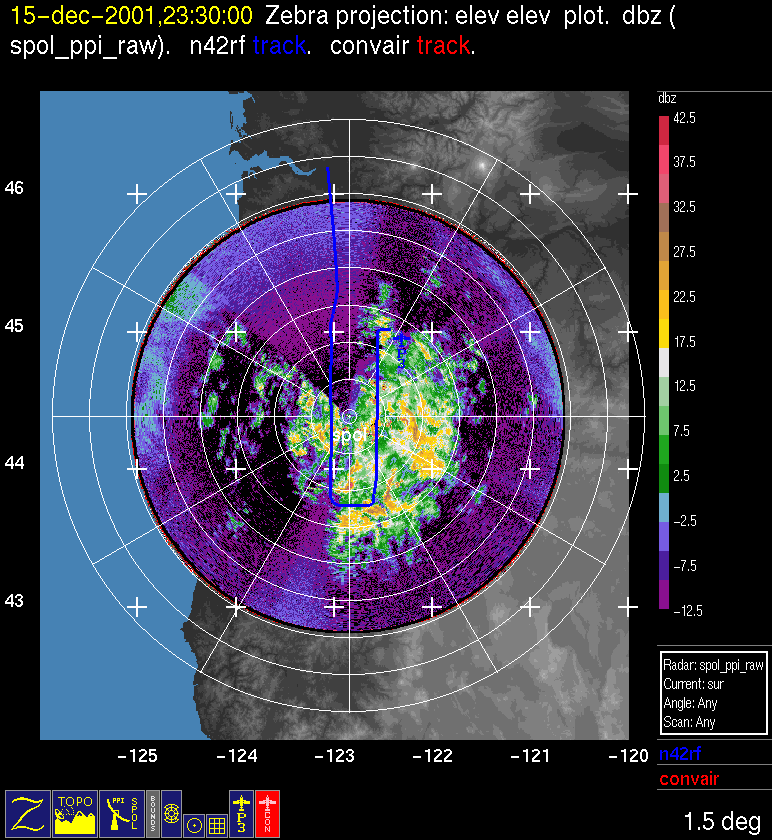
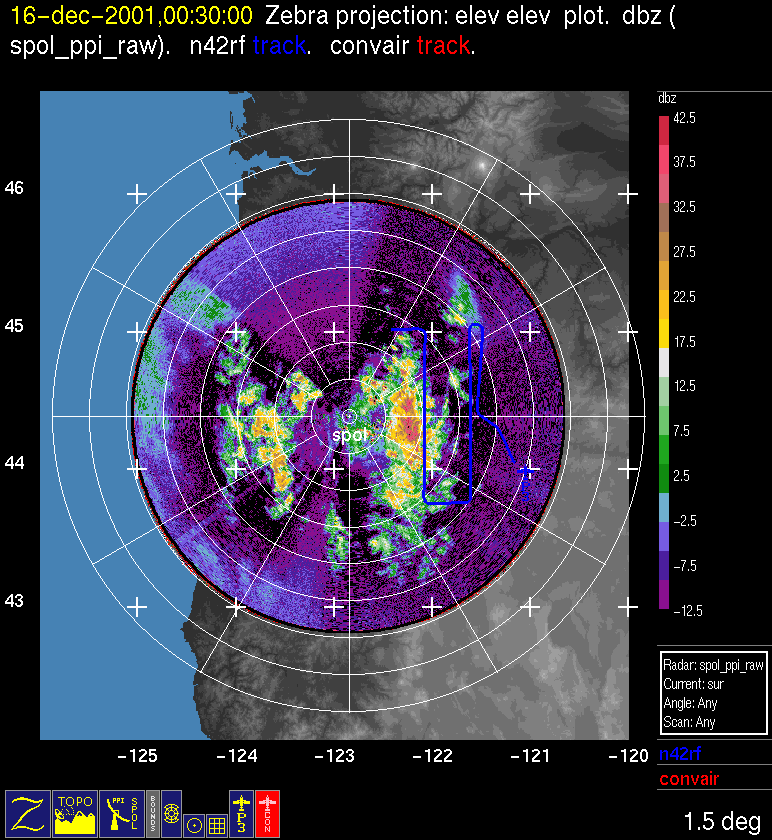
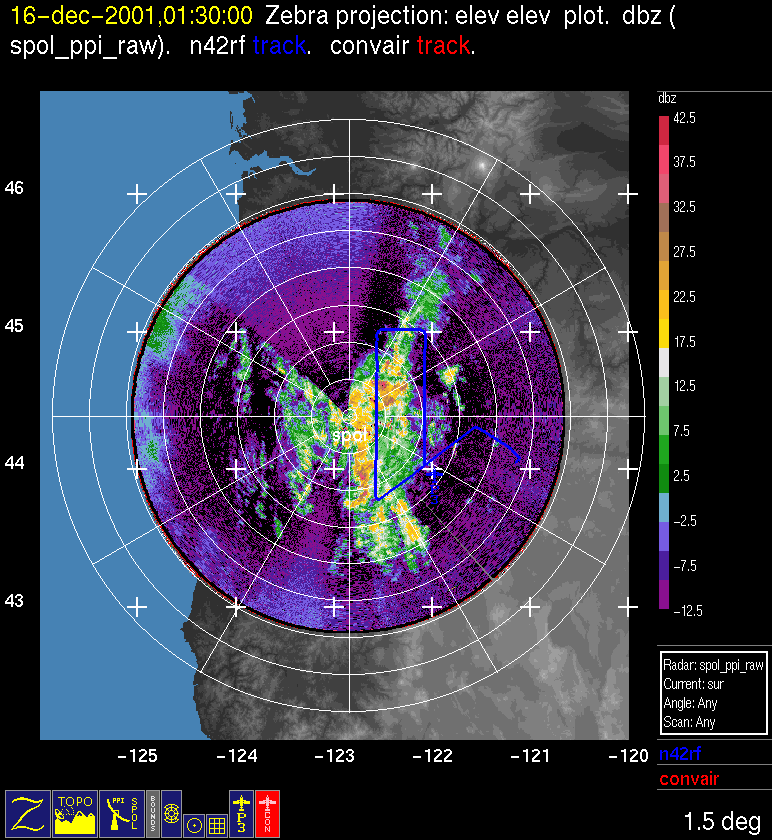
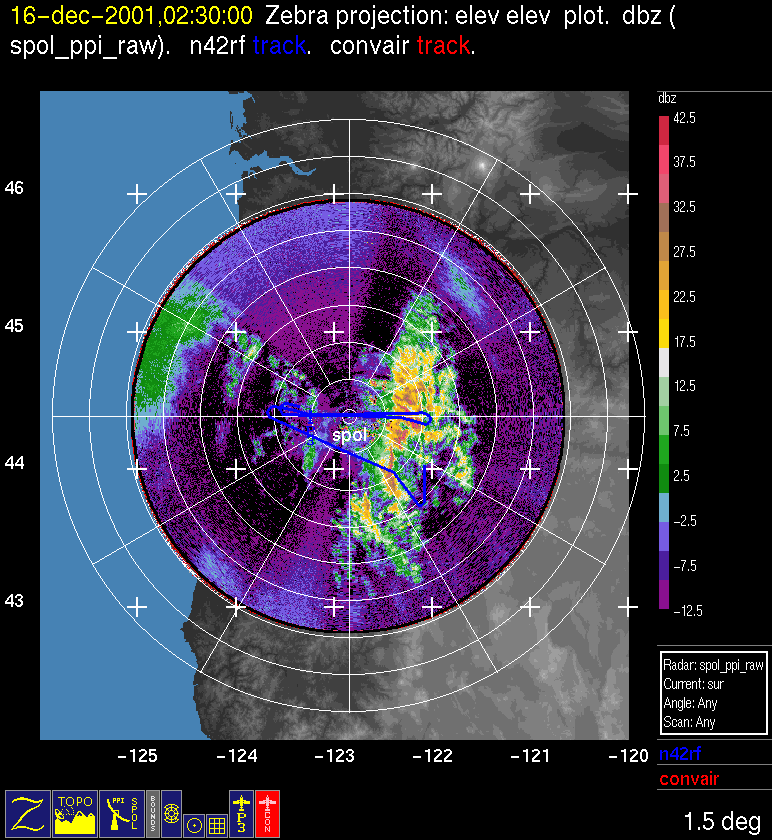
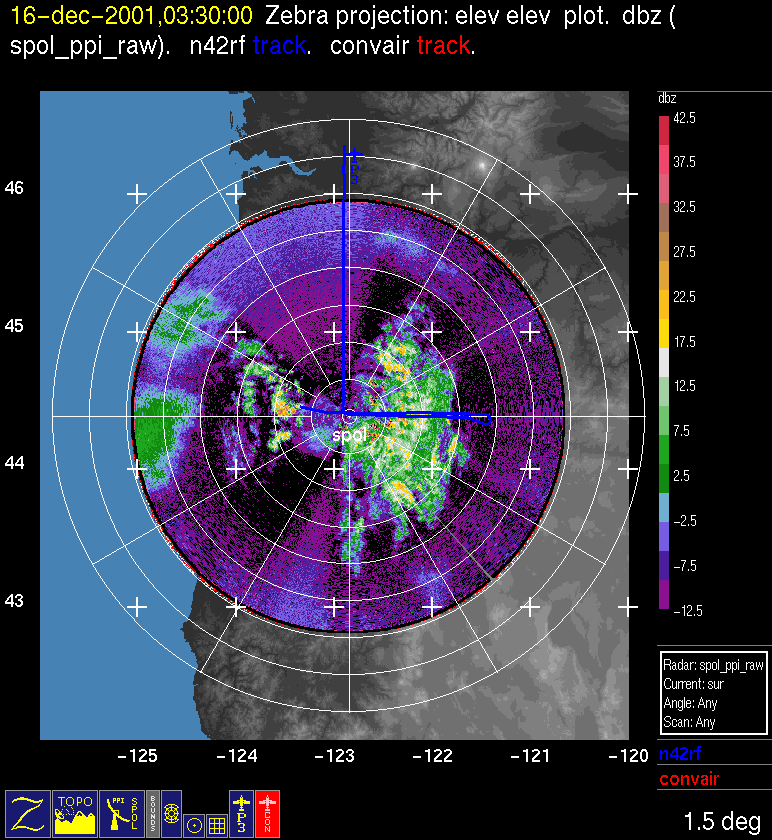
During the P-3 flight, the radar echo had a rather convective appearance, and the echo pattern was concentrated over the windward slopes just east of the S-Pol radar (Fig. 7a, Fig. 7b, Fig. 7c, Fig. 7d, Fig. 7e, Fig. 7f). The P-3 flew a short dual-Doppler pattern (north-south legs) followed by a cloud physics pattern. From the radar/flight track images, it can be seen that during the time of the flight the precipitation on the windward slopes varied in intensity. Convective bands oriented north-south appeared to move west-east into the mountains and intensify.
Convair-580 Summary
No flight
P-3 Summary
P-3 Flight Number:
011215H, IMPROVE 06
Period of Flight:
2159 UTC 15 December- ~03?? UTC 16 December 2001
Main Accomplishment of Flight:
The P-3 flew one complete box pattern.
Instrument Problems:
-
Flight Scientist:
Nick Bond
Approximate UTC Timeline (Local time= UTC-8 hours) Activity for P-3 Flight 06:
220528 UTC (47.70618, -122.59233).2 mb, 2309.0 m Heading for Pt. A after 2159 takeoff
220917 UTC (47.51405, -122.71321) 207.083°, 667.4 mb, 3156.0 m Near cloud top
221344 UTC (47.30615, -122.91550) 215.731°, 574.0 mb, 4399.0 m 2D probes turned on; in clear air
223953 UTC (45.42513, -122.97736) 176.836°, 573.0 mb, 4478.0 m Begin descent to Pt. A
225359 UTC (44.50285, -123.03435) 179.094°, 812.0 mb, 1716.0 m About halfway between Pt. A and Pt. F; breaks in pcp to west; more solid cellular pcp to east; cld phys shows droplets
225908 UTC (44.17738, -123.03098) 181.462°, 811.9 mb, 1555.0 m Aft scan shows higher echoes to west of cellular variety between 20 and 40 km
230529 UTC (43.78178, -123.02838) 154.401°, 808.9 mb, 1648.0 m Pt. F; never broke out of pcp completely as was expected; heaviest pcp just to the east during later part of the A-F leg
231255 UTC (43.96243, -122.56686) .868°, 752.5 mb, 1972.0 m Beginning of G-B leg; both aft and fore scans show 20-25 dBZ cells less than 20 km to west; rest of pcp is very shallow associated with low-level drizzle
232323 UTC (44.65295, -122.56152) .496°, 752.8 mb, 1507.0 m Back into "cloud sandwich", upper lvl cld not feeding low lvl cld. Radar echo is more scattered to the east now.
232552 UTC (44.81773, -122.56006) .509°, 752.5 mb, 1831.0 m Cirrus and cirrostratus aloft now, sun breaking through.
Moderate (20-24 dBZ) echoes to east 30-40km in fore scan.
233024 UTC (45.02323, -122.37131) 88.784°, 694.5 mb, 1963.0 m Hit pt. B, now heading east and up to 11,000 ft. Quickly back into solid pcp; needles and columns; occasional supercooled droplets; T=-5.0 oC
234639 UTC (44.07178, -122.08182) 178.854°, 670.3 mb, 1720.0 m Leg C-H; heavier pcp definitely to the west, not to the east; near and slightly above cloud top most of this leg (11000 ft)
000554 UTC (44.49175, -121.61642) .336°, 618.2 mb, 2692.0 m Fairly boring I-D leg; overcast above, undercast too;
dual Doppler showing shallow, spotty echoes to the east of the crest.
More consistent echoes to west between 20-60km
Visually, cloud top is deeper to the west.
Very dry air up here...11% RH and Td as low as -30 oC!!!
001611 UTC (44.95650, -121.49205) 183.439°, 618.1 mb, 3143.0 m 41 miles to K, hit burst of pcp just SE of pt. D
Td up to -9
Rimed looking ice in cld phys
001912 UTC (44.74217, -121.51292) 184.033°, 618.1 mb, 2936.0 m Shallow cloud below, in fact, breaks in clouds visible 24 miles to K
Nice view! Snow on ground...skiing anyone?
002434 UTC (44.36786, -121.45424) 124.980°, 619.5 mb, 3061.0 m Beginning descent to 500 feet AGL at Sisters Airport...
11000: cloud top
9000: rimed columns ... T/Td: -3 oC/-4 oC
7500: freezing level; cloud base nearly coincident
003055 UTC (44.09501, -121.12379) 318.655°, 736.8 mb, 1589.0 m Climbing back up from about 6000 feet...
8000: hit cloud base again
10000: occasional needles/columns; T/Td: -3.5 oC/-3.5 oC
11500: cloud top
13500: very dry air aloft; T/Td: -9.0 oC/-25.0 oC
14500: T/Td: -11.0 oC/-37.0 oC
004037 UTC (44.21339, -121.74120) 232.934°, 615.2 mb, 2372.0 m Headed SW to G, 13000 feet
Suddenly hit saturation; T/Td: -9.7/-10.0
Dual Doppler showing moderate echoes 5-20 km to NW
004557 UTC (44.01340, -122.10869) 232.812°, 695.4 mb, 1604.0 m 25 miles to G...overcast thickening, slight turbulence
Descended to 10000 feet
Supercooled water here; T/Td: -3.0 oC/-3.0 oC
8000 feet: freezing level...drizzle drops
005214 UTC (43.79205, -122.52101) 232.995°, 750.2 mb, 1829.0 m At G, turning to head north
Alt: 8070; T/Td: 0.6 oC /0.6 oC
Dual Doppler paints embedded convection with pretty high echo tops 20-40km to the west.
005605 UTC (44.00900, -122.57747) 1.434°, 750.5 mb, 1762.0 m Echoes creeping closer as we move north, fore scan shows a 24-28 dBZ cell about 25 km to the west.
56 miles to B
010253 UTC (44.47274, -122.56552) 359.646°, 750.6 mb, 1631.0 m Dual Doppler showing significant echo in this region and extending to the east about 30 km. Echoes around 28 dBZ.
Flight level is just below the melting level (8070 feet).
010659 UTC (44.75183, -122.56433) 359.728°, 750.5 mb, 2141.0 m Nearing B (15 miles to it)...
Temperature slightly lower, now below fzg; T/Td: -0.3 oC/-0.3 oC
Dual Doppler showing moderate convection 20 km to the east in both aft and fore scans.
011416 UTC (45.02063, -122.18108) 90.436°, 670.2 mb, 2093.0 m Nearing C (3 miles)...
supercooled water at 11000 feet; T/Td: -5.0 oC/-5.4 oC
some turbulence as we head south of C
mixture of crystals and supercooled droplets
011646 UTC (44.90257, -122.07399) 182.668°, 668.1 mb, 1886.0 m Heavier pcp showing up 5-10 km to the west.
Drying out a little bit at flight level; T/Td: -6.0 oC/-11.6 oC
012412 UTC (44.40771, -122.08272) 179.910°, 668.1 mb, 2108.0 m Heavier pcp now over 10km to west.
Main pcp appears to be 15-30 km to west.
Not really in cloud at this time, but picking up crystals nonetheless.
Crystals probably being carried by slightly stronger west wind aloft after being carried out of the top of the embedded convection to the west.
Hit pt. H; now heading NW to a point west of S-POL to begin west-east stack
014129 UTC (44.02298, -122.52454) 292.409°, 554.0 mb, 3927.0 m UTC=16000 feet
Still dry up here; T/Td: -14.5 oC/-35.7 oC; RH: 14%
021654 UTC (44.38802, -122.59798) 272.390°, 569.4 mb, 4244.0 m Finished east leg at UTC=16000 feet; now headed west at UTC=15000 feet (about 4.5 km)
clear air
022628 UTC (44.40033, -123.43687) 272.012°, 595.2 mb, 3993.0 m UTC=14000; nearing west point of west-east stack
clear air
023804 UTC (44.41163, -122.35083) 88.715°, 595.9 mb, 3329.0 m finally starting to see some meaningful echoes again
most of the action appears to be to the north
22 miles to Santiam Pass
grazing cloud top from time to time
not a smooth of a ride anymore
024912 UTC (44.37727, -121.61859) 293.549°, 644.9 mb, 2532.0 m Hit eastern point (O), pcp is dying out...
heading west again and descending to 10000 feet
last leg
025153 UTC (44.38393, -121.83156) 271.601°, 672.6 mb, 1906.0 m Seeing a mixture of supercooled droplets and columns on this leg
T/Td: -5.0 oC/-5.5 oC
Z=10300
025512 UTC (44.38754, -122.07114) 268.706°, 701.9 mb, 1299.0 m weak echo here...seeing some ice crystals now
T/Td: -3.0 oC /-3.0 oC
UTC=9500 feet
S-Pol Radar Summary
The S-Pol radar was run continuously in the same mode of operation for the entire length of the field project.
Summary of Mobile Upstream Sonde Launches
Launch times at: Creswell, OR, Lat: 43.9200, Lon: -123.0250, Elev: 165 m
0020 UTC 16 Dec
0339 UTC 16 Dec
Summary of Leeside Sonde Launches
Launch times at: Black Butte Ranch, OR (a.k.a. ISS-3), Lat: 44.379, Lon: -121.679, Elev: 1027 m
0000 UTC 16 Dec
0300 UTC 16 Dec
Summary of NWS Sonde Launches from Salem (SLE)
Launch times:
1800 UTC 15 Dec (special)
2100 UTC 15 Dec (special)
0000 UTC 16 Dec (standard)
0300 UTC 16 Dec (special)
0600 UTC 16 Dec (special)
Summary of Snow Crystal Ground Measurements
Measurement times:Every 15 minutes from
2230 UTC 15 Dec-0200 UTC 16 Dec ( at Santiam Pass and Corbett Sno Park)
