Search
Logistics
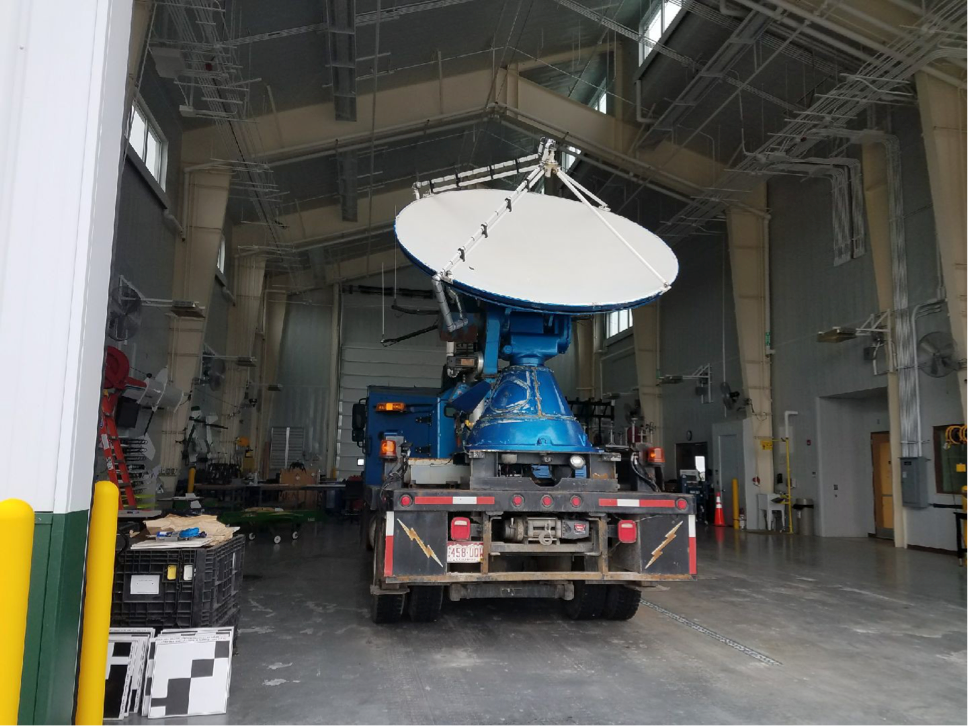
During this educational deployment, EAPS took advantage of its close relationship with the Purdue Agronomy department to obtain facilities and deployment sites for the DOW. When not in use, the DOW was housed in the phenomics tool development high bay of the Indiana Corn and Soybean Innovation Center (ICSC), a Purdue-owned agronomical research facility. This large indoor space was not in heavy demand during February and March, because this time period fell outside the region’s growing season. Use of the high bay allowed CSWR staff to work on the DOW in a comfortable indoor environment during the cold Indiana weather (Fig. 2).
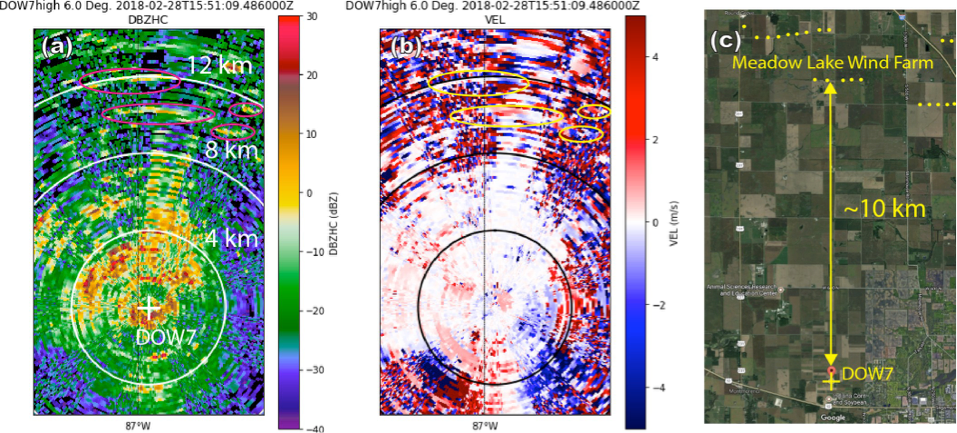
The ICSC is part of the Agronomy Center for Research and Education (ACRE), a Purdue field research station located about 4 miles from Purdue’s main campus. The ACRE site proved a convenient test deployment site for the DOW, as it is located on 1,400+ acres (5.7 km2) of relatively flat terrain. Nearby clutter targets like high-tension power lines and wind turbines provided opportunities to demonstrate concepts like ground clutter mapping and atmospheric refraction (Fig. 3). Unless otherwise noted, all atmospheric observations by the DOW during this educational deployment were conducted from ACRE. Training deployments occurred at ACRE from 26 February through 6 March. During these training sessions, CSWR staff members instructed the PI, the four Radar Meteorology students, and one undergraduate independent study student on the operation of the DOW. In some instances, Intensive Observing Periods (IOPs) for the class experiments doubled as training deployments for the students.
University Activities
EAPS 52300: Radar Meteorology
PurRad was timed to coincide with Indiana’s winter-to-spring transition. A wide variety of weather, ranging from snow to tornadic storms, have historically been observed during this period. After reading and discussing Kumjian et al. (2013), four graduate students enrolled in Radar Meteorology identified three atmospheric phenomena to target for detailed case studies: (1) the polarimetric refreezing signature; (2) the melting layer signature; and (3) differential reflectivity (ZDR) columns in convective storms. The phenomena were selected to align with both the expected range of weather conditions and the individual students’ interests. By focusing on three distinct atmospheric phenomena instead of one, the class proactively hedged against the failure to collect observations of one or more of the phenomena. As it turned out, owing to a lack of strongly convective storms in Indiana, no suitable observations of ZDR columns were collected. Accordingly, the students’ DOw-based projects were focused primarily on identification of melting layers and refreezing signatures.
During the experiment design, it was noted that studies of all three of these phenomena would benefit from local observations of the 0 °C height. As Purdue University is located 230 km from the nearest operational National Weather Service upper-air sounding site (Springfield, Illinois; KILX), the students requested the use of a mobile sounding system to collect local atmospheric soundings during deployments. Prof. Michael Baldwin (EAPS) instructed the students on how to launch radiosondes. Owing to an equipment failure, sonde flights were only successful in one case.
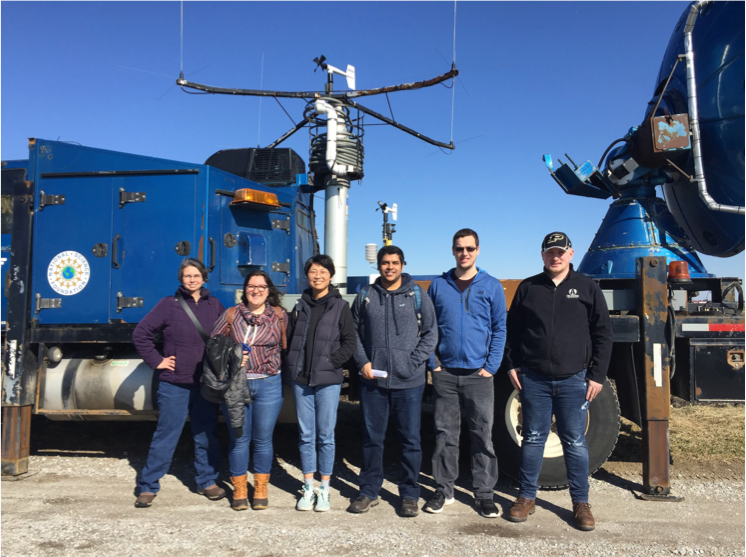
The six EAPS 52300 participants (Fig. 4) and the CSWR staff members (A. Gilliland and M. Hanshaw, Fig. 5) developed a set of scanning strategies for each type of mission that involved surveillance scans (PPIs) from 4° to 20° for melting layer observations, 0.5° to 4° for refreezing signatures, and vertical scans (RHIs) for ZDR columns. Fortunately, the DOW scan scheduling software was versatile enough to handle combinations of the above with just a few mouse clicks.
The group monitored forecast model updates and designated Intensive Observing Periods (IOPs), during which the DOW was deployed with at least one student assisting in operation, logging, and curation of the data. Throughout the deployment, the PI, students, and CSWR staff communicated using the social media site GroupMe. Each day, the PI initiated a daily forecast discussion, soliciting input from the other participants. If an IOP was deemed necessary, the chat was used to coordinate deployment, crewing, and scanning strategies. A total of four IOPs were conducted (Table 1), along with a “0th” IOP (ground clutter survey) that occurred early in the deployment.
Following each IOP, A. Gilliland curated and converted all of the DOW data into DORADE format, collected all of the associated logs, mesonet data, and inclinometer data, and transmitted them to the PI. The PI then further converted the DOW data into Cf/Radial format, added sounding data to the archive when it was available, and posted it on Purdue servers for access by the students. Students analyzed these data using both Solo II (NCAR 2016) and Py-ART (Helmus and Collis 2016) software. As there were four registered students and four IOPs, one IOP was assigned to each students as a case study. Each student was tasked with producing quasi-vertical profiles (QVPs; Ryzhkov et al. 2016) and applying a hydrometeor classification algorithm to the raw DOW observations.
| IOP | Date/Time | Mission | Conditions/comments |
| 0 | 28 February 2018, 1500 - 1600 UTC | Training, clutter survey | Distant light rain, otherwise quiescent conditions. |
| 1 | 1 March 2018, 1300 - 1800 UTC | Melting layer | Cold FROPA. Sonde data collected (3). |
| 2 | 5 March 2018, 2200 UTC - 0230 UTC | Refreezing signature | Warm FROPA. |
| 3 | 6 March 2018, 1900 - 2200 UTC | Refreezing signature | Graupel and snow. |
| 5 | 17 March 2018, 0200 - 0900 UTC | Melting layer and refreezing signature | Warm FROPA and freezing rain. |
DOW demonstration deployments on Purdue campus
The DOW was displayed on Purdue campus on 5, 6, and 7 March 2018. The DOW was parked in a high foot-traffic area near Purdue’s iconic Engineering Mall (Figs. 1, 20), and attracted a great deal of attention from passersby.
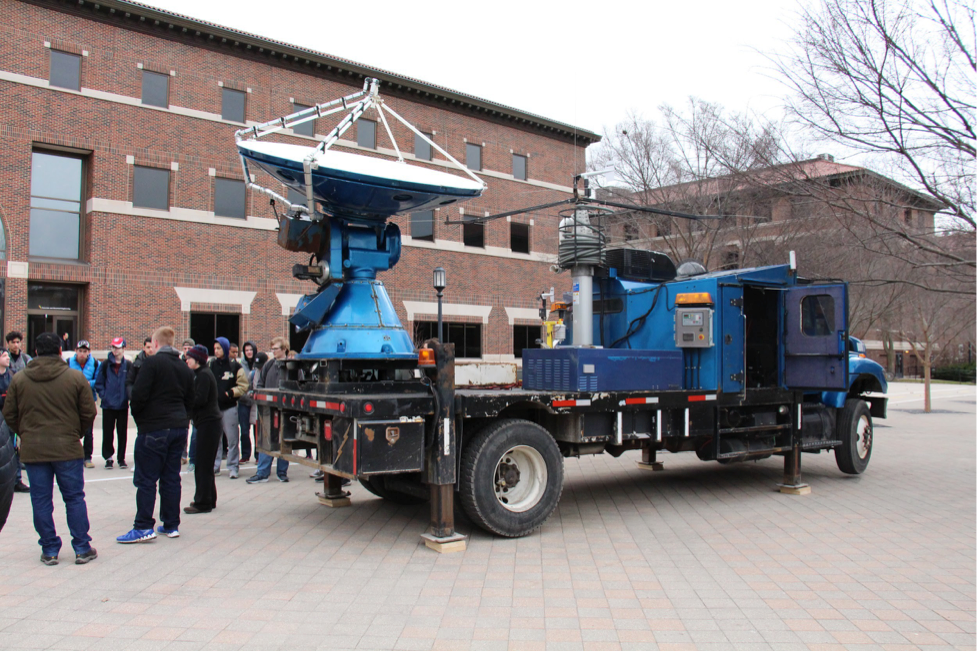
EAPS classes were invited to tour the DOW and ask questions of the CSWR staff and class participants. Classes that visited included EAPS 13800: Thunderstorms and Tornadoes (96 students, Fig. 1, 23), EAPS 43100: Synoptic Laboratory I (50 students), EAPS 434: Weather Analysis and Forecasting (12 students), and EAPS 53200: Atmospheric Physics I (12 students). Numerous passersby also introduced themselves to the participants and asked questions. In total, approximately 80 visitors toured DOW during the three on-campus deployments. At least one-third were female, and five were from underrepresented minority groups.
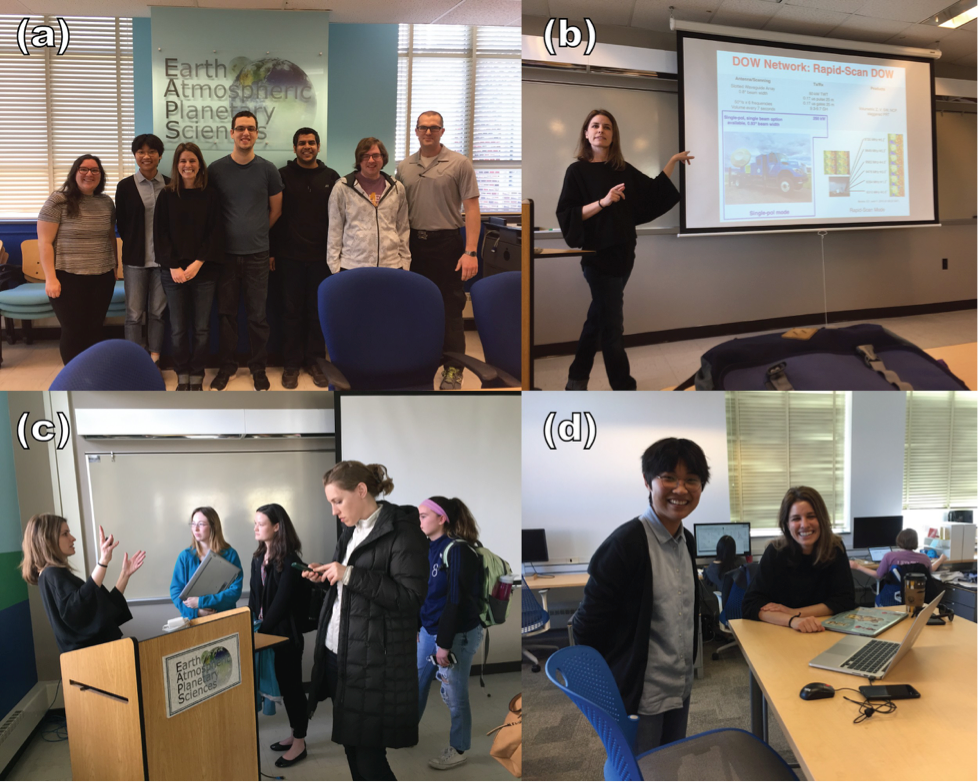
Visit by Dr. Karen Kosiba
Dr. Karen Kosiba, an atmospheric scientist at CSWR and an alumna of Purdue University EAPS (Ph.D. 2009) visited the department on 26 and 27 February 2018. Dr. Kosiba is a well-known high level member of CSWR staff, with national recognition from her role on the Discovery Channel “Storm Chasers” television show. The visit was designed to allow Dr. Kosiba to reconnect with her former mentors and peers, and to inspire a new generation of students as a role model for women in STEM. During Dr. Kosiba’s visit, for which the PI served as host, she had an informal lunch with six graduate students (Fig. 24a), and delivered a seminar entitled “DOW discoveries: What we are learning about tornadoes, hurricanes and other high impact mesoscale phenomena” to a mixed audience of about 25 faculty, graduate students, and undergraduate students (Fig. 21b). One class (EAPS 53200: Atmospheric Physics I) was specifically excused from lecture to attend Dr. Kosiba’s seminar. Afterward, several female students approached and spoke to Dr. Kosiba individually (Fig. 24c). Dr. Kosiba also had individual meetings with several Purdue EAPS faculty and graduate students during her visit (e.g., Fig. 24d).
IOP 0
28 February 2018
Ahead of an approaching trough, two light rain events affected Tippecanoe County, Indiana (in which Purdue is located). A thin cloud deck with virga was exiting the county to the southeast. Since no observations pertinent to the three working hypotheses were anticipated, IOP 0 was treated primarily a training deployment designed to familiarize the students with the DOW theory of operation.
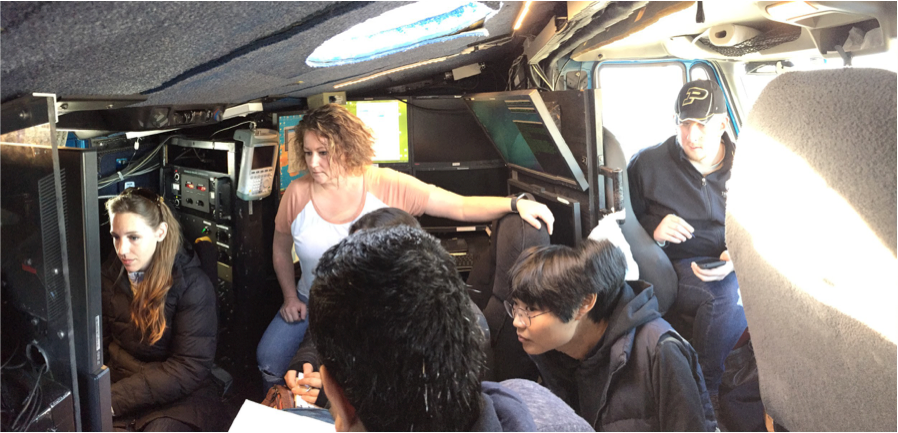
The CSWR staff walked the students through the startup-to-shutdown procedure for DOW7 (Fig. 5), tasking students with choosing scanning strategies, logging the deployment, and performing a sun scan for subsequent azimuth correction. Light precipitation (virga) was detected at high elevations (not shown), and students observed echoes from ground clutter targets, such as buildings, transmission towers, and wind turbines (Fig. 3) close to the radar.
IOP 1
1 March 2018
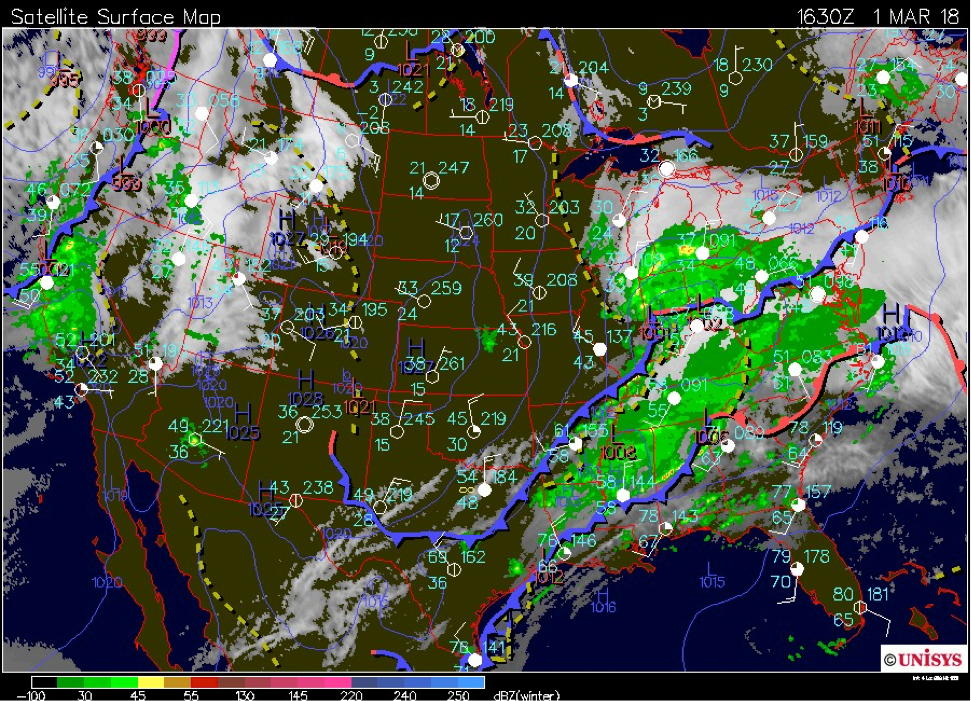
An approaching surface low pressure center passed over west central Indiana on 1 March 2018 (Fig. 6), bringing widespread precipitation and gusty surface winds to the ACRE site. Most of the precipitation was forecast to occur in the warm sector of the low, with little to no trailing precipitation behind the cold front. Accordingly, a melting layer IOP was declared. DOW7 deployed at the ACRE site from 1300 to 1800 UTC, recording increased backing winds, indicating cold air advection in association with the frontal passage (FROPA; Fig 7). The IOP ended when the precipitation shield exited the range of the DOW at 1800 UTC.
While the DOW was deployed, other EAPS 52300 students launched three iMet radiosondes from Purdue campus, recording the boundary layer cooling during the cold frontal passage (Fig. 6). Interestingly, the top of the boundary layer appeared to warm back up slightly following the surface frontal passage, even as the surface temperatures cooled. As a result, the 0 °C level dipped from 2489 m MSL at 1403 UTC to 2074 m MSL at 1616 UTC, then rebounded to 2229 m MSL at 1742 UTC.
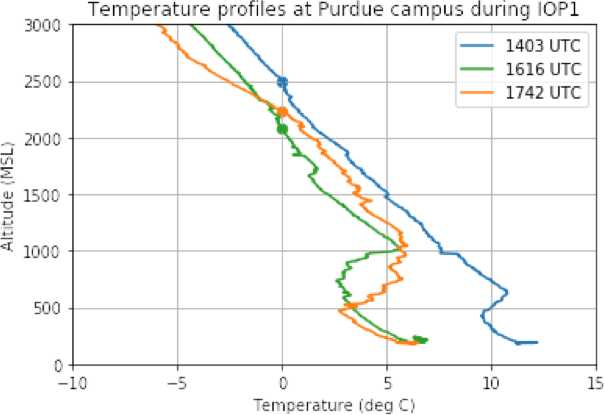
Fig. 8: Temperature profiles at Purdue campus, measured by radiosondes launched during IOP1. The height of the 0 °C level in each profile is marked by a large dot.
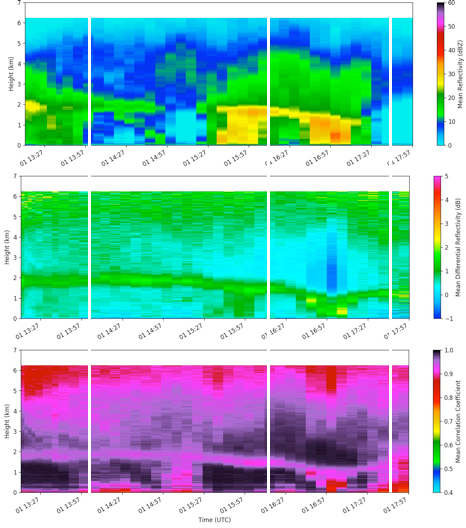
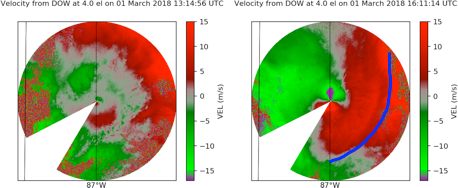
EAPS 52300 student P. Saunders performed QVP analyses of the DOW data for this IOP (Fig. 7). This analysis showed clearly that the melting layer descended toward the surface during the cold FROPA, before rebounding slightly just prior to the end of the IOP. This behavior matches what would be expected based upon the sounding temperature profiles (Fig. 6). An interval of enhanced differential attenuation above the melting layer was also noted at 1704 UTC (Fig. 7b), associated attenuation to the northeast of an area of relatively heavy, possibly convective precipitation northeast of the DOW (Fig. 8a). An RHI scan through this cell (not shown) showed a relatively shallow, weak ZDR column.
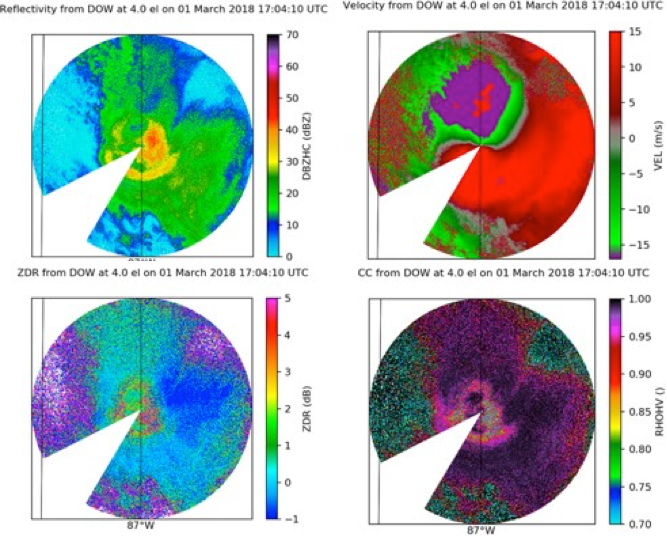
Fig. 10 (clockwise from top left) PPI displays of DOW7 reflectivity (in dBZ), Doppler velocity (in m s-1), correlation coefficient (unitless), and ZDR (in dB) at an elevation angle of 4.0° at 1704 UTC.
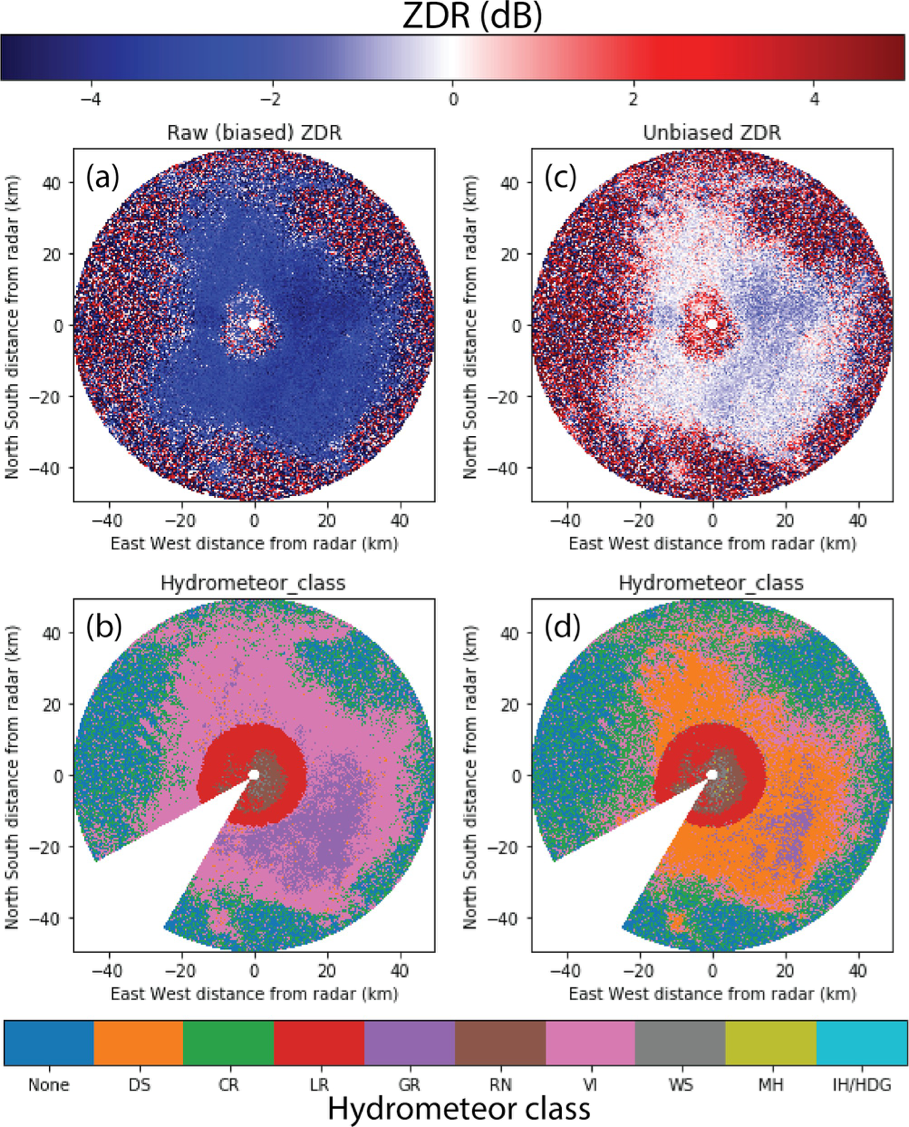
The DOW7 polarimetric observations, including ZDR (e.g., Fig. 11a) and the temperature profile from the 1742 UTC radiosonde (Fig. 8) were ingested into the semi-supervised hydrometeor classification algorithm (SSHCA; Besic et al. 2016) contained in Py-ART. The ratio of gates classified as vertically aligned ice (VI) to dry snow (DS) seemed unrealistically high for the warm sector of an extratropical cyclone (Fig. 11b). Through azimuthal averaging of the near-vertically pointing “birdbath” scans (Gorgucci et al. 1999) collected with each volume (not shown), it was found that ZDR values recorded by the DOW’s “high” channel (9.5 GHz) were biased approximately 2.75 dB too low. ZDR values less than zero above the melting layer are commonly associated with vertically aligned ice. Applying a ZDR bias correction factor (Fig. 11c) resulted in a much more realistic ratio of vertically aligned ice to dry snow classified gates (Fig. 11d).
IOP 2
5 March 2018
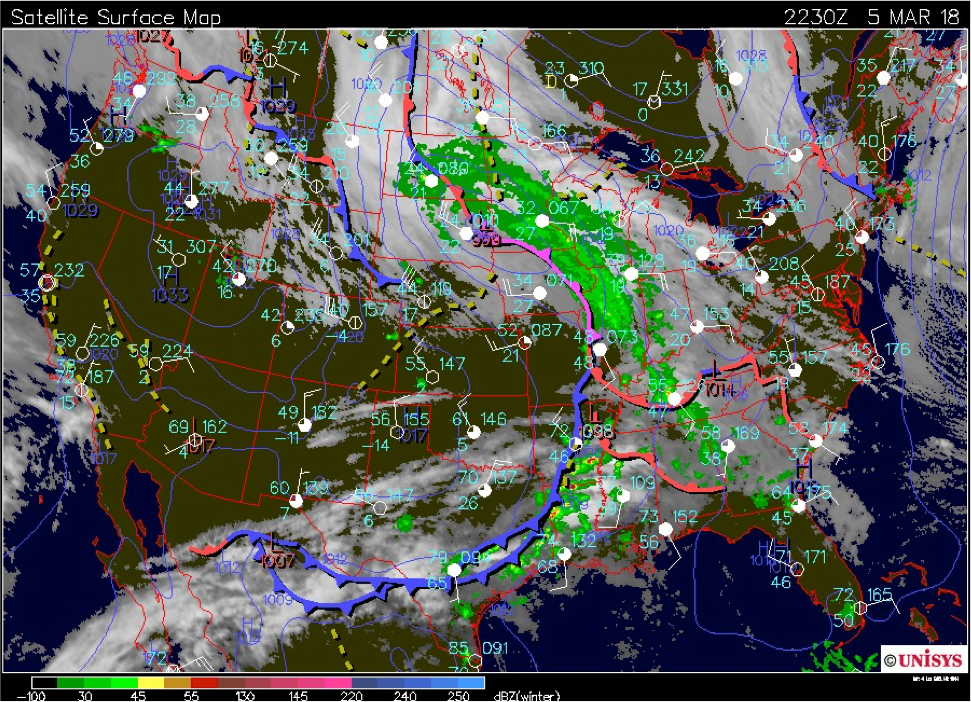
A cycloidally tracking low pivoted over Minnesota as it began to occlude (Fig. 12). The occluded front, trailing southeast from the surface pressure minimum, pushed northeastward through Indiana during the evening. The NAM and GFS forecast soundings for Lafayette, Indiana (not shown) both indicated the potential for mixed winter precipitation. A refreezing signature IOP was planned for that evening beginning at 2300 UTC.
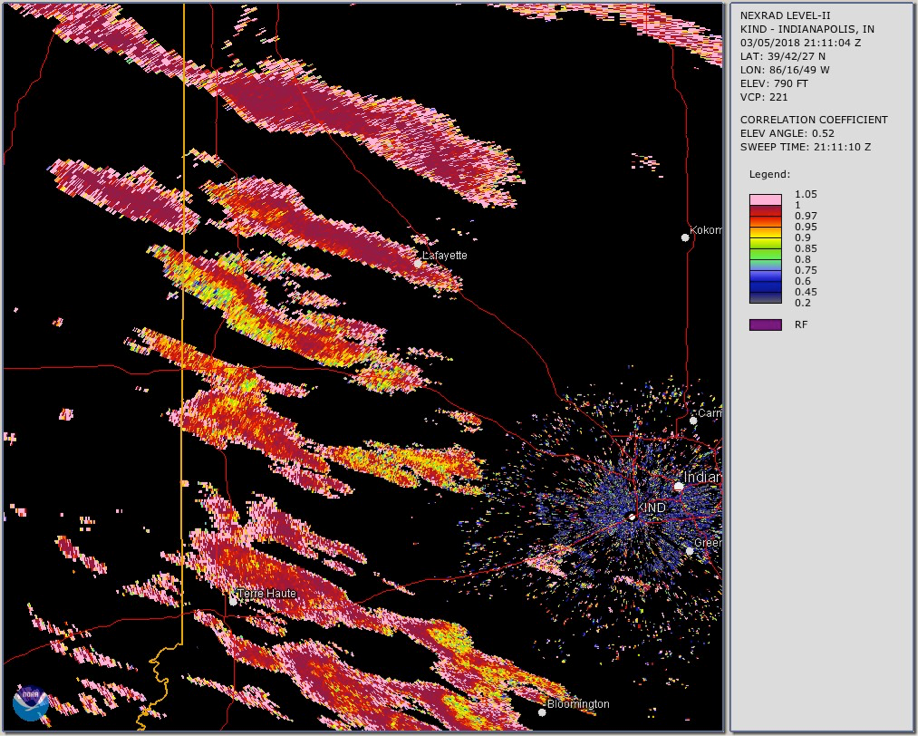
As the precipitation bands along the occluded front approached Lafayette during the afternoon, some were observed to contain widely varying values of correlation coefficient (Fig. 13). The IOP start time was moved back to 2200 UTC in light of this development. The DOW deployed at ACRE with sleet falling on it, and it collected a nine-minute sequence of PPIs, RHIs, and birdbath scans through 0200 UTC. Unfortunately, no soundings could be launched during IOP2 (or any subsequent IOPs) owing to failure of the helium regulator during IOP1.
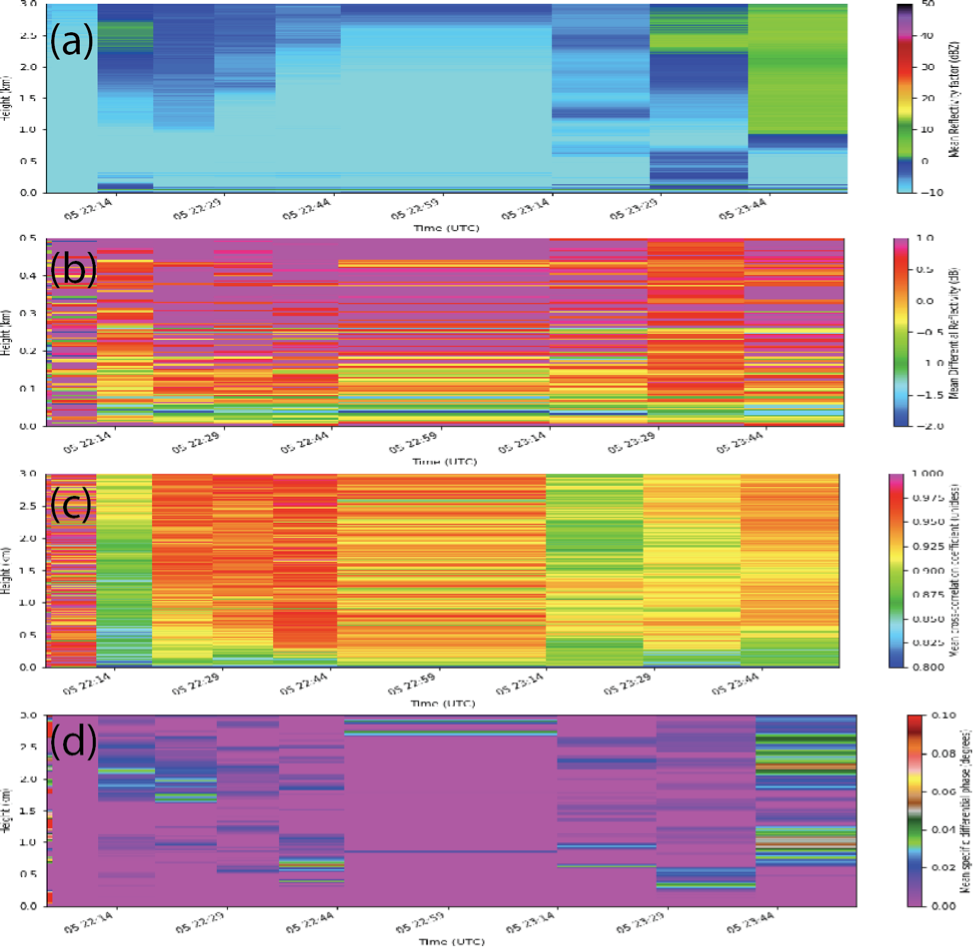
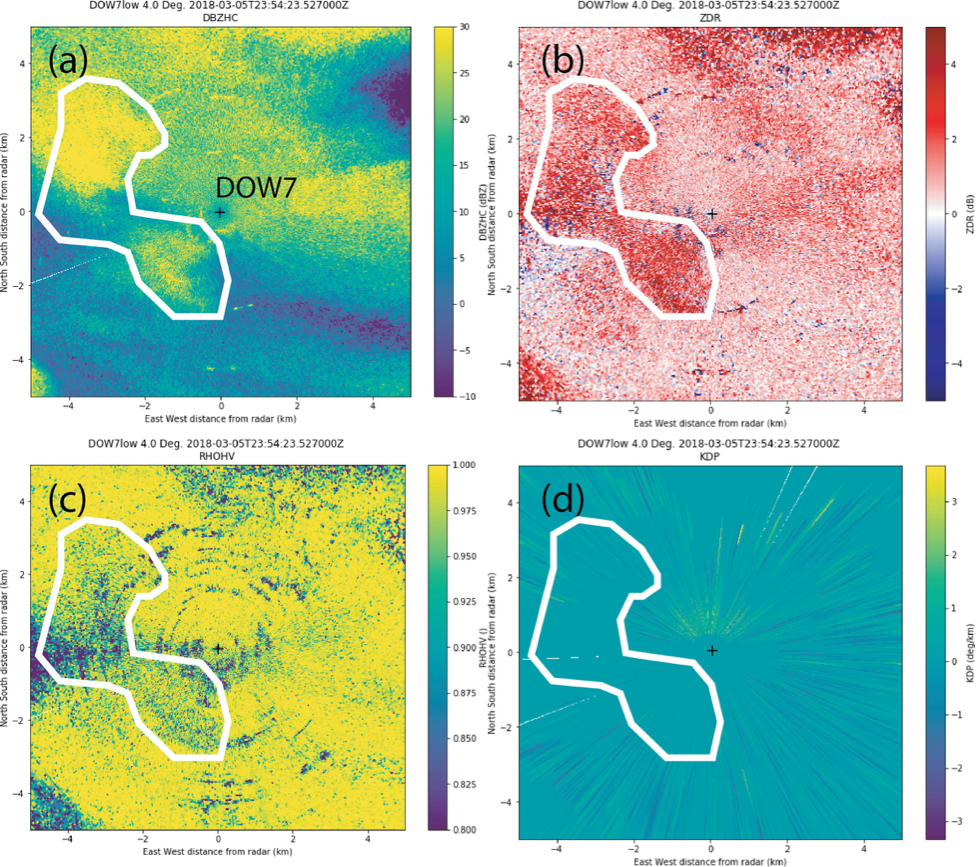
EAPS 52300 student J. Chen was assigned to analyze IOP 2 DOW data. She found that her QVPs did not conclusively show a refreezing signature at a time one was noted in the log (2327 UTC). She hypothesized that the observed horizontal heterogeneity in the precipitation bands was masking the refreezing signature in the QVPs. Indeed, as the precipitation bands passed over the DOW at 2354 UTC (Fig. 14a), a localized signature partially consistent with refreezing (Kumjian et al. 2013), consisting of enhanced ZDR and slightly decreased correlation coefficient, was observed at low elevation angles to the DOW’s immediate southwest (Fig. 15). The expected enhancement in KDP (Kumjian et al. 2013) was not observed (Fig. 15d). In summary, although sleet was observed at the DOW deployment site, inconclusive evidence for refreezing was found in the polarimetric measurements.
IOP 3
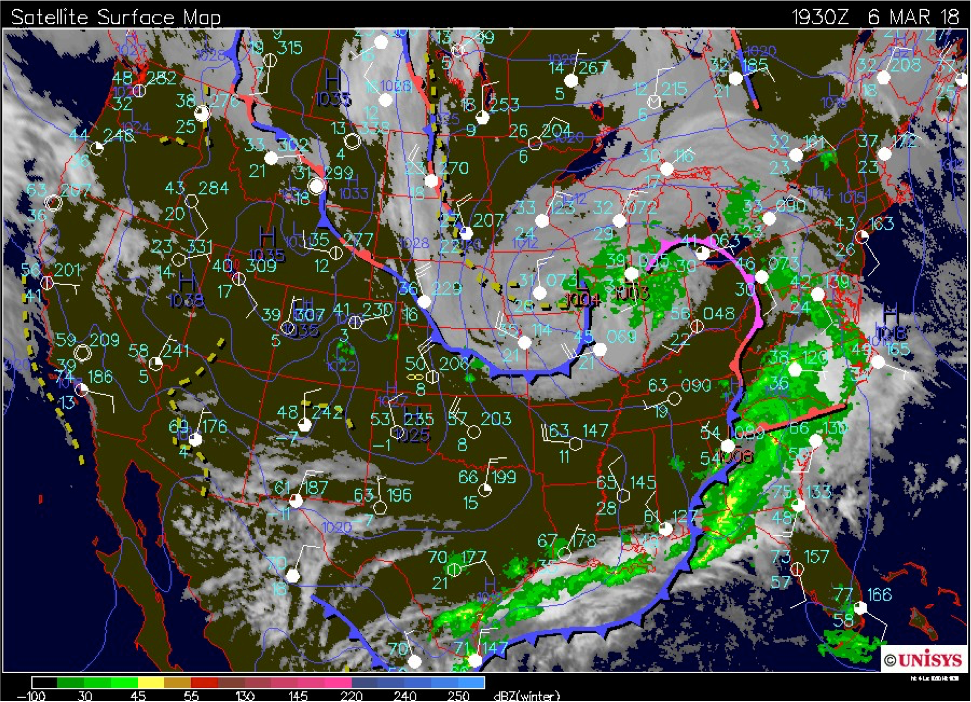
6 March 2018
As the elongated closed surface low from IOP 2 exited Minnesota and traversed Indiana from west to east (Fig. 16), a brief (three-hour) IOP was convened in response to a forecast rain-to-snow transition event. On the east side of the low, rain was expected, but practically none fell in the 12 hours preceding IOP 3 owing to dry deep-layer conditions behind the occluded front.
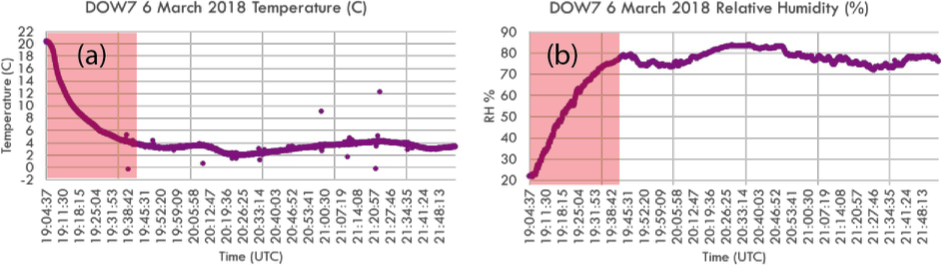
Graupel was observed in falling in Lafayette shortly before IOP 3 began at 1932 UTC, and snow was observed thereafter. The surface temperature recorded by the DOW pod (Fig. 17a) and by KLAF (not shown) never dropped below freezing, but instead oscillated between about 2 and 4 °C. Snow flakes can persist without melting at above-freezing temperatures when the relative humidity (which hovered around 80% for this deployment; Fig. 17b) is low (Matsuo and Sasyo 1981). Indeed, no melting layer was observed during this deployment, leading to its termination at 2230 UTC.
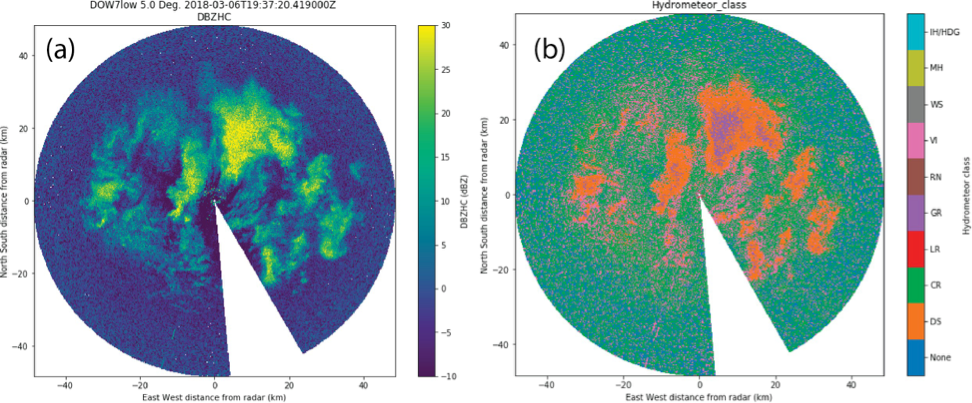
EAPS 52300 graduate student A. LaFleur performed a hydrometeor classification on the DOW high-frequency data, but found (as in IOP1) that classification of vertically aligned ice was suspiciously high owing to ZDR bias of approximately -2.4 dB (not shown). The low-frequency DOW observations (Fig. 18a) exhibited minimal ZDR bias (< 0.2 dB; not shown). Because no soundings were available from Purdue for this deployment, the Lincoln, Illinois (KILX) synoptic sounding taken at 0000 UTC on 7 March 2018 was used in the semi-supervised HCA (Besic et al. 2016) instead (Fig. 18b). Precipitation cores containing mostly graupel (GR) were encircled by regions of dry snow (DS), which were themselves encircled by regions of ice crystals (CR). Very little vertically aligned ice (VI) was classified. Both graupel and dry snow were observed at the surface at ACRE.
Facility Water Vapor Isotopic Analyzer
The NCAR fast water vapor isotopic analyzer (WVISO) is a Picarro L2130-i cavity ringdown spectrometer that measures the concentration of water vapor and its hydrogen and oxygen isotope ratios (δD and δ18O, respectively).