1 March 2018
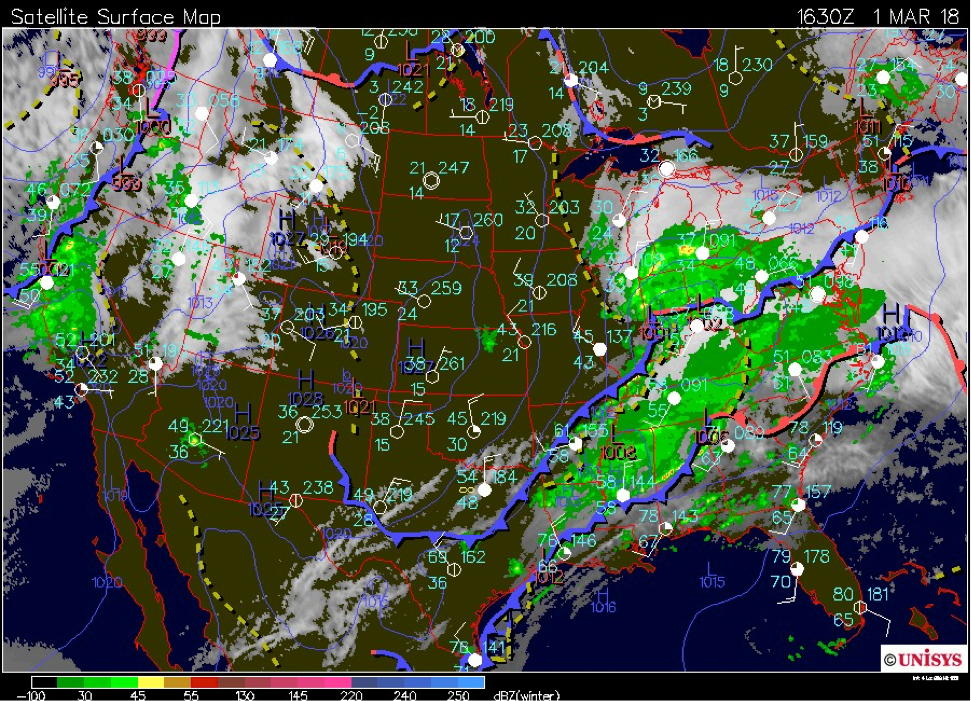
An approaching surface low pressure center passed over west central Indiana on 1 March 2018 (Fig. 6), bringing widespread precipitation and gusty surface winds to the ACRE site. Most of the precipitation was forecast to occur in the warm sector of the low, with little to no trailing precipitation behind the cold front. Accordingly, a melting layer IOP was declared. DOW7 deployed at the ACRE site from 1300 to 1800 UTC, recording increased backing winds, indicating cold air advection in association with the frontal passage (FROPA; Fig 7). The IOP ended when the precipitation shield exited the range of the DOW at 1800 UTC.
While the DOW was deployed, other EAPS 52300 students launched three iMet radiosondes from Purdue campus, recording the boundary layer cooling during the cold frontal passage (Fig. 6). Interestingly, the top of the boundary layer appeared to warm back up slightly following the surface frontal passage, even as the surface temperatures cooled. As a result, the 0 °C level dipped from 2489 m MSL at 1403 UTC to 2074 m MSL at 1616 UTC, then rebounded to 2229 m MSL at 1742 UTC.
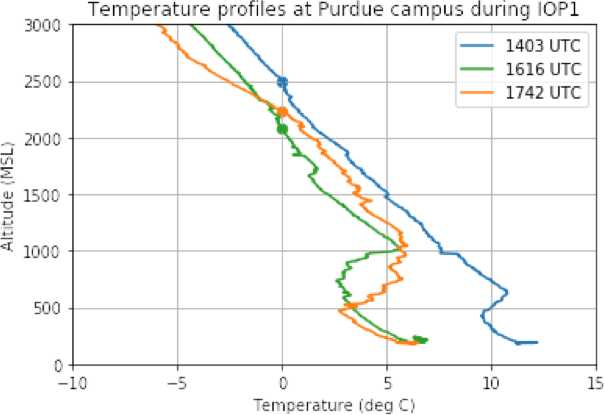
Fig. 8: Temperature profiles at Purdue campus, measured by radiosondes launched during IOP1. The height of the 0 °C level in each profile is marked by a large dot.
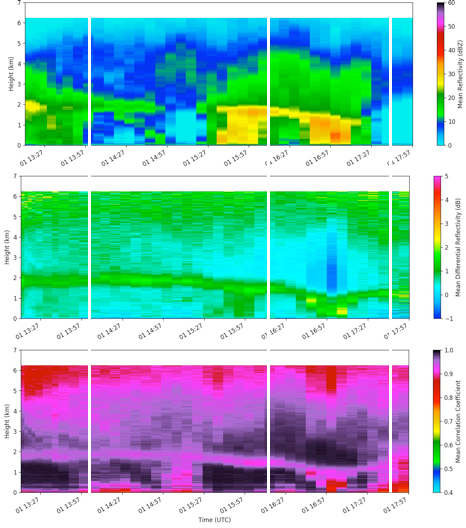
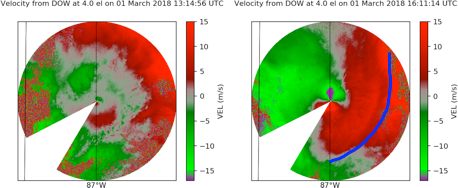
EAPS 52300 student P. Saunders performed QVP analyses of the DOW data for this IOP (Fig. 7). This analysis showed clearly that the melting layer descended toward the surface during the cold FROPA, before rebounding slightly just prior to the end of the IOP. This behavior matches what would be expected based upon the sounding temperature profiles (Fig. 6). An interval of enhanced differential attenuation above the melting layer was also noted at 1704 UTC (Fig. 7b), associated attenuation to the northeast of an area of relatively heavy, possibly convective precipitation northeast of the DOW (Fig. 8a). An RHI scan through this cell (not shown) showed a relatively shallow, weak ZDR column.
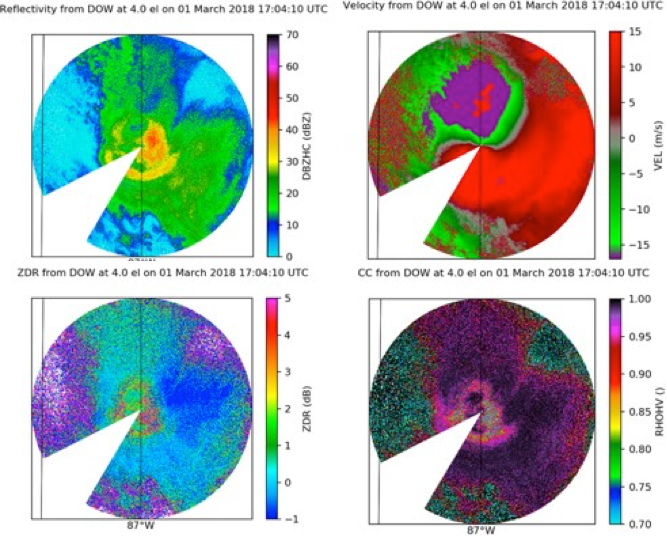
Fig. 10 (clockwise from top left) PPI displays of DOW7 reflectivity (in dBZ), Doppler velocity (in m s-1), correlation coefficient (unitless), and ZDR (in dB) at an elevation angle of 4.0° at 1704 UTC.
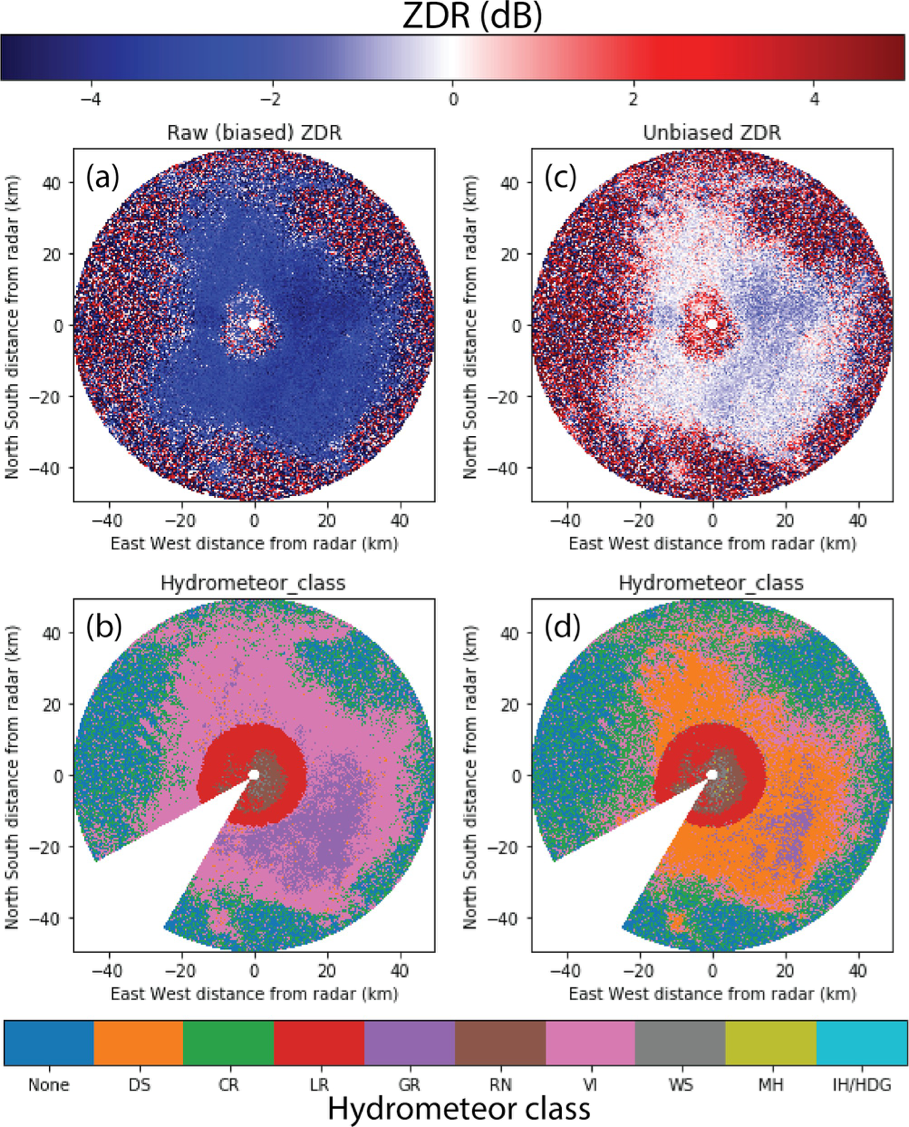
The DOW7 polarimetric observations, including ZDR (e.g., Fig. 11a) and the temperature profile from the 1742 UTC radiosonde (Fig. 8) were ingested into the semi-supervised hydrometeor classification algorithm (SSHCA; Besic et al. 2016) contained in Py-ART. The ratio of gates classified as vertically aligned ice (VI) to dry snow (DS) seemed unrealistically high for the warm sector of an extratropical cyclone (Fig. 11b). Through azimuthal averaging of the near-vertically pointing “birdbath” scans (Gorgucci et al. 1999) collected with each volume (not shown), it was found that ZDR values recorded by the DOW’s “high” channel (9.5 GHz) were biased approximately 2.75 dB too low. ZDR values less than zero above the melting layer are commonly associated with vertically aligned ice. Applying a ZDR bias correction factor (Fig. 11c) resulted in a much more realistic ratio of vertically aligned ice to dry snow classified gates (Fig. 11d).