5 March 2018
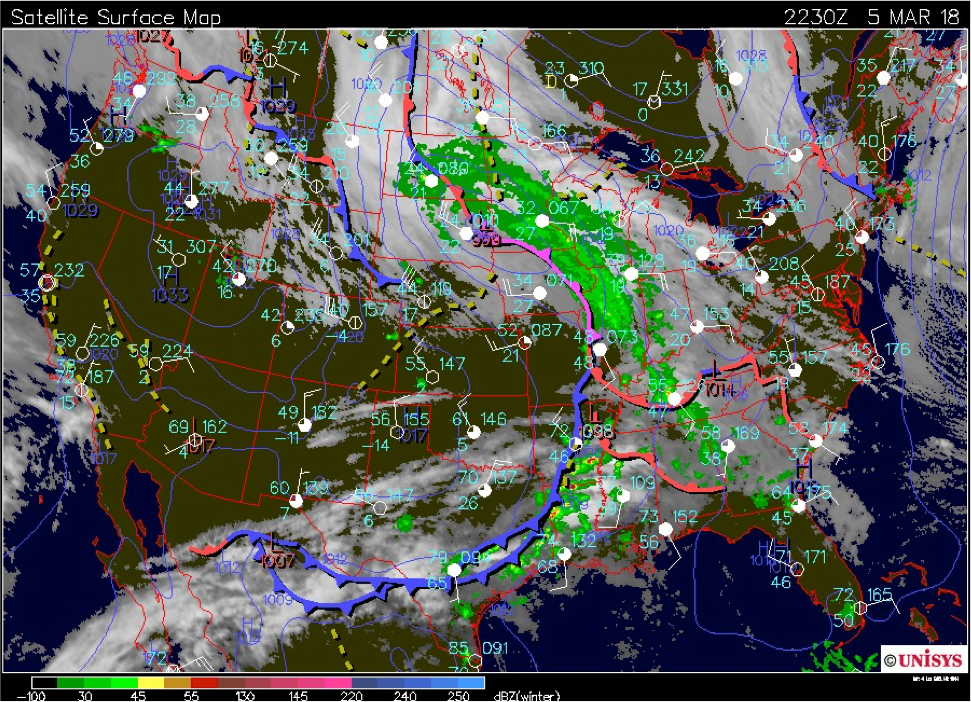
A cycloidally tracking low pivoted over Minnesota as it began to occlude (Fig. 12). The occluded front, trailing southeast from the surface pressure minimum, pushed northeastward through Indiana during the evening. The NAM and GFS forecast soundings for Lafayette, Indiana (not shown) both indicated the potential for mixed winter precipitation. A refreezing signature IOP was planned for that evening beginning at 2300 UTC.
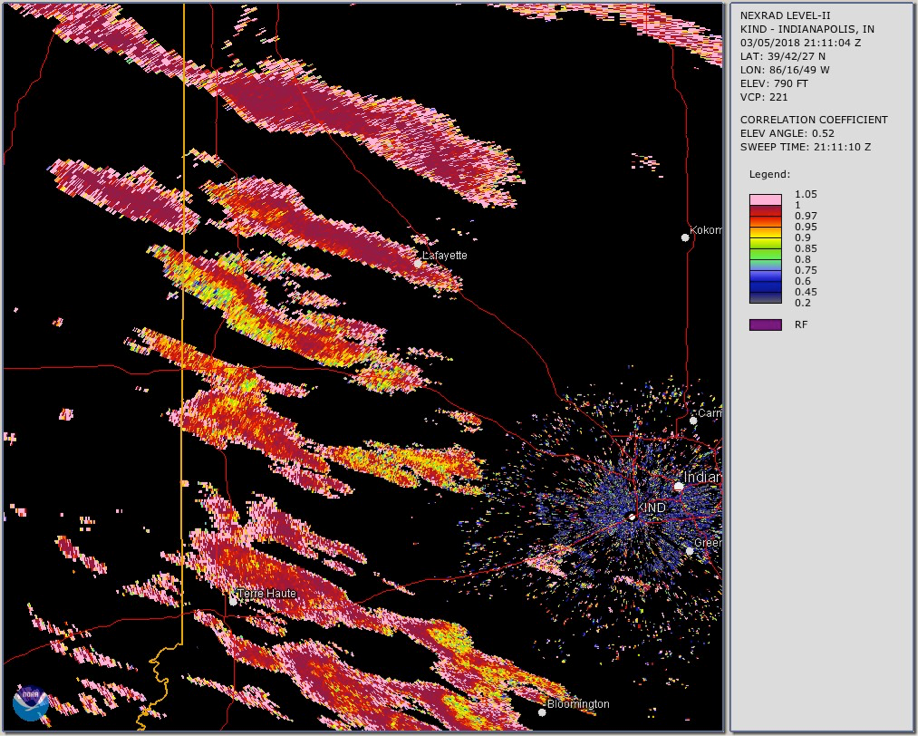
As the precipitation bands along the occluded front approached Lafayette during the afternoon, some were observed to contain widely varying values of correlation coefficient (Fig. 13). The IOP start time was moved back to 2200 UTC in light of this development. The DOW deployed at ACRE with sleet falling on it, and it collected a nine-minute sequence of PPIs, RHIs, and birdbath scans through 0200 UTC. Unfortunately, no soundings could be launched during IOP2 (or any subsequent IOPs) owing to failure of the helium regulator during IOP1.
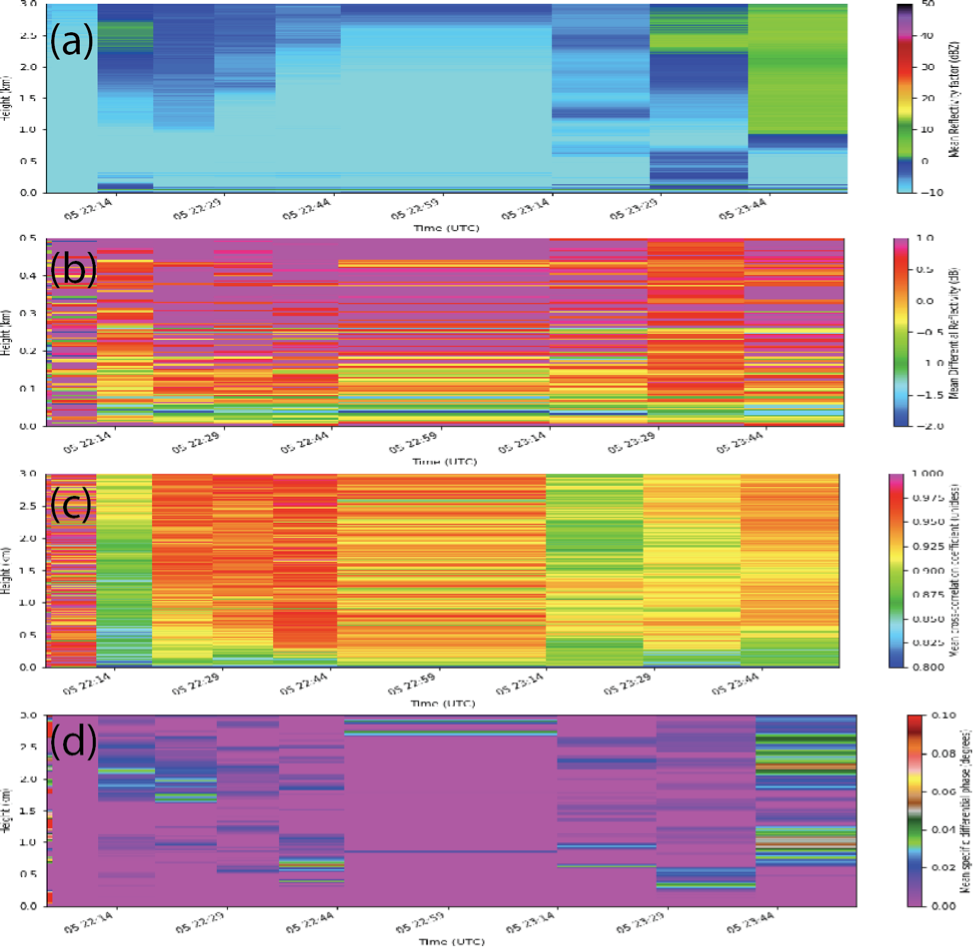
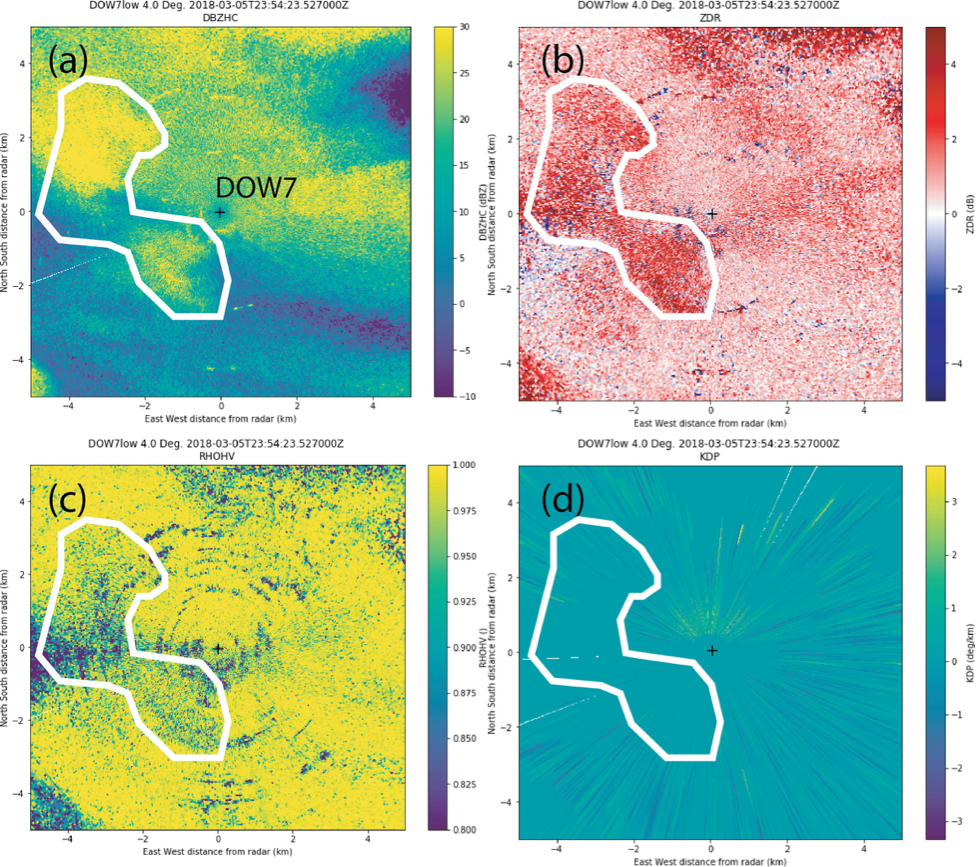
EAPS 52300 student J. Chen was assigned to analyze IOP 2 DOW data. She found that her QVPs did not conclusively show a refreezing signature at a time one was noted in the log (2327 UTC). She hypothesized that the observed horizontal heterogeneity in the precipitation bands was masking the refreezing signature in the QVPs. Indeed, as the precipitation bands passed over the DOW at 2354 UTC (Fig. 14a), a localized signature partially consistent with refreezing (Kumjian et al. 2013), consisting of enhanced ZDR and slightly decreased correlation coefficient, was observed at low elevation angles to the DOW’s immediate southwest (Fig. 15). The expected enhancement in KDP (Kumjian et al. 2013) was not observed (Fig. 15d). In summary, although sleet was observed at the DOW deployment site, inconclusive evidence for refreezing was found in the polarimetric measurements.