Description
This page describes data quality processing of surface observations taken by ISS during the PECAN project. More information on the ISS PECAN sites and plots from other ISS instruments are available here.
FP3 [ISS1] (Ellis, KS): The only surface instrument was a WXT-520 integrated weather sensor reporting wind speed, wind direction, temperature, relative humidity, pressure, rain- and hail-fall. This site ran from 16 May - 18 July.
FP4 [ISS2] (Minden, NE): Instrumentation at this site was:
- 3D sonic anemometer (CSI, CSAT3) mounted at 9m height
- Temperature/relative humidity (NCAR) mounted at 2m height
- Integrated 4-component radiometer (Kipp&Zonen CNR4) mounted at 1m height above grass
- Tipping bucket rain gauge (Hydrological Services TB4)
- Barometer (Vaisala PTB220) with a quad-disk port at 2m height
Data were acquired by an NCAR Data Storage Module (DSM), linked by WiFi to the ISS trailer at the site.
This site was set up early, with operations dates of 23 April - 25 July. During 6 nights before 1 June data were lost, possibly due to a communications issue.
Buildings and other structures were located to the NE, E, and W about 70m away and a golf course (with a dip in terrain and trees) started about 200m to the S.
FP5 [ISS3] (Brewster, KS): This site was instrumented the same as FP4, except that the radiometer was a Hukseflux NR01 and the surface viewed by this radiometer was a combination of tall grass and disked dirt. Buildings (hangers) and the ISS trailer were as close as 50m to the W->NW and a farmstead (with some trees) was about 170m to the SW. This site ran from 15 May - 22 July.
Quality Control Analysis
The WXT-520 appears to have operated normally at FP3, so no additional processing was necessary. Initial issues with wind direction were found to be in the data processing and have been corrected.
Barometers also worked as expected and required no additional processing. It is interesting that the mean pressures at FP3 and FP4 are almost identical, since the site elevations were within 4m of each other (despite being separated by 180km).
Rain rates at FP3 were reported at higher resolution and had somewhat higher totals than at FP4 and FP5. One erroneous rain spike was noted at FP5 at 12:32 on 2 July that could have been due to tall grass at that site. The grass was manually shortened 2 days later. The spike has been removed from the data.
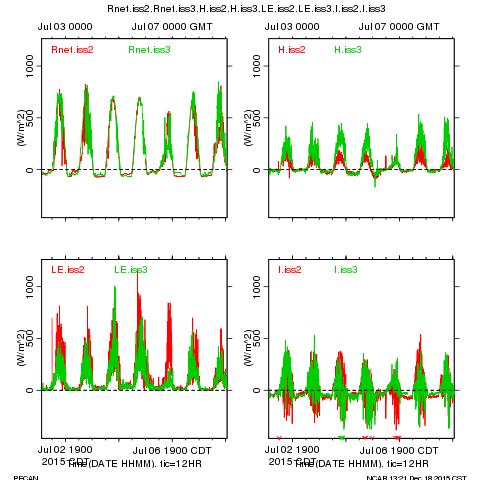
Several radiometer issues occured:
- Starting 14 June, Tcase at FP4 had several downward spikes. These spikes have been removed by a combination of deleting data below 1.5 C and manual specification of bad periods. The cause of this problem is unknown.
- Starting at 13:00 28 May, the radiometer values at FP5 had frequent drop-outs on all channels (not necessarily at the same time). The Rlw.in thermopile also became "multimodal" at this time, with level shifts for ca. an hour at a time. Eventually, at 19:00 6 June, the sensor reported approximately constant values until it stopped reporting completely at 19:00 8 June. This could have been due to water infiltration into this prototype sensor. With a lot of effort, perhaps 10% of the Rsw data are recoverable during the first period, but we have chosen to eliminate this entire block of data. Good data begin on 19 June.
- Radiometers were cleaned once at each at FP4 and FP5, but no effect was seen in the data, so no action was needed in data processing, other than to remove these cleaning events themselves.
Sonic anemometer data had issues in rain, as is normal for this sensor. Most of these bad data are removed by our processing, based on the anemometer's internal diagnostic flag. Some likely erroneous data still appear during the rainy periods. We will remove these by checking if the internal flag was set at any time during each averaging period (of 5 minutes). This filtering also removed the one high wind period in Fp5 spd on 5 July.
Value-Added Processing
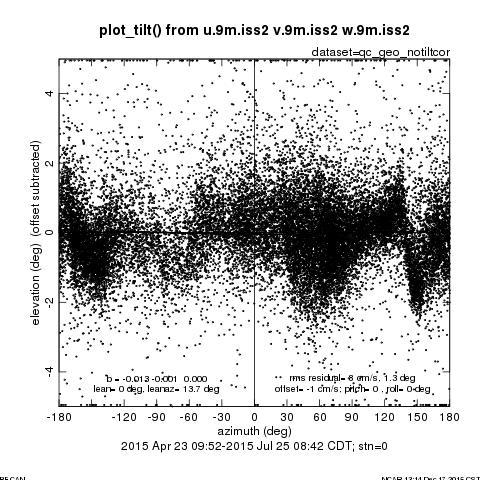
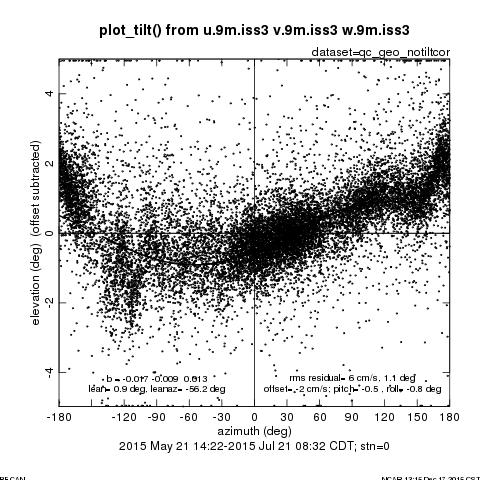
Tilt corrections have been calculated to rotate the sonic anemometer data into a coordinate system parallel to the surface (even if it is not horizontal). This has been done for FP4 and FP5. Both sets of tilts are small: The FP4 tilt was 0 degrees (thus no tilt, though a small offset in w is still removed) and FP5 was 0.9 degrees. Neither tilt is easily explained by the topography or buildings, so they may represent the tower not being exactly vertical (in the case of FP5). Datasets both with and without this correction have been produced.
Calculation of long-wave radiation from the sensor Rpile and Tcase measurements has been added to the dataset.
Sensors to measure latent heat flux directly were not deployed at FP4 and FP5, despite some interest in this measurement. Nevertheless, we can calculate latent heat from the sonic anemometer virtual heat flux measurement plus an estimate of the Bowen ratio, B. We estimate B as the square root of the ratio of the power spectrum of sonic temperature (at 9m) to the power spectrum of humidity as measured by the T/RH sensor (at 2m). The values of the power spectrum are only used for frequencies that both represent turbulence and are within the frequency response of this sensor -- in this case periods from 1 to 5 minutes. This method assumes that B is the same at 2m and 9m heights (reasonable). It also will have large uncertainties during periods with low temperature variance (morning and evening stability transitions). An example of the surface energy balace using this calculation to produce LE shows an imbalance term (I) that, although noisy, is similar in character to the expected soil heat flux (not measured). This w'h2o' calculation has been added to the data files, in case it is useful.
Data Format
Five-minute average data from all 3 sites are available in one NetCDF file for each day. Data in these files follow the ISFS NetCDF format, documented here. File names are of the format pecan_*_YYMMDD.nc and are in two directories: (* indicates 'tc' for tilt corrected or 'ntc' for no tilt correction)
- QC with no tilt correction: Quality-controlled data with winds in geographic coordinates.
- QC with tilt correction: Quality-controlled data with winds in geographic coordinates and also rotated in a surface-parallel coordinate system using the tilt correction described above.


