Introduction
The Cloud and Aerosol Chemistry Experiment (CACHE) was designed to probe the remote marine atmosphere, and investigate its interaction with a montane, coastal forest on the Olympic Peninsula of Washington State.The prime objective of this experiment was to make in situ measurements of cloudwater fluxes to the forest canopy, and to identify the governing processes for cloud water deposition. Other goals included analysis of the relationship between cloud microphysics and precursor aerosol, and quantification of carbon dioxide exchange between forest and atmosphere.
Researchers believe cloud water deposition to be important both hydrologically and chemically for montane ecosystems where it occurs frequently, and it has been sited as a potential cause of forest injury in the Appalachian Mountains of the Eastern U.S. However, very few direct measurements of this process have been made; more often, researchers have resorted to the use of inferential measurements and models which have not been validated. In 1993 and 1994, Oregon State University (OSU) researchers conducted eddy correlation measurements (CACHE 1 and 2) of cloud water deposition at Cheeka Peak, Washington.They measured substantial liquid water fluxes of ~1 mm per 24 hours of surface cloud, about twice the magnitude of those reported by researchers in the United Kingdom. The greatest uncertainty in the reported measurements is the degree to which the flux measured at a single point over the canopy is representative of fluxes over a broader area of complex terrain.
During the third measurement campaign (dubbed CACHE-3 by OSU, and CACHE94 by NCAR) ASTER was deployed along with existing instrumentation from OSU. The addition of ASTER to the experimental design allowed for measurements of cloud water fluxes at three stations, with 5m vertical and 28 m horizontal separations, to address representativeness of the measured flux. Many operational periods were defined, to allow for variable instrument configurations including side-by-side intercomparisons for the OSU cloud microphysical instruments. The calibration of these instruments was tested on a near-daily basis. The standard ASTER deployment provided for a variety of auxiliary measurements (especially meteorological profiles and radiation measurements), many of which may be helpful in describing and defining the process of cloud water deposition. Further efforts were made to characterize the structure of the forest canopy at Cheeka Peak. The data set described herein is certainly the best to date for analyzing cloud water deposition and its governing processes.
As an add-on to the CACHE-3 deployment, a fast response carbon dioxide sensor was operated at one of the flux stations to measure forest respiration and photosynthetic rates. Canopy measurements were made over a 100 m transect through the forest (upwind of the sampling towers), to determine speciation, leaf areas, avnd height of the conifers. The CO2 sensor was also subjected to periodic calibration and automatic zero response
This work was sponsored by the National Science Foundation under a grant ATM 9118316.
The ASTER facility is maintained by the Surface and Sounding Systems Facility of the Atmospheric Technology Division of the National Center for Atmospheric Research.
Summary
Personnel Involved
-
- Principle Investigator: Rich Vong
- OSU Personnel: Andy Kowalski and Peter Anthoni
- ASTER Project Scientist: Tony Delany
- ASTER Project Engineer: Steve Semmer
- ASTER Personnel: Tom Horst, Kurt Knudson, Gordon Maclean, Charlie Martin, John Militzer, Santiago Newbery, Steve Oncley, Lou Verstraete
Location of Field Site
The ASTER facility was deployed at the Cheeka Peak cloud observatory, on the north-west extremity of the Olympic peninsula of Washington (See Figures 1 and 2).
Under many synoptic conditions this mountain-top site receives clean oceanic air advecting from the open Pacific ocean. Other conditions lead to off shore winds resulting in exposure to continental air and, on occasion, to polluted air from the Seattle urban area. Lower level air flow from the Seattle area along the Straits of Juan Fuca sometimes results in polluted air flowing out to sea and then returning on the westerly air flow.
The CACHE94 research site was located at 124° 37' 30''W, 48° 17'' 56''N at an elevation of 463 meters, 4 kilometers inland from Anderson Point. The Makah Bay, Washington quadrangle of the 7.5 minute U.S.G.S. topographic map shows the topography to the west of the research area. (See Figure 3). The research site occupied the flat crest of the end of the south-extending ridge of Cheek Peak. From the ridge top the terrain falls off steeply to the east, south and west with slopes approaching 30°.
The slopes are forested with a mixture of coniferous trees and evergreen shrubs. A transect was made by Lee Klinger of the Atmospheric Chemistry Division of NCAR from the ridge-top upwind and down the slope to the west. Figure 4 illustrates the height and leaf area distribution along the transect to the west. These data are tabulated in the following table.
| Silver Fir | Western Hemlock | Red Cedar | Salal | |||||
|---|---|---|---|---|---|---|---|---|
| Distance | Height | Leaf Area | Height | Leaf Area | Height | Leaf Area | Height | Leaf Area |
| m | m | m^2m^-2 | m | m^2m^-2 | m | m^2m^-2 | m | m^2m^-2 |
| 10 | 4.60 | 5.00 | 5.00 | 1.10 | 0.00 | 0.00 | 1 | 2.99 |
| 20 | 5.94 | 18.00 | 4.00 | 3.02 | 0.00 | 0.00 | 1 | 3.31 |
| 30 | 7.21 | 13.38 | 6.30 | 1.15 | 0.00 | 0.00 | 1 | 5.59 |
| 40 | 6.63 | 7.99 | 8.00 | 2.02 | 0.00 | 0.00 | 1 | 6.97 |
| 50 | 8.40 | 16.13 | 5.70 | 8.62 | 0.00 | 0.00 | 1 | 0.71 |
| 60 | 5.77 | 12.37 | 4.50 | 0.59 | 0.00 | 0.00 | 1 | 7.71 |
| 70 | 5.70 | 6.84 | 6.70 | 1.95 | 0.00 | 0.00 | 1 | 7.60 |
| 80 | 5.90 | 5.62 | 6.20 | 6.64 | 6.30 | 2.66 | 1 | 5.26 |
| 90 | 7.40 | 17.87 | 7.10 | 10.69 | 4.00 | 0.63 | 1 | 0.78 |
| 100 | 9.74 | 21.31 | 10.00 | 5.62 | 0.00 | 0.00 | 1 | 1.79 |
Dates of Field Program
-
- Equipment arrived at the field site on July 25th, 1994
- Setup and checkout from July 25th until August 8th
- Operational period August 8th to September 23rd (Julian days 214 - 266)
- Tear-down commenced September 24th
| Operations | Julian Day | date | Day |
|---|---|---|---|
| Arrival | 206 | July 25th | Mon |
| Set-up and check-out | 206-214 | July 25th - 2 August 2nd | Mon - Tues |
| Operations Start | 214 | August 2nd | Tues |
| ops 1 | 214 - 218 | August 2nd - 6th | Tues - Sat |
| ops 2 | 218 - 221 | August 6th - 9th | Sat |
| ops 3 | 221 - 224 | August 9th - 12th | Sat - Fri |
| ops 4 | 224 - 227 | August 12th - 16th | Fri - Tues |
| ops 5 | 227 - 228 | August 16th | Tues |
| ops 6 | 228 - 231 | August 16th - 19th | Tues - Fri |
| ops 7 | 231 - 235 | 19 - 23 August 19th - 23rd | Fri - Tues |
| ops 8 | 235 - 256 | August 23rd - September 13th | Tues - Tues |
| ops 9 | 256 - 260 | 13 - 17 September 13th - 17th | Tues - Sat |
| ops 10 | 260 - 266 | September 17th - 23rd | Sat - Fri |
| Teardown Start | 267 | September 24th | Sat |
Operations
Field site
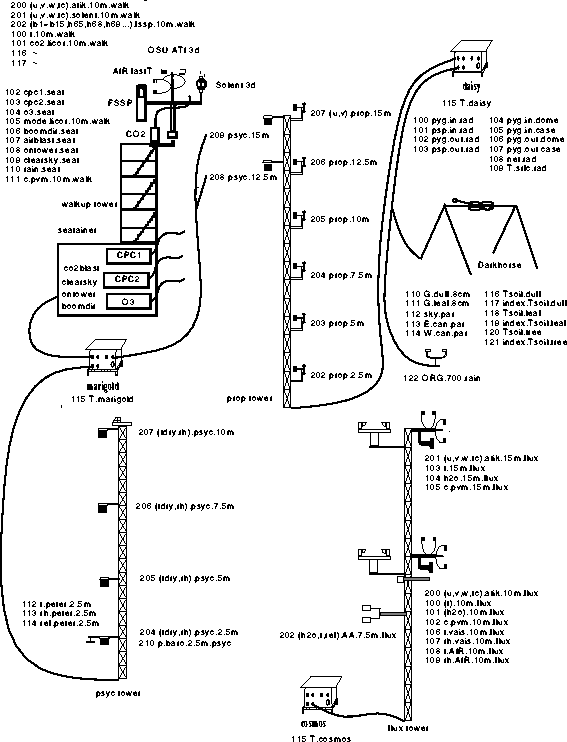
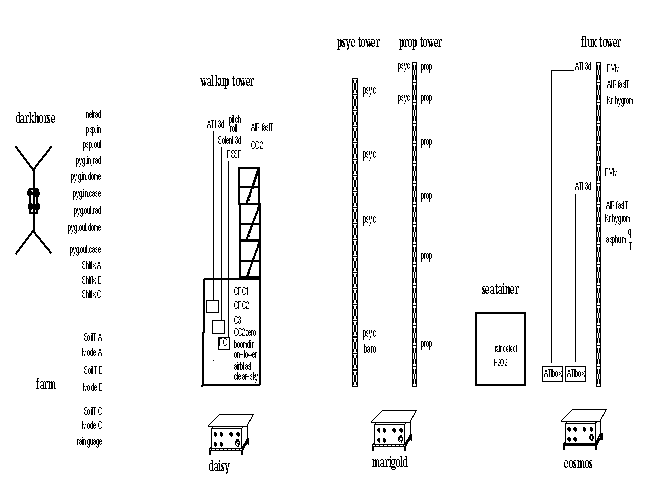
The CACHE94 operation offered several special problems not encountered in the conventional ``flat land'' deployments. The access to the mountain top was a steep, poor-surfaced road and the conventional towing vehicles could not deliver the ASTER trailers to the site. Local logging contractors, using heavy equipment, were employed to haul the trailers to the site. Due to the limited area available on the ridge top and the presence of the existing instrumented towers and seatainers serving as research shelters, the ASTER towers and sensors had to be deployed among the existing structures. The bare rock surface precluded the use of driven stakes for guy attachments and a limited number of one ton concrete ``dumplings'' served as tower bases and guy points. This resulted in difficulty in the establishment of the desired directionality to the sensor booms. The tower bases were fixed atop the concrete dumplings at different elevations and this displacement had to be taken into account when specifying sensor heights. An advantage of the site derived from the forested nature of the slopes. As the displacement height was some 5 meters or so the ASTER trailers could be positioned within fifteen meters of the towers without inducing flow disturbance. This allowed for a simpler power and data cable layout.
Click here to see the equipment layout for CACHE94
The location of the radiation sensors presented a problem. All the flat areas at the site had bare rock or disturbed gravel surfaces and the more representative forested areas had fairly extreme slopes and were difficult to access. A trail was cut into the vegetation down the southern slope of the ridge and the radiation stand was erected with the cross beam accurately level with an east-west orientation.
The environment at Cheeka Peak often presented conditions of wind-driven cloud. This situation imposed a severe test on the entire sensor network. The sensors themselves, the electronics and the cabling connections all were susceptible to water invasion. Equipment and procedures had to be adapted to overcome this problem.
Figure 6 depicts a schematic of the equipment layout at the CACHE94 site.
Operational periods
The ASTER system was fully operational by 8 August and, for the duration of the field program, data was continuously acquired from all the ASTER-maintained sensors.
Operational Period: August 8th to September 24th (Julian days 214 - 268)
-
- 1st operational period, ops1 : jd(1994, 214, 00:00:00 - 1994, 218, 21:00:00)
- 2nd operational period, ops2 : jd(1994, 218, 21:00:00 - 1994, 221, 18:48:00)
- 3rd operational period, ops3 : jd(1994, 221, 18:48:00 - 1994, 224, 15:41:00)
- 4th operational period, ops4 : jd(1994, 224, 15:41:00 - 1994, 227, 20:46:00)
- 5th operational period, ops5 : jd(1994, 227, 20:46:00 - 1994, 228, 01:31:00)
- 6th operational period, ops6 : jd(1994, 228, 01:31:00 - 1994, 231, 17:00:00)
- 7th operational period, ops7 : jd(1994, 231, 17:00:00 - 1994, 235, 19:00:00)
- 8th operational period, ops8 : jd(1994, 235, 19:00:00 - 1994, 256, 18:20:00)
- 9th operational period, ops9 : jd(1994, 256, 18:20:00 - 1994, 260, 16:30:00)
- 10th operational period, ops10 : jd(1994, 260, 16:30:00 - 1994, 268, 00:00:00)
Tear-down commenced September 24th, 1994.
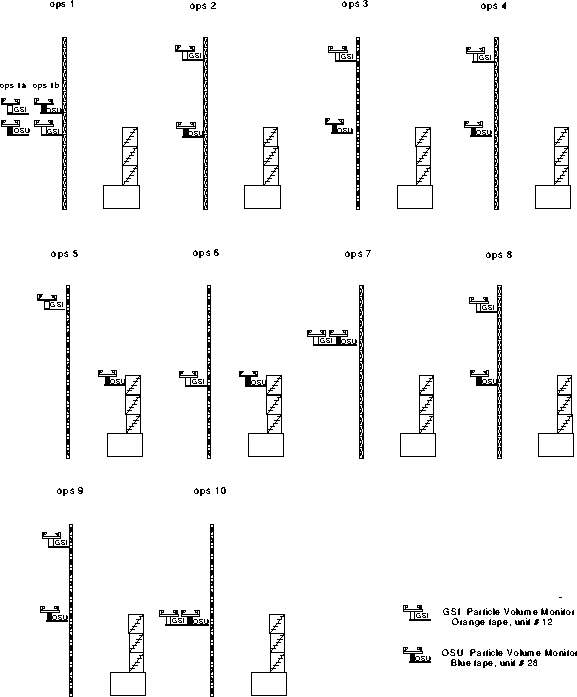
Figure 7 Schematic illustrating differing placements for the two PVM's
The original archiving configuration of the sensors which was established for the first operating period of CACHE94 is shown below.
The fast sensors on the walkup tower were originally archived as:
-
- marigold 100, 101, 200, 201, and 202
Walkup Tower Fast Sensors:
-
- marigold: 100, 101, 200, 201, 202 walk/fast
The slow sensors on the walkup tower and in the seatainer were originally archived as:
-
- marigold 102, 103, 104, 105, 106, 107, 108, 109, 110, and 111
Walkup Tower & Seatainer Slow Sensors:
-
- marigold: 102, 103, 104, 105, 106, 107, 108, 109, 110, 111 walk/slow
The psychrometers and the barometer were originally archived as:
-
- marigold 204, 205, 206, 207, 208, 209, 210, 112 ,113, and 114.
Psycs and Barometer:
-
- marigold: 204, 205, 206, 207, 208, 209, 210, 112, 113, 114 psyc/psyc
The propellor vanes were originally archived as:
-
- daisy 202, 203, 204, 205, 206, and 207
Props:
-
- daisy: 202, 203, 204, 205, 206, 207 prop/prop
The sensors on the flux tower were originally archived as:
-
- cosmos 100, 101, 102, 103, 104, 105, 106, 107, 108, 109, 200, and 201.
Flux Tower:
-
- cosmos: 100, 101, 102, 103, 104, 105, 106, 107, 108, 109, 200, 201 flux/fast
The radiation sensors, the soil sensors and the rain sensor were originally archived as:
-
- daisy 100, 101, 102, 103, 104, 105, 106, 107, 108, 109, 110, 111, 112, 113, 114, 116, 117, 118, 119, 120, 121, 122, and 123
Rad Farm, Tsoils, Rain:
-
- daisy: 100, 101, 102, 103, 104, 105, 106, 107, 108, 109, 110, 111,112, 113, 114, 116, 117, 118, 119, 120, 121, 122, 123 rad/rad
Changes in this archiving configuration lead to the establishment of a subsequent operational period.
The nominal original sensor configuration was as shown in Figure 6. Subsequent operational periods were occasioned either by changes in the archiving configuration or by changes in the positions of the two Particle Volume Meters (PVM's). A schematic of the different configurations for the two PVM's is shown in Figure 7.
Cloud research periods
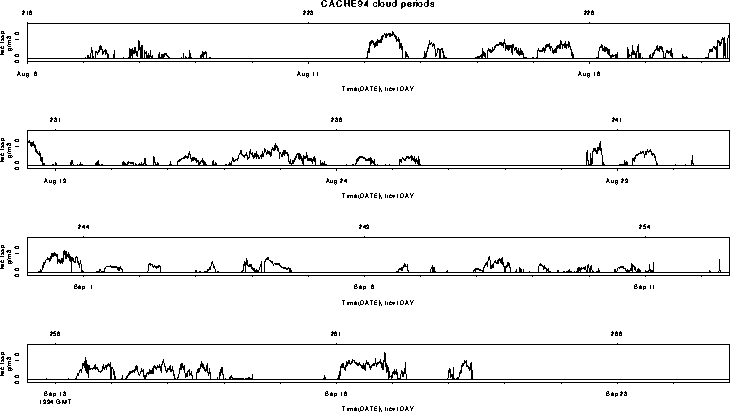
The prime objective of CACHE94 was the investigation of the turbulent deposition of cloud droplets. Cloud periods were frequent, lengthy, and thick during the campaign, as can be seen in Figure 8. Results from CACHE-1 indicate that periods of steady and continuous cloud are suitable for the measurement of cloud water deposition. This criterion is quantified as the mean-scaled standard deviation of cloud liquid water content; during CACHE-1, a value of 0.3 has been found (for half-hour statistics) to be a reasonable threshold for a 10m sensor height, stratifying cloud events into steady and more variable types.
The preferred wind direction for examination of turbulent fluxes (of liquid water, CO2, heat, momentum, etc.) is from the South-Southwest to North-Northwest. These conditions prevailed during cloud events, but clear-air periods must be segregated by wind direction in order to minimize the effects of flow distortion by the towers, booms, and instruments.
Figure 8 Cloud periods during CACHE94
Sensors
During CACHE94 both ASTER supplied and maintained sensors and user supplied and maintained sensors were deployed.
| Sensors | Rate | # | Make | Location | Height** |
|---|---|---|---|---|---|
| 3-Dimensional sonic anemometer model K | 10 | 2 | Applied Technologies | flux twr | 10 & 15 m |
| 3-Dimensional sonic anemometer model K* | 10 | 1 | Applied Technologies | walkup twr | 10 m |
| 3-Dimensional sonic anemometer research grade | 12 | 1 | Solent | walkup twr | 10 m |
| Fast-response temperature | 20 | 3 | Atmos. Instrum. Res | flux twr | 10 m |
| flux twr | 15 m | ||||
| walkup twr | 10 m | ||||
| Fast-response humidity Kr hygrometer | 20 | 2 | Campbell Scientific | flux twr | 10 & 15 m |
| Fast-response humidity infrared hygrometer | 10 | 1 | Applied Applications | flux twr | 10 m |
| Fast-response CO2 model 6151 | 10 | 1 | Licor | walkup twr | 10 m |
| FSSP 15 channel* | 10 | 1 | PMS------? | walkup twr | 10 m |
| Particle volume monitor* | 10 | 2 | Gerber inc------? | flux twr / walkup twr | 10 & 15 m |
| PCNC1* | 1 | 1 | TSI------? | walkup twr | 3 m |
| PCNC2* | 1 | 1 | TSI------? | walkup twr | 3 m |
| Ozone* | 1 | 1 | Thermo Electron------? | walkup twr | 3 m |
| Wind speed and direction propvane | 1 | 6 | NCAR | prop twr | 1.5, 5, 7.5, 10, 12.5, & 15 m |
| Platinum resistance thermometer and humiter psychrometer | 1 | 6 | NCAR | psyc twr & prop twr | 1.5, 5, 7.5, 10, 12.5, & 15 m |
| Pressure sensor barometer | 1 | 1 | NCAR | psyc twr | 1.5 m |
| Pyranometers | 1 | 2 | Eppley | Radiation stand | 1 m > canopy |
| Pyrgeometers | 1 | 2 | Eppley | Radiation stand | 1 m > canopy |
| Net radiometer Q5 | 1 | 1 | Micromet Systems | Radiation stand | 1 m > canopy |
| Surface infrared radiometer | 1 | 1 | Everest Interscience------? | under canopy | 45° downlook |
| Photosynth. active radiometer | 1 | 3 | Eppley | near rad stand | up-, down-, thru-, canopy - looking |
| Soil temperature multiplexer | 1 | 12 | NCAR | Duff | 1, 3, 5, & 7 cm deep |
| Leaf mold | 1, 3, 5, & 7 cm deep | ||||
| in stump & tree | |||||
| Soil heat flux | 1 | 3 | Micromet Systems | Duff | 8 cm deep |
| Leafmold | 8 cm deep |
* user supplied sensor
** all heights are relative to the level of the base of the prop tower
Sensor operational history
The following is a brief overview of the performance of the sensors. For additional information on any sensor search the logbook (see section on logbook) under the appropriate category.
Sonic anemometers
Four sonic anemometers were deployed for the CACHE94 project. Two ATI K sonic anemometers, each associated with a PVM, were mounted on the flux tower. A Solent 3D sonic anemometer and the OSU ATI were mounted on the rotating boom of the walk-up tower. In general the systems on the flux tower were used to calculate the flux gradient of cloud droplets and the systems on the walk-up tower were used to determine the size dependant flux of cloud droplets. The orientation of the sonic anemometers was determined by optically sighting the transducer mounts using a theodolite. Because of the restricted access on the ridge top there was difficulty in making these sightings. Noise and spiking occurred when wind driven cloud water penetrated the electronics of the ATI anemometers. On many occasions the electronics were inspected for moisture and in some cases liquid water was found. Electronic card edges were cleaned and transducers reseated. An electrical grounding problem occurred for the boom-mounted anemometers. The pivoting sleeve electrically insulated the boom and a hard-wire ground had to be provided. This was done on September 6th. (see logbook#282) As the entire research program depended so critically on the operation of the sonic anemometers the devices were rigorously maintained.
Fast thermometers
The fast thermometers performed well throughout the deployment with only one instance of needed replacement.
Fast Krypton hygrometers
Campbell Scientific Krypton hygrometer had persistent problems due to the high moisture environment. Their electronics were not adequately sealed against water penetration and when the electronics became moist the noise level increased. Attempts were made during the deployment to achieve a better seal but this was not completely successful. The lenses scaled in the high humidity and constant exposure to liquid water. It was found necessary to swab the lenses at least once a week. Green scum of some kind appeared to grow around the lenses and this needed to be cleaned away. Early in the deployment, during ops1, the mounting of the hygrometers was changed to align the optical path horizontal rather than vertical. This was done in an attempt to reduce water pooling on the lenses. It had some effect but the sensor still accumulated water during cloud events. Eventually both Krypton sensors failed and the Analytic Applications infrared hygrometer was used to measure water vapor.
Fast Analytic Applications Infrared Hygrometer
This sensor was installed on the ASTER array to be tested as part of an arrangement between OSU and Analytic Applications. Although the sensor was not as rapid in its response (no information beyond 1 Hz) it was capable of surviving the adverse moisture conditions. At the end of the deployment it was used to calculate moisture fluxes.
Fast CO2 sensor
The sensor was supplied by ASTER and was maintained by Peter Anthoni of OSU. The sensor was installed in the seatainer and sample air was drawn from the vicinity of the OSU ATI sonic anemometer through 15 m of high density polyethylene tube. The delay was measured to be 1.4 seconds. The sensor was zeroed by switching the intake flow through a canister containing sodalime. The solenoid switching was actuated under command of the OSU PC. This OSU PC output a mode signal to define these periods. Calibration checks performed after jday 241, when calibration gas became available, indicated that the atmospheric CO2 was 355 +_ 10 ppm. After jday 229 record was kept of the sample air flow rate and the Licor measurement cell temperature. The sensor sometimes suffered from aspiration of water along the sample tube and from incomplete zeroing due to channeling of air flow when the zero cannister was horizontal. These problems were overcome by maintaining a loop in the intake line and by mounting the zero cannister in a vertical position.
FSSP
The Particle Measurements Systems Forward Scattering Probe, model FSSP-100ER, was operated, calibrated and maintained by OSU. The probe was interfaced with a PMS card in the OSU PC which then forwarded the counts and housekeeping data to ASTER via a serial line to the ADAM. The FSSP segregated the individual counts into 15 channels. The sensor could be operated in two size range modes allowing the aerosol/hydrosol size distribution to be resolved either as 2 - 32 microns or 2 - 47 microns. In addition to the counts in each size range, five house keeping messages were recorded: range, integration time, total strobes, electronic dead-time and valid strobes. ASTER software was then used to calculate other hydrosol moments viz. droplet volume/size distributions.
PVMs
The Particle Volume Monitor is a laser diffraction instrument which continuously determines the extinction of a collimated laser beam over the open 30 cm horizontal path-length orthogonal to the wind direction. With the zero correction derived from measurements made in clean air the extinction resultant from the interposition of hydrosols is proportional to the total volume of the water droplets within the beam volume. A translucent glass disk can be manually interposed in the optical path to yield a calibration signal equivalent to some given droplet volume.
The two PVM were used during CACHE94 to define the vertical water droplet gradient generated by the deposition flux of cloud droplets resulting from the interception of the cloud by the forested slopes. During the CACHE94 deployment the two PVM's were often moved from one location to another to undertake intercomparisons and to compare the PVM measurement against the FSSP measurements. The record of their sucessive movements within the ASTER array is outlined below and is illustrated schematically in Figure 7.
-
- PVMs mounted on Flux Tower, OSU at 10.75 m, GSI at 10m.
- PVMs swapped positions on Flux Tower, OSU at 10 m, GSI at 10.75 m.
- GSI PVM moved up to 15 m on Flux Tower
- OSU PVM moved to 10 m Walk Tower, 1st did change
- GSI PVM moved down to 10 m on Flux Tower, with associated did change
- OSU PVM unmounted from Walk Tower.
- Both PVMs moved to 13 m on Flux Tower (with original dids)
- OSU set to 10m.flux, GSI set to 15 m on Flux Tower
- GSI PVM: unmounted, optics cleaned, remounted at 15m on Flux Tower
- GSI PVM calibration multiplied by 1.33
- OSU PVM: unmounted, optics cleaned, remounted and bagged
- GSI PVM: unmounted, optics cleaned, remounted at 10 m on Flux Tower
PCNC's
The two PCNC's monitored the condensation nuclei concentrations in the ambient air. They use supersaturated Butanol as a condensation medium. The PNCN1 was configued to operate with supersaturation of #% and PNCN2 with a supersaturation of #%. Both sensors were maintained by Dave Covert of the Atmospheric Sciences Department of the University of Washington.
Ozone sensor
The Dasibi ultraviolet absorption sensor was maintained by Dave Covert of the Atmospheric Sciences Department of the University of Washington. A fault in the sensor sometimes caused a sudden offset to develop in the data.
Prop-vanes
The prop-vanes were beset with problems during the CACHE94 deployment. The desire to achieve >1 Hz data rate resulted in a serial communication overload of the already fully dedicated marigold ADAM. Transferring the prop data to the ADAM daisy alleviated this difficulty. Throughout the project the props suffered from the problem of water penetration due to wind driven cloud conditions. Attempts to seal the prop bodies were made but with uneven results. An additional mishap occurred when strong easterly winds caused the hauling line to tangle with the propellers resulting in damage to several of the sensors. Attention must be given to these difficulties when the prop-vane data is used.
Psychrometers
The psychrometers too had a problem with wind driven cloud causing water penetration into their electronics. Throughout the deployment psychrometers needed to be brought down from their mounts to be dried out and sometimes replaced.
Barometers
In general the pressure sensor performed well throughout the deployment.
Radiation sensors
The radiation array needed to be positioned in order to achieve measurements representative of the forested slope of Cheeka Peak. An approximately fifteen meter long trail was cut through the vegetation down the south slope of the ridge. The depth of the vegetation, the height of the canopy above the surface, was approximately three meters. The slope of the surface at the location of the radiation stand was approximately 25° - 30°, necessitating extreme measures in erecting the radiation stand. The top bar of the radiation stand was leveled to within a few degrees and the integrated radiometer array was adjusted to level within one degree of horizontal. The down-looking radiometers were only one meter above the top of the canopy of the Salal bushes. At several meters distance two top spikes of Grand Fir reach above the level of the up-looking radiometers. The effect of this particular deployment of the radiometer array would not have imposed any peculiarity on the value of the down-welling radiation. However for the value of the upwelling radiation there are constraints and the legitimacy of the radiation measurements is questionable.
Pyrgeometers
The down-looking pyrgeometer experienced a loss of power for the compensation circuit when its internal battery failed on jd 234. The battery was replaced on jd 236.
Pyranometers
The pyranometers appeared to have no problems during CACHE94.
Net radiometer
The value of the net radiation appeared to have an especially high value compared to our past experience and we had to adjust the amplifier gain to compensate for this. The high value was rationalized as due the efficient absorption by the dark canopy and canopy holes.
Surface temperature
The Everest infrared temperature sensor was mounted below the radiation stand viewing several square meters of the surface of the organic mulch at an angle of 45°.
Photosynthetically active radiometer, PAR
Three photosynthetically active radiometers were initially deployed at the top of the southern slope near the edge of the canopy. They were each horizontal to within one degree. One was deployed atop a stump with full sky view, and the other two were deployed within the canopy of a Salal bush. On jday 236 the PAR sensors were moved onto and below the radiation stand. Two sensors were mounted on a wooden board that extended ~1 m out from the horizontal beam of the radiation stand. One faced upward, the other downward. The third sensor was placed below the canopy in the vicinity of the radiation stand.
Soil sensors
The surface below the canopy was not well defined. Rather than a simple soil level the surface graded from stems, fallen branches, dead logs, decomposing leaves, duff and finally, after many centimeters of organic material, to mineral soil. Two soil heat flux and temperature arrays were installed in a variant of the conventional manner. This was done in the vicinity of the radiation stand in one area of decomposing leaves and another area of duff (purely organic soil without significant leaf structure). A third set of temperature sensors were installed in dead and living wood: one in the surface of a dead log resting on the surface, the second in the trunk of a six centimeter diameter living tree thirty centimeters from the surface and another in the same tree at ten centimeters from the surface.
The soil temperature probes were connected to the data system via a four channel multiplexer. The multiplexer circuitry failed several times and had to be repaired.
Soil samples
Because the surface and above-surface vegetative cover was so inhomogenous there was no regimen of soil moisture determinations during the CACHE94 deployment. Only a limited number of samples were analyzed for moisture content. From an area alongside the trail samples of organic surface material were taken to the depth of eight or so centimeters. These were then weighed when first taken, were dried at 110°C and were reweighed.
Data
General
The sensors used in CACHE94 are listed in Table 3 and shown schematically in Figure 5 and Figure 6. Each sensor is associated with a system identification number (sid) that is composed of an ADAM name and channel number (e.g. cosmos 202). Channel numbers from 100 - 199 indicate an analog input channel and channel numbers from 200 - 299 indicate a serial input channel. Each sensor has one, and sometimes more, output variables associated with it.The variable names each have a data identification number (did) used to identify the archived data. (e.g. u.prop.5m and v.prop.5m). All data acquired during the deployment is archived. The application of the appropriate calibration and delay functions convert this raw data to engineering or scientific units. This processed data is available as 5 minute block averages of the means, variances and covariances obtained from the initial processing of the variables measured. These block averages are termed ``covars''. The format of the covars is relatively easy to decipher. Thus "conc.co2.10m" is the 5 minute mean of the concentration of CO2 measured using the fast response CO2 sensor at the height of 10 meters, while w:t.walk.10m is the 5 minute mean of the covariance of the vertical air motion measured by the Solent sonic anemometer and the temperature measured by the AIR fast response temperature sensor on the walk-up tower at the height of 10 meters. At the end of each day the raw data is transferred to an Exabyte magnetic tape. To reduce the risk of data loss the data for each day is stored on a separate tape. The raw data is then erased from the on-line hard disk. All covars and other derived products are available as NetCDF.
The available covars are presented in the available plots section of this report.
In April 1995 the five minute products will be recalculated using the currently up-to-date calibration parameters.
Wind
After the array was established, the orientations of the booms of the prop-vanes and the sonic anemometers were determined using a theodolite set to true north by means of solar sighting and an ephemeris. For CACHE94 this procedure proved to be somewhat difficult because of the restricted nature of the ridge-top site.
After optical alignment of the booms the prop-vanes are "set" by manually aligning the vane to the boom using the temporally fixed alignment jig. The prop-vanes are integrated sensors which, after the absolute alignment has been entered, yield wind components in a geographic coordinate system; where u is wind from the west and v is wind from the south. The propvanes are individually calibrated for wind speed response in the SSSF wind tunnel prior to the deployment and yield wind speed directly as a serial output.
The transducer alignment of the sonic anemometers do not accurately correspond to that of the boom. Hence for the sonic anemometers this bearing was used as a nominal value and need to be corrected to the true value by comparing the sonic anemometer and the prop-vane data. The ATI sonic anemometers output the three orthogonal wind components and the derived speed of sound temperature. The Solent sonic anemometer measures three non-orthogonal wind components from which the three orthogonal wind components are calculated. In both cases, the wind components are in an instrument-oriented coordinate system, where u is the wind along the instrument boom towards the tower and v is the wind from right to left as you face in the positive u direction. The sonic anemometer data has been despiked and, for the daily plots, a streamline rotation has been performed.
Psychrometry
The psychrometers are integrated sensors which yield relative humidity and temperature directly as output. From these measured values other moisture parameters can be calculated.The psychrometers are calibrated in the SSSF calibration lab prior to the field program.
Hydrosol data
The cloud droplet information was acquired using the Forward Scattering Spectrometer Probe and the two Particle Volume Measurement devices.
FSSP data
The FSSP data was logged directly to an OSU IBM PC, and fed digitally to ASTER via the Marigold ADAM. Data include the specification of FSSP range (which determined size intervals for droplet counting), the counts for each of fifteen size intervals, the time interval over which the counts accumulated (nominally 0.1 seconds), and three diagnostic variables for determination of data validity. All of these data were logged at 10 Hz.
PVM data
The PVM's output data on the total liquid water content at 10 Hz. The PVMs respond to the volume of cloud-water in the sensor path. Each PVM response must be corrected by a time-varying clear-air signal, which was recorded periodically throughout the experiment.
Carbon dioxide
The carbon dioxide fluxes showed great promise to explain the CO2 exchange of the canopy on the slope around Cheeka Peak. However care must be taken in interpreting the 5 minute covar data since flowrate variations and transients due to zero switching introduce spurious flux artifact values. The data must be detrended and filtered before the final values are to be accepted.
Ozone
The ozone mixing ratio provided substantial information as to the origin of the air arriving at Cheeka Peak. Basically there were three important sources: oceanic air with low ~20 ppbv O3, continental air containing the photolyzed fume from the large scale forest fires which burnt throughout Washington state, and pollution from the Seattle urban area. The situation was complicated by the fact that continental and urban air could move offshore and then return admixed with true oceanic air.
Radiation
The radiation stand bearing the radiation sensors was positioned on the slope south of the Cheeka Peak site. The 3-meter-long horizontal beam of this radiation stand was 1 meter above the canopy, 3 meters above the ground and oriented nominally east-west. The level-adjustable assembly bearing the radiation sensors was mounted on the beam and leveled to within 15'. Five radiation sensors were deployed: a four component radiation array monitoring incoming and outgoing short and long wave radiation with Eppley radiometers, and a REBS Q6 net radiometer. The two long-wave radiometers and the net radiometer output analog voltages. The short-wave radiometers gave similar signals together with thermistor output defining the temperature of the instruments' case and dome. This enabled a correction to be made to compensate for the direct sunlight heating of the dome of the shortwave sensor.
It is important to appreciate that the short-wave radiometers and the net radiometer view a hemisphere with a cosine weighting factor. For the incoming radiation this presents no difficulty if the sensors are horizontally level. For the outgoing radiation it implies that the effective viewing area of the sensors at 3 meters height is only a few tens of square meters. This constraint puts a premium upon the representativeness of the surface under the radiation stand.
The Everest surface temperature sensor has a collimated 30° cone and with the mounting a meter above the surface facing down at 45° viewed a patch of the surface less than ten square meters in area. The sensor yields an output directly in degrees centigrade by using an assumed infrared emissivity of 0.95.
Soil parameters
Two locations near the radiation stand were instrumented with soil temperature and heat flux sensors. These were in areas of duff and of dead leaves. At each location four soil temperature probes were inserted at 1, 3, 5, and 7 cm depth, and a soil heat flux plate was buried at 8 cm. The output of the four soil temperature probes were connected to the data system via a self timing multiplexer. The multiplexer generated an indicator signal to enable the correct assignment of the different outputs. The temperature profile of the soil and the average temperature of the top 8 cm was determined. From the soil heat flux at 8 cm depth together with the heat stored in the top 8 cm of soil the surface heat flux was calculated. As there was an extensive canopy and as the below canopy was so complex this surface heat flux value is difficult to interpret.
Daily plots
A selection of covar plots were produced daily to provide a review of the operations. These are termed "Daily plots."
The daily weather plots presented in the appendix of this report are (a) temperature, humidity, pressure and rainfall, (b) wind speed and direction, (c) net radiation, sensible heat flux, latent heat flux, and surface heat flux, (d) z/L, u* and the Bowen ratio, (e) FSSP and PVM data, mean scaled standard deviations, and deposition velocities.
The plotted data are 5 minute covar plots, except for the turbulent flux data, sensible and latent heat fluxes, z/L, u* and the Bowen ratio, which are 20 minute averages.
The daily plots are presented in the appendix of this report.
Available Plots
Available Covars
N.B. The covars for CACHE94 will be reprocessed at the end of June 1995 incorporating the final data corrections and to include all the FSSP combinations. The covars available are listed in the tables below.
The did's of the available CACHE94 parameters are listed below. The mean values of the "***.walk", "***.seat", "***.flux", prop, psyc, radiation and soil parameters are available in the NetCDF format. For the "**.walk" and "***.flux" parameters the variances and covariances are also available in the NetCDF format.
| u.atik.10m.walk | v.atik.10m.walk | w.atik.10m.walk | tc.atik.10m.walk |
| t.10m.walk | |||
| b1.fssp.10m.walk b2.fssp.10m.walk b3.fssp.10m.walk b4.fssp.10m.walk b5.fssp.10m.walk | b6.fssp.10m.walk b7.fssp.10m.walk b8.fssp.10m.walk b9.fssp.10m.walk b10.fssp.10m.walk | b11.fssp.10m.walk b12.fssp.10m.walk b13.fssp.10m.walk b14.fssp.10m.walk b15.fssp.10m.walk | all.fssp.10m.walk range.fssp.10m.walk |
| c.pvm.10m.walk | |||
| co2.licor.10m.walk | mode.licor.10m.walk | .t.cell.licor.10m.walk | flowrate.licor.10m.walk |
| uflag.atik.10m.walk | vflag.atik.10m.walk | wflag.atik.10m.walk | tcflag.atik.10m.walk |
| alev.atik.10m.walk | blev.atik.10m.walk | ||
| t.remote.2.5m | rh.remote.2.5m | ref.remote.2.5m | |
| u.solent.10m.walk | v.solent.10m.walk | w.solent.10m.walk | tc.solent.10m.walk |
| uflag.solent.10m.walk | vflag.solent.10m.walk | wflag.solent.10m.walk | tcflag.solent.10m.walk |
| u.atik.10m.flux v.atik.10m.flux | w.atik.10m.flux | tc.atik.10m.flux | t.10m.flux |
| h2o.10m.flux | h2o.AA.10m.flux | ||
| c.pvm.10m.flux | |||
| uflag.atik.10m.flux | vflag.atik.10m.flux | wflag.atik.10m.flux | cflag.atik.10m.flux |
| alev.atik.10m.flux | blev.atik.10m.flux | ||
| u.atik.15m.flux v.atik.15m.flux | w.atik.15m.flux | tc.atik.15m.flux | t.15m.flux |
| h2o.15m.flux | |||
| c.pvm.15m.flux | |||
| uflag.atik.15m.flux | vflag.atik.15m.flux | wflag.atik.15m.flux | tcflag.atik.15m.flux |
| alev.atik.15m.flux | blev.atik.15m.flux | ||
| h2o.vais.10m.flux | t.vais.10m.flux | rh.vais.10m.flux | |
| h2o.AIR.10m.flux | t.AIR.10m.flux | rh.AIR.10m.flux | ref.AA.10m.flux |
| h2o.AA.7.5m.flux |
| cpc1.seat | cpc2.seat | |
| o3.seat | ||
| h2o2.seat | ||
| boomdir.seat | ontower.seat | clearsky.seat |
|
rain.seat |
| u.prop.2.5m | v.prop.2.5m | u.prop.5m | v.prop.5m | |
| u.prop.7.5m | v.prop.7.5m | u.prop.10m | v.prop.10m | |
| u.prop.12.5m | v.prop.12.5m | u.prop.15m | v.prop.15m | |
| tdry.psyc.2.5m | rh.psyc.2.5m | tdry.psyc.5m | rh.psyc.5m | |
| tdry.psyc.7.5m | rh.psyc.7.5m | tdry.psyc.10m | rh.psyc.10m | |
| tdry.psyc.12.5m | rh.psyc.12.5m | tdry.psyc.15m | rh.psyc.15m | |
| p.baro.2.5m.psyc |
| psp.in.rad | psp.out.rad | ||
| pyg.in.rad | pyg.in.dome | pyg.in.case | |
| pyg.out.rad | pyg.out.dome | pyg.out.case | |
| net.rad | T.srfc.rad | ||
| sky.par | E.can.par | W.can.par | |
| 1cm.Tsoil.duff | 3cm.Tsoil.duff | 5cm.Tsoil.duff | 7cm.Tsoil.duff |
| G.duff.8cm | |||
| 1cm.Tsoil.leaf | 3cm.Tsoil.leaf | 5cm.Tsoil.leaf | 7cm.Tsoil.leaf |
| G.leaf.8cm | |||
| lodead.Tsoil.tree | hidead.Tsoil.tree | lolive.Tsoil.tree | hilive.Tsoil.tree |
| ORG.700.rain | |||
| T.marigold | T.cosmos | T.daisy |
Daily plots
The daily weather plots presented in the appendix are:
-
- temperature, humidity, pressure and rainfall
- wind speed and direction
- net radiation, sensible heat flux, latent heat flux and surface heat flux
- Z/L and u*
- mean, standard deviation and mean scaled standard deviation cloud water content
The values plotted for temperature, humidity, pressure, rainfall, wind speed and direction, net radiation and surface heat flux and cloud water content parameters are 5 minute averages, while the values plotted for the sensible heat flux, the latent heat flux, Z/L and u* are 20 minute averages.
The plots are listed according to Julian day:
Field Logbook
An electronic logbook was maintained during the field program. A total of 382 entries were made during the CACHE94 deployment in 17 different categories.


