Search
Sample LRT NetCDF Header
netcdf RF02B.19821211.061046_090944 {
dimensions:
Time = 10739 ;
variables:
int Time(Time) ;
Time:long_name = "time of measurement" ;
Time:units = "seconds since 1982-12-11 00:00:00 +0000" ;
Time:strptime_format = "seconds since %F %T %z" ;
Time:standard_name = "time" ;
float TPTIME(Time) ;
TPTIME:long_name = "UNALTERED TAPE TIME (SEC) AFTER MIDNIGHT" ;
TPTIME:units = "s" ;
TPTIME:actual_range = 22246.f, 32984.f ;
TPTIME:SampledRate = 1 ;
TPTIME:_FillValue = -32767.f ;
float TMLAG(Time) ;
TMLAG:long_name = "LTN-51 ARINC TIME LAG (SEC)" ;
TMLAG:units = "s" ;
TMLAG:actual_range = 0.09999847f, 0.1299973f ;
TMLAG:SampledRate = 1 ;
TMLAG:_FillValue = -32767.f ;
float EVMRKS(Time) ;
EVMRKS:long_name = "EVENT MARKER WORD (16-BIT)" ;
EVMRKS:units = "unk" ;
EVMRKS:actual_range = 0.f, 6.f ;
EVMRKS:SampledRate = 1 ;
EVMRKS:_FillValue = -32767.f ;
float EV1(Time) ;
EV1:long_name = "EVENT MARK (MAIN CONTROL PANEL)" ;
EV1:units = "MAIN" ;
EV1:actual_range = 0.f, 6.f ;
EV1:SampledRate = 1 ;
EV1:_FillValue = -32767.f ;
float XMIT(Time) ;
XMIT:long_name = "PILOT MICROPHONE SWITCH (XMIT) (VDC)" ;
XMIT:units = "Vdc" ;
XMIT:actual_range = -1.044998f, 9.939003f ;
XMIT:SampledRate = 1 ;
XMIT:_FillValue = -32767.f ;
float LAT(Time) ;
LAT:long_name = "RAW INS LATITUDE (DEG)" ;
LAT:units = "degree_N" ;
LAT:Category = "Position" ;
LAT:standard_name = "latitude" ;
LAT:valid_range = -90.f, 90.f ;
LAT:actual_range = 42.395f, 43.28999f ;
LAT:SampledRate = 1 ;
LAT:_FillValue = -32767.f ;
float LON(Time) ;
LON:long_name = "RAW INS LONGITUDE (DEG)" ;
LON:units = "degree_E" ;
LON:Category = "Position" ;
LON:standard_name = "longitude" ;
LON:valid_range = -180.f, 180.f ;
LON:actual_range = -71.683f, -70.351f ;
LON:SampledRate = 1 ;
LON:_FillValue = -32767.f ;
float THI(Time) ;
THI:long_name = "AIRCRAFT TRUE HEADING (ARINC) (DEG)" ;
THI:units = "degree" ;
THI:actual_range = 0.6169968f, 359.465f ;
THI:SampledRate = 1 ;
THI:_FillValue = -32767.f ;
float ALPHA(Time) ;
ALPHA:long_name = "INS WANDER ANGLE (DEG)" ;
ALPHA:units = "degree" ;
ALPHA:actual_range = 90.724f, 91.631f ;
ALPHA:SampledRate = 1 ;
ALPHA:_FillValue = -32767.f ;
float XVI(Time) ;
XVI:long_name = "RAW INS GROUND SPD X COMPONENT (M/S)" ;
XVI:units = "m/s" ;
XVI:actual_range = -72.47501f, 129.692f ;
XVI:SampledRate = 1 ;
XVI:_FillValue = -32767.f ;
float YVI(Time) ;
YVI:long_name = "RAW INS GROUND SPD Y COMPONENT (M/S)" ;
YVI:units = "m/s" ;
YVI:actual_range = -87.056f, 95.39099f ;
YVI:SampledRate = 1 ;
YVI:_FillValue = -32767.f ;
float GSF(Time) ;
GSF:long_name = "RAW INS GROUND SPEED (M/S)" ;
GSF:units = "m/s" ;
GSF:actual_range = 25.759f, 132.235f ;
GSF:SampledRate = 1 ;
GSF:_FillValue = -32767.f ;
float PITCH(Time) ;
PITCH:long_name = "AIRCRAFT PITCH ATTITUDE ANGLE (DEG)" ;
PITCH:units = "degree" ;
PITCH:actual_range = -7.893997f, 10.846f ;
PITCH:SampledRate = 1 ;
PITCH:_FillValue = -32767.f ;
float CROLL(Time) ;
CROLL:long_name = "AIRCRAFT COARSE ROLL ANGLE (DEG)" ;
CROLL:units = "degree" ;
CROLL:actual_range = 0.0009994507f, 359.999f ;
CROLL:SampledRate = 1 ;
CROLL:_FillValue = -32767.f ;
float ROLL(Time) ;
ROLL:long_name = "AIRCRAFT ROLL ATTITUDE ANGLE (DEG)" ;
ROLL:units = "degree" ;
ROLL:actual_range = -27.33f, 30.008f ;
ROLL:SampledRate = 1 ;
ROLL:_FillValue = -32767.f ;
float THF(Time) ;
THF:long_name = "AIRCRAFT TRUE HEADING (YAW) (DEG)" ;
THF:units = "degree" ;
THF:actual_range = 0.1080017f, 359.671f ;
THF:SampledRate = 1 ;
THF:_FillValue = -32767.f ;
float VZI(Time) ;
VZI:long_name = "RAW INS VERTICAL VELOCITY (M/S)" ;
VZI:units = "m/s" ;
VZI:actual_range = -19.60501f, 22.07202f ;
VZI:SampledRate = 1 ;
VZI:_FillValue = -32767.f ;
float QCW(Time) ;
QCW:long_name = "RAW DYNAMIC PRESSURE (WING) (MB)" ;
QCW:units = "hPa" ;
QCW:actual_range = 4.281998f, 46.806f ;
QCW:SampledRate = 1 ;
QCW:_FillValue = -32767.f ;
float QCB(Time) ;
QCB:long_name = "RAW DYNAMIC PRESSURE (GUST PROBE)(MB)" ;
QCB:units = "hPa" ;
QCB:actual_range = 4.445999f, 44.87199f ;
QCB:SampledRate = 1 ;
QCB:_FillValue = -32767.f ;
float QCWC(Time) ;
QCWC:long_name = "CORRECTED DYNAMIC PRESR (WING) (MB)" ;
QCWC:units = "hPa" ;
QCWC:actual_range = 4.281998f, 47.05901f ;
QCWC:SampledRate = 1 ;
QCWC:_FillValue = -32767.f ;
float QCBC(Time) ;
QCBC:long_name = "CORRECTED DYNAMIC PRESR (GUST PROBE)(MB)" ;
QCBC:units = "hPa" ;
QCBC:actual_range = 4.445999f, 48.907f ;
QCBC:SampledRate = 1 ;
QCBC:_FillValue = -32767.f ;
float PSF(Time) ;
PSF:long_name = "RAW STATIC PRESSURE (FUSELAGE) (MB)" ;
PSF:units = "hPa" ;
PSF:actual_range = 548.309f, 1012.47f ;
PSF:SampledRate = 1 ;
PSF:_FillValue = -32767.f ;
float PSB(Time) ;
PSB:long_name = "RAW STATIC PRESSURE (BOOM) (MB)" ;
PSB:units = "hPa" ;
PSB:actual_range = 548.883f, 1013.104f ;
PSB:SampledRate = 1 ;
PSB:_FillValue = -32767.f ;
float PSFC(Time) ;
PSFC:long_name = "CORRECTED STATIC PRESR (FUSELAGE) (MB)" ;
PSFC:units = "hPa" ;
PSFC:actual_range = 547.392f, 1011.996f ;
PSFC:SampledRate = 1 ;
PSFC:_FillValue = -32767.f ;
float PSBC(Time) ;
PSBC:long_name = "CORRECTED STATIC PRESSURE (BOOM) (MB)" ;
PSBC:units = "hPa" ;
PSBC:actual_range = 547.342f, 1013.104f ;
PSBC:SampledRate = 1 ;
PSBC:_FillValue = -32767.f ;
float HP(Time) ;
HP:long_name = "NACA PRESSURE ALTITUDE (M)" ;
HP:units = "m" ;
HP:actual_range = 1.200012f, 4899.5f ;
HP:SampledRate = 1 ;
HP:_FillValue = -32767.f ;
float HGM(Time) ;
HGM:long_name = "GEOMETRIC (RADIO) ALTITUDE (M)" ;
HGM:units = "m" ;
HGM:actual_range = 1.442001f, 764.799f ;
HGM:SampledRate = 1 ;
HGM:_FillValue = -32767.f ;
float TTBH(Time) ;
TTBH:long_name = "TOTAL TEMPERATURE (DEICED ROSEMOUNT) (C)" ;
TTBH:units = "deg_C" ;
TTBH:actual_range = -14.363f, 0.9499969f ;
TTBH:SampledRate = 1 ;
TTBH:_FillValue = -32767.f ;
float TTRF(Time) ;
TTRF:long_name = "TOTAL TEMPERATURE (REVERSE FLOW) (C)" ;
TTRF:units = "deg_C" ;
TTRF:actual_range = -15.184f, -0.2969971f ;
TTRF:SampledRate = 1 ;
TTRF:_FillValue = -32767.f ;
float ATBH(Time) ;
ATBH:long_name = "AMBIENT TEMP. (DEICED ROSEMOUNT)(C)" ;
ATBH:units = "deg_C" ;
ATBH:actual_range = -17.077f, -1.108002f ;
ATBH:SampledRate = 1 ;
ATBH:_FillValue = -32767.f ;
float ATRF(Time) ;
ATRF:long_name = "AMBIENT TEMPERATURE (REVERSE FLOW) (C)" ;
ATRF:units = "deg_C" ;
ATRF:actual_range = -17.267f, -1.495003f ;
ATRF:SampledRate = 1 ;
ATRF:_FillValue = -32767.f ;
float DPRB(Time) ;
DPRB:long_name = "DEW/FROST POINT TEMP ( E-G+G)(RT-BOT)(C)" ;
DPRB:units = "deg_C" ;
DPRB:actual_range = -16.039f, -2.271004f ;
DPRB:SampledRate = 1 ;
DPRB:_FillValue = -32767.f ;
float DPRT(Time) ;
DPRT:long_name = "DEW/FROST POINT TEMP( E- G+G)(RT-TOP)(C)" ;
DPRT:units = "deg_C" ;
DPRT:actual_range = -17.452f, -2.087997f ;
DPRT:SampledRate = 1 ;
DPRT:_FillValue = -32767.f ;
float DPRBC(Time) ;
DPRBC:long_name = "DEWPOINT TEMPERATURE ( E-G+G)(RT-BOT)(C)" ;
DPRBC:units = "deg_C" ;
DPRBC:actual_range = -17.913f, -2.561996f ;
DPRBC:SampledRate = 1 ;
DPRBC:_FillValue = -32767.f ;
float DPRTC(Time) ;
DPRTC:long_name = "DEWPOINT TEMPERATURE(E- G+G )(RT-TOP)(C)" ;
DPRTC:units = "deg_C" ;
DPRTC:actual_range = -19.466f, -2.353996f ;
DPRTC:SampledRate = 1 ;
DPRTC:_FillValue = -32767.f ;
float RHOTDB(Time) ;
RHOTDB:long_name = "ABSOLUTE HUMIDITY ( E-G+G)(RT-BOT)(G/M3)" ;
RHOTDB:units = "gram/m3" ;
RHOTDB:actual_range = 1.221001f, 4.047997f ;
RHOTDB:SampledRate = 1 ;
RHOTDB:_FillValue = -32767.f ;
float RHOTDT(Time) ;
RHOTDT:long_name = "ABSOLUTE HUMIDITY( E- G+G)(RT-TOP)(G/M3)" ;
RHOTDT:units = "gram/m3" ;
RHOTDT:actual_range = 1.110001f, 4.095001f ;
RHOTDT:SampledRate = 1 ;
RHOTDT:_FillValue = -32767.f ;
float TASW(Time) ;
TASW:long_name = "AIRCRAFT TRUE AIRSPEED (WING) (M/S)" ;
TASW:units = "m/s" ;
TASW:actual_range = 0.f, 95.903f ;
TASW:SampledRate = 1 ;
TASW:_FillValue = -32767.f ;
float TASB(Time) ;
TASB:long_name = "AIRCRAFT TRUE AIRSPEED (BOOM) (M/S)" ;
TASB:units = "m/s" ;
TASB:actual_range = 0.f, 96.17599f ;
TASB:SampledRate = 1 ;
TASB:_FillValue = -32767.f ;
float LWC(Time) ;
LWC:long_name = "RAW J-W LIQUID WATER CONTENT (G/M3)" ;
LWC:units = "gram/m3" ;
LWC:actual_range = -0.4990005f, 0.05200195f ;
LWC:SampledRate = 1 ;
LWC:_FillValue = -32767.f ;
float LWCC(Time) ;
LWCC:long_name = "CORRCTD J-W LIQUID WATER CONTENT (G/M3)" ;
LWCC:units = "gram/m3" ;
LWCC:actual_range = -0.8779984f, 0.05899811f ;
LWCC:SampledRate = 1 ;
LWCC:_FillValue = -32767.f ;
float ADIF(Time) ;
ADIF:long_name = "VERTICAL DIFF. PRESR (GUST PROBE) (MB)" ;
ADIF:units = "hPa" ;
ADIF:actual_range = -0.2919998f, 9.778f ;
ADIF:SampledRate = 1 ;
ADIF:_FillValue = -32767.f ;
float ATTACK(Time) ;
ATTACK:long_name = "ATTACK ANGLE (ROSEMOUNT) (DEG)" ;
ATTACK:units = "degree" ;
ATTACK:actual_range = -1.728996f, 4.542f ;
ATTACK:SampledRate = 1 ;
ATTACK:_FillValue = -32767.f ;
float BDIF(Time) ;
BDIF:long_name = "HORIZONTAL DIFF. PRESR (GUST PROBE) (MB)" ;
BDIF:units = "hPa" ;
BDIF:actual_range = -5.570999f, 8.425003f ;
BDIF:SampledRate = 1 ;
BDIF:_FillValue = -32767.f ;
float SSLIP(Time) ;
SSLIP:long_name = "SIDESLIP ANGLE (ROSEMOUNT) (DEG)" ;
SSLIP:units = "degree" ;
SSLIP:actual_range = -2.288002f, 3.752998f ;
SSLIP:SampledRate = 1 ;
SSLIP:_FillValue = -32767.f ;
float RICE(Time) ;
RICE:long_name = "ICING RATE DETECTOR (RAW) (VDC)" ;
RICE:units = "Vdc" ;
RICE:actual_range = 1.107002f, 6.550003f ;
RICE:SampledRate = 1 ;
RICE:_FillValue = -32767.f ;
float CRICE(Time) ;
CRICE:long_name = "ICING RATE DETECTOR (CORRECTED) (G/M3)" ;
CRICE:units = "gram/m3" ;
CRICE:actual_range = 0.f, 5.327003f ;
CRICE:SampledRate = 1 ;
CRICE:_FillValue = -32767.f ;
float UI(Time) ;
UI:long_name = "WIND VECTOR EAST GUST COMPONENT (M/S)" ;
UI:units = "m/s" ;
UI:actual_range = 0.f, 40.636f ;
UI:SampledRate = 1 ;
UI:_FillValue = -32767.f ;
float VI(Time) ;
VI:long_name = "WIND VECTOR NORTH GUST COMPONENT (M/S)" ;
VI:units = "m/s" ;
VI:actual_range = -5.123001f, 19.388f ;
VI:SampledRate = 1 ;
VI:_FillValue = -32767.f ;
float WI(Time) ;
WI:long_name = "WIND VECTOR VERTICAL GUST COMP (M/S)" ;
WI:units = "m/s" ;
WI:actual_range = -1.232002f, 0.8649979f ;
WI:SampledRate = 1 ;
WI:_FillValue = -32767.f ;
float UX(Time) ;
UX:long_name = "WIND VECTOR LNGTDNL GUST COMPONENT (M/S)" ;
UX:units = "m/s" ;
UX:actual_range = -42.899f, 42.806f ;
UX:SampledRate = 1 ;
UX:_FillValue = -32767.f ;
float VY(Time) ;
VY:long_name = "WIND VECTOR LATERAL GUST COMPONENT (M/S)" ;
VY:units = "m/s" ;
VY:actual_range = -43.304f, 32.877f ;
VY:SampledRate = 1 ;
VY:_FillValue = -32767.f ;
float WDRCTN(Time) ;
WDRCTN:long_name = "HORIZONTAL WIND DIRECTION (BOOM) (DEG)" ;
WDRCTN:units = "degree" ;
WDRCTN:actual_range = 211.027f, 360.f ;
WDRCTN:SampledRate = 1 ;
WDRCTN:_FillValue = -32767.f ;
float WSPD(Time) ;
WSPD:long_name = "HORIZONTAL WIND SPEED (BOOM) (M/S)" ;
WSPD:units = "m/s" ;
WSPD:actual_range = 0.f, 44.30299f ;
WSPD:SampledRate = 1 ;
WSPD:_FillValue = -32767.f ;
float VEW(Time) ;
VEW:long_name = "RAW INS GROUND SPD EAST COMP (M/S)" ;
VEW:units = "m/s" ;
VEW:actual_range = -72.84399f, 129.986f ;
VEW:SampledRate = 1 ;
VEW:_FillValue = -32767.f ;
float VNS(Time) ;
VNS:long_name = "RAW INS GROUND SPD NORTH COMP (M/S)" ;
VNS:units = "m/s" ;
VNS:actual_range = -87.42999f, 94.87799f ;
VNS:SampledRate = 1 ;
VNS:_FillValue = -32767.f ;
float DEMIT(Time) ;
DEMIT:long_name = "DISTANCE EAST OF MIT RADAR (KM)" ;
DEMIT:units = "km" ;
DEMIT:actual_range = -47.46997f, 61.06995f ;
DEMIT:SampledRate = 1 ;
DEMIT:_FillValue = -32767.f ;
float DNMIT(Time) ;
DNMIT:long_name = "DISTANCE NORTH OF MIT RADAR (KM)" ;
DNMIT:units = "km" ;
DNMIT:actual_range = 3.130005f, 102.67f ;
DNMIT:SampledRate = 1 ;
DNMIT:_FillValue = -32767.f ;
float CGAC(Time) ;
CGAC:long_name = "AIRCRAFT C.G. ACCELERATION (M/S2)" ;
CGAC:units = "m/s2" ;
CGAC:actual_range = -3.303001f, 3.779999f ;
CGAC:SampledRate = 1 ;
CGAC:_FillValue = -32767.f ;
float WP3(Time) ;
WP3:long_name = "DAMPED AIRCRAFT VERT VELOCITY (M/S)" ;
WP3:units = "m/s" ;
WP3:actual_range = -10.41f, 11.645f ;
WP3:SampledRate = 1 ;
WP3:_FillValue = -32767.f ;
float HI3(Time) ;
HI3:long_name = "PRESSURE-DAMPED INERTIAL ALTITUDE (M)" ;
HI3:units = "m" ;
HI3:actual_range = 0.2999878f, 4899.5f ;
HI3:SampledRate = 1 ;
HI3:_FillValue = -32767.f ;
float RHUM(Time) ;
RHUM:long_name = "RELATIVE HUMIDITY (PER CENT)" ;
RHUM:units = "%" ;
RHUM:actual_range = 41.164f, 105.616f ;
RHUM:SampledRate = 1 ;
RHUM:_FillValue = -32767.f ;
float RM(Time) ;
RM:long_name = "WATER VAPOR MIXING RATIO (G/KG)" ;
RM:units = "g/kg" ;
RM:actual_range = 1.150002f, 3.236f ;
RM:SampledRate = 1 ;
RM:_FillValue = -32767.f ;
float ETHETA(Time) ;
ETHETA:long_name = "EQUIVALENT POTENTIAL TEMPERATURE (K)" ;
ETHETA:units = "deg_K" ;
ETHETA:actual_range = 277.02f, 310.876f ;
ETHETA:SampledRate = 1 ;
ETHETA:_FillValue = -32767.f ;
float THETA(Time) ;
THETA:long_name = "POTENTIAL TEMPERATURE (K)" ;
THETA:units = "deg_K" ;
THETA:actual_range = 268.814f, 304.934f ;
THETA:SampledRate = 1 ;
THETA:_FillValue = -32767.f ;
float VTHETA(Time) ;
VTHETA:long_name = "VIRTUAL POTENTIAL TEMPERATURE (K)" ;
VTHETA:units = "deg_K" ;
VTHETA:actual_range = 269.32f, 305.28f ;
VTHETA:SampledRate = 1 ;
VTHETA:_FillValue = -32767.f ;
float SPARE(Time) ;
SPARE:long_name = "SPARE CHANNEL 18 (VDC)" ;
SPARE:units = "Vdc" ;
SPARE:actual_range = -0.01300049f, -0.004997253f ;
SPARE:SampledRate = 1 ;
SPARE:_FillValue = -32767.f ;
float IRNG(Time) ;
IRNG:long_name = "FSSP RANGE" ;
IRNG:units = "RANGE" ;
IRNG:actual_range = 1.f, 1.f ;
IRNG:SampledRate = 1 ;
IRNG:_FillValue = -32767.f ;
float IRESET(Time) ;
IRESET:long_name = "FSSP FAST RESETS" ;
IRESET:units = "RESET" ;
IRESET:actual_range = 0.f, 1973.f ;
IRESET:SampledRate = 1 ;
IRESET:_FillValue = -32767.f ;
float ISTROB(Time) ;
ISTROB:long_name = "FSSP TOTAL STROBES" ;
ISTROB:units = "STROBE" ;
ISTROB:actual_range = 0.f, 337.f ;
ISTROB:SampledRate = 1 ;
ISTROB:_FillValue = -32767.f ;
float SUM1_1(Time) ;
SUM1_1:long_name = "PROBE 1/CELL 1 ACCUMULATION(COUNTS)" ;
SUM1_1:units = "COUNTS" ;
SUM1_1:actual_range = 0.f, 360.f ;
SUM1_1:SampledRate = 1 ;
SUM1_1:_FillValue = -32767.f ;
float SUM1_2(Time) ;
SUM1_2:long_name = "PROBE 1/CELL 2 ACCUMULATION(COUNTS)" ;
SUM1_2:units = "COUNTS" ;
SUM1_2:actual_range = 0.f, 1433.f ;
SUM1_2:SampledRate = 1 ;
SUM1_2:_FillValue = -32767.f ;
float SUM1_3(Time) ;
SUM1_3:long_name = "PROBE 1/CELL 3 ACCUMULATION(COUNTS)" ;
SUM1_3:units = "COUNTS" ;
SUM1_3:actual_range = 0.f, 931.f ;
SUM1_3:SampledRate = 1 ;
SUM1_3:_FillValue = -32767.f ;
float SUM1_4(Time) ;
SUM1_4:long_name = "PROBE 1/CELL 4 ACCUMULATION(COUNTS)" ;
SUM1_4:units = "COUNTS" ;
SUM1_4:actual_range = 0.f, 797.f ;
SUM1_4:SampledRate = 1 ;
SUM1_4:_FillValue = -32767.f ;
float SUM1_5(Time) ;
SUM1_5:long_name = "PROBE 1/CELL 5 ACCUMULATION(COUNTS)" ;
SUM1_5:units = "COUNTS" ;
SUM1_5:actual_range = 0.f, 645.f ;
SUM1_5:SampledRate = 1 ;
SUM1_5:_FillValue = -32767.f ;
float SUM1_6(Time) ;
SUM1_6:long_name = "PROBE 1/CELL 6 ACCUMULATION(COUNTS)" ;
SUM1_6:units = "COUNTS" ;
SUM1_6:actual_range = 0.f, 206.f ;
SUM1_6:SampledRate = 1 ;
SUM1_6:_FillValue = -32767.f ;
float SUM1_7(Time) ;
SUM1_7:long_name = "PROBE 1/CELL 7 ACCUMULATION(COUNTS)" ;
SUM1_7:units = "COUNTS" ;
SUM1_7:actual_range = 0.f, 108.f ;
SUM1_7:SampledRate = 1 ;
SUM1_7:_FillValue = -32767.f ;
float SUM1_8(Time) ;
SUM1_8:long_name = "PROBE 1/CELL 8 ACCUMULATION(COUNTS)" ;
SUM1_8:units = "COUNTS" ;
SUM1_8:actual_range = 0.f, 41.f ;
SUM1_8:SampledRate = 1 ;
SUM1_8:_FillValue = -32767.f ;
float SUM1_9(Time) ;
SUM1_9:long_name = "PROBE 1/CELL 9 ACCUMULATION(COUNTS)" ;
SUM1_9:units = "COUNTS" ;
SUM1_9:actual_range = 0.f, 21.f ;
SUM1_9:SampledRate = 1 ;
SUM1_9:_FillValue = -32767.f ;
float SUM1_10(Time) ;
SUM1_10:long_name = "PROBE 1/CELL10 ACCUMULATION(COUNTS)" ;
SUM1_10:units = "COUNTS" ;
SUM1_10:actual_range = 0.f, 17.f ;
SUM1_10:SampledRate = 1 ;
SUM1_10:_FillValue = -32767.f ;
float SUM1_11(Time) ;
SUM1_11:long_name = "PROBE 1/CELL11 ACCUMULATION(COUNTS)" ;
SUM1_11:units = "COUNTS" ;
SUM1_11:actual_range = 0.f, 15.f ;
SUM1_11:SampledRate = 1 ;
SUM1_11:_FillValue = -32767.f ;
float SUM1_12(Time) ;
SUM1_12:long_name = "PROBE 1/CELL12 ACCUMULATION(COUNTS)" ;
SUM1_12:units = "COUNTS" ;
SUM1_12:actual_range = 0.f, 10.f ;
SUM1_12:SampledRate = 1 ;
SUM1_12:_FillValue = -32767.f ;
float SUM1_13(Time) ;
SUM1_13:long_name = "PROBE 1/CELL13 ACCUMULATION(COUNTS)" ;
SUM1_13:units = "COUNTS" ;
SUM1_13:actual_range = 0.f, 9.f ;
SUM1_13:SampledRate = 1 ;
SUM1_13:_FillValue = -32767.f ;
float SUM1_14(Time) ;
SUM1_14:long_name = "PROBE 1/CELL14 ACCUMULATION(COUNTS)" ;
SUM1_14:units = "COUNTS" ;
SUM1_14:actual_range = 0.f, 7.f ;
SUM1_14:SampledRate = 1 ;
SUM1_14:_FillValue = -32767.f ;
float SUM1_15(Time) ;
SUM1_15:long_name = "PROBE 1/CELL15 ACCUMULATION(COUNTS)" ;
SUM1_15:units = "COUNTS" ;
SUM1_15:actual_range = 0.f, 6.f ;
SUM1_15:SampledRate = 1 ;
SUM1_15:_FillValue = -32767.f ;
float SUM15(Time) ;
SUM15:long_name = "FSSP TOTAL COUNTS" ;
SUM15:units = "unk" ;
SUM15:actual_range = 0.f, 1611.f ;
SUM15:SampledRate = 1 ;
SUM15:_FillValue = -32767.f ;
float BMFRAC(Time) ;
BMFRAC:long_name = "FSSP BEAM FRACTION" ;
BMFRAC:units = "unk" ;
BMFRAC:actual_range = 0.f, 1.6f ;
BMFRAC:SampledRate = 1 ;
BMFRAC:_FillValue = -32767.f ;
float FACTIV(Time) ;
FACTIV:long_name = "FSSP ACTIVITY" ;
FACTIV:units = "unk" ;
FACTIV:actual_range = 0.02f, 0.115f ;
FACTIV:SampledRate = 1 ;
FACTIV:_FillValue = -32767.f ;
float FCN_01(Time) ;
FCN_01:long_name = "PROBE 1/CELL 1 CONCENTRATION (CTS/CC)" ;
FCN_01:units = "1/cm3" ;
FCN_01:actual_range = 0.f, 23.43f ;
FCN_01:SampledRate = 1 ;
FCN_01:_FillValue = -32767.f ;
float FCN_02(Time) ;
FCN_02:long_name = "PROBE 1/CELL 2 CONCENTRATION (CTS/CC)" ;
FCN_02:units = "1/cm3" ;
FCN_02:actual_range = 0.f, 83.568f ;
FCN_02:SampledRate = 1 ;
FCN_02:_FillValue = -32767.f ;
float FCN_03(Time) ;
FCN_03:long_name = "PROBE 1/CELL 3 CONCENTRATION (CTS/CC)" ;
FCN_03:units = "1/cm3" ;
FCN_03:actual_range = 0.f, 59.564f ;
FCN_03:SampledRate = 1 ;
FCN_03:_FillValue = -32767.f ;
float FCN_04(Time) ;
FCN_04:long_name = "PROBE 1/CELL 4 CONCENTRATION (CTS/CC)" ;
FCN_04:units = "1/cm3" ;
FCN_04:actual_range = 0.f, 42.35f ;
FCN_04:SampledRate = 1 ;
FCN_04:_FillValue = -32767.f ;
float FCN_05(Time) ;
FCN_05:long_name = "PROBE 1/CELL 5 CONCENTRATION (CTS/CC)" ;
FCN_05:units = "1/cm3" ;
FCN_05:actual_range = 0.f, 34.802f ;
FCN_05:SampledRate = 1 ;
FCN_05:_FillValue = -32767.f ;
float FCN_06(Time) ;
FCN_06:long_name = "PROBE 1/CELL 6 CONCENTRATION (CTS/CC)" ;
FCN_06:units = "1/cm3" ;
FCN_06:actual_range = 0.f, 23.19f ;
FCN_06:SampledRate = 1 ;
FCN_06:_FillValue = -32767.f ;
float FCN_07(Time) ;
FCN_07:long_name = "PROBE 1/CELL 7 CONCENTRATION (CTS/CC)" ;
FCN_07:units = "1/cm3" ;
FCN_07:actual_range = 0.f, 23.666f ;
FCN_07:SampledRate = 1 ;
FCN_07:_FillValue = -32767.f ;
float FCN_08(Time) ;
FCN_08:long_name = "PROBE 1/CELL 8 CONCENTRATION (CTS/CC)" ;
FCN_08:units = "1/cm3" ;
FCN_08:actual_range = 0.f, 24.154f ;
FCN_08:SampledRate = 1 ;
FCN_08:_FillValue = -32767.f ;
float FCN_09(Time) ;
FCN_09:long_name = "PROBE 1/CELL 9 CONCENTRATION (CTS/CC)" ;
FCN_09:units = "1/cm3" ;
FCN_09:actual_range = 0.f, 24.65f ;
FCN_09:SampledRate = 1 ;
FCN_09:_FillValue = -32767.f ;
float FCN_10(Time) ;
FCN_10:long_name = "PROBE 1/CELL10 CONCENTRATION (CTS/CC)" ;
FCN_10:units = "1/cm3" ;
FCN_10:actual_range = 0.f, 25.156f ;
FCN_10:SampledRate = 1 ;
FCN_10:_FillValue = -32767.f ;
float FCN_11(Time) ;
FCN_11:long_name = "PROBE 1/CELL11 CONCENTRATION (CTS/CC)" ;
FCN_11:units = "1/cm3" ;
FCN_11:actual_range = 0.f, 25.674f ;
FCN_11:SampledRate = 1 ;
FCN_11:_FillValue = -32767.f ;
float FCN_12(Time) ;
FCN_12:long_name = "PROBE 1/CELL12 CONCENTRATION (CTS/CC)" ;
FCN_12:units = "1/cm3" ;
FCN_12:actual_range = 0.f, 26.202f ;
FCN_12:SampledRate = 1 ;
FCN_12:_FillValue = -32767.f ;
float FCN_13(Time) ;
FCN_13:long_name = "PROBE 1/CELL13 CONCENTRATION (CTS/CC)" ;
FCN_13:units = "1/cm3" ;
FCN_13:actual_range = 0.f, 26.74f ;
FCN_13:SampledRate = 1 ;
FCN_13:_FillValue = -32767.f ;
float FCN_14(Time) ;
FCN_14:long_name = "PROBE 1/CELL14 CONCENTRATION (CTS/CC)" ;
FCN_14:units = "1/cm3" ;
FCN_14:actual_range = 0.f, 27.29f ;
FCN_14:SampledRate = 1 ;
FCN_14:_FillValue = -32767.f ;
float FCN_15(Time) ;
FCN_15:long_name = "PROBE 1/CELL15 CONCENTRATION (CTS/CC)" ;
FCN_15:units = "1/cm3" ;
FCN_15:actual_range = 0.f, 27.85f ;
FCN_15:SampledRate = 1 ;
FCN_15:_FillValue = -32767.f ;
float \200Y2(Time) ;
\200Y2:long_name = "AOP 200Y PROBE" ;
\200Y2:units = "PROBE" ;
\200Y2:actual_range = 0.f, 0.f ;
\200Y2:SampledRate = 1 ;
\200Y2:_FillValue = -32767.f ;
float SUM2_1(Time) ;
SUM2_1:long_name = "PROBE 2/CELL 1 ACCUMULATION(COUNTS)" ;
SUM2_1:units = "COUNTS" ;
SUM2_1:actual_range = 0.f, 62.f ;
SUM2_1:SampledRate = 1 ;
SUM2_1:_FillValue = -32767.f ;
float SUM2_2(Time) ;
SUM2_2:long_name = "PROBE 2/CELL 2 ACCUMULATION(COUNTS)" ;
SUM2_2:units = "COUNTS" ;
SUM2_2:actual_range = 0.f, 112.f ;
SUM2_2:SampledRate = 1 ;
SUM2_2:_FillValue = -32767.f ;
float SUM2_3(Time) ;
SUM2_3:long_name = "PROBE 2/CELL 3 ACCUMULATION(COUNTS)" ;
SUM2_3:units = "COUNTS" ;
SUM2_3:actual_range = 0.f, 143.f ;
SUM2_3:SampledRate = 1 ;
SUM2_3:_FillValue = -32767.f ;
float SUM2_4(Time) ;
SUM2_4:long_name = "PROBE 2/CELL 4 ACCUMULATION(COUNTS)" ;
SUM2_4:units = "COUNTS" ;
SUM2_4:actual_range = 0.f, 95.f ;
SUM2_4:SampledRate = 1 ;
SUM2_4:_FillValue = -32767.f ;
float SUM2_5(Time) ;
SUM2_5:long_name = "PROBE 2/CELL 5 ACCUMULATION(COUNTS)" ;
SUM2_5:units = "COUNTS" ;
SUM2_5:actual_range = 0.f, 58.f ;
SUM2_5:SampledRate = 1 ;
SUM2_5:_FillValue = -32767.f ;
float SUM2_6(Time) ;
SUM2_6:long_name = "PROBE 2/CELL 6 ACCUMULATION(COUNTS)" ;
SUM2_6:units = "COUNTS" ;
SUM2_6:actual_range = 0.f, 32.f ;
SUM2_6:SampledRate = 1 ;
SUM2_6:_FillValue = -32767.f ;
float SUM2_7(Time) ;
SUM2_7:long_name = "PROBE 2/CELL 7 ACCUMULATION(COUNTS)" ;
SUM2_7:units = "COUNTS" ;
SUM2_7:actual_range = 0.f, 28.f ;
SUM2_7:SampledRate = 1 ;
SUM2_7:_FillValue = -32767.f ;
float SUM2_8(Time) ;
SUM2_8:long_name = "PROBE 2/CELL 8 ACCUMULATION(COUNTS)" ;
SUM2_8:units = "COUNTS" ;
SUM2_8:actual_range = 0.f, 22.f ;
SUM2_8:SampledRate = 1 ;
SUM2_8:_FillValue = -32767.f ;
float SUM2_9(Time) ;
SUM2_9:long_name = "PROBE 2/CELL 9 ACCUMULATION(COUNTS)" ;
SUM2_9:units = "COUNTS" ;
SUM2_9:actual_range = 0.f, 15.f ;
SUM2_9:SampledRate = 1 ;
SUM2_9:_FillValue = -32767.f ;
float SUM2_10(Time) ;
SUM2_10:long_name = "PROBE 2/CELL10 ACCUMULATION(COUNTS)" ;
SUM2_10:units = "COUNTS" ;
SUM2_10:actual_range = 0.f, 12.f ;
SUM2_10:SampledRate = 1 ;
SUM2_10:_FillValue = -32767.f ;
float SUM2_11(Time) ;
SUM2_11:long_name = "PROBE 2/CELL11 ACCUMULATION(COUNTS)" ;
SUM2_11:units = "COUNTS" ;
SUM2_11:actual_range = 0.f, 8.f ;
SUM2_11:SampledRate = 1 ;
SUM2_11:_FillValue = -32767.f ;
float SUM2_12(Time) ;
SUM2_12:long_name = "PROBE 2/CELL12 ACCUMULATION(COUNTS)" ;
SUM2_12:units = "COUNTS" ;
SUM2_12:actual_range = 0.f, 7.f ;
SUM2_12:SampledRate = 1 ;
SUM2_12:_FillValue = -32767.f ;
float SUM2_13(Time) ;
SUM2_13:long_name = "PROBE 2/CELL13 ACCUMULATION(COUNTS)" ;
SUM2_13:units = "COUNTS" ;
SUM2_13:actual_range = 0.f, 5.f ;
SUM2_13:SampledRate = 1 ;
SUM2_13:_FillValue = -32767.f ;
float SUM2_14(Time) ;
SUM2_14:long_name = "PROBE 2/CELL14 ACCUMULATION(COUNTS)" ;
SUM2_14:units = "COUNTS" ;
SUM2_14:actual_range = 0.f, 5.f ;
SUM2_14:SampledRate = 1 ;
SUM2_14:_FillValue = -32767.f ;
float SUM2_15(Time) ;
SUM2_15:long_name = "PROBE 2/CELL15 ACCUMULATION(COUNTS)" ;
SUM2_15:units = "COUNTS" ;
SUM2_15:actual_range = 0.f, 4.f ;
SUM2_15:SampledRate = 1 ;
SUM2_15:_FillValue = -32767.f ;
float YCN_01(Time) ;
YCN_01:long_name = "PROBE 2/CELL 1 CONCENTRATION (CTS/LITER)" ;
YCN_01:units = "N/LTR" ;
YCN_01:actual_range = NaNf, Infinityf ;
YCN_01:SampledRate = 1 ;
YCN_01:_FillValue = -32767.f ;
float YCN_02(Time) ;
YCN_02:long_name = "PROBE 2/CELL 2 CONCENTRATION (CTS/LITER)" ;
YCN_02:units = "N/LTR" ;
YCN_02:actual_range = NaNf, Infinityf ;
YCN_02:SampledRate = 1 ;
YCN_02:_FillValue = -32767.f ;
float YCN_03(Time) ;
YCN_03:long_name = "PROBE 2/CELL 3 CONCENTRATION (CTS/LITER)" ;
YCN_03:units = "N/LTR" ;
YCN_03:actual_range = NaNf, Infinityf ;
YCN_03:SampledRate = 1 ;
YCN_03:_FillValue = -32767.f ;
float YCN_04(Time) ;
YCN_04:long_name = "PROBE 2/CELL 4 CONCENTRATION (CTS/LITER)" ;
YCN_04:units = "N/LTR" ;
YCN_04:actual_range = NaNf, Infinityf ;
YCN_04:SampledRate = 1 ;
YCN_04:_FillValue = -32767.f ;
float YCN_05(Time) ;
YCN_05:long_name = "PROBE 2/CELL 5 CONCENTRATION (CTS/LITER)" ;
YCN_05:units = "N/LTR" ;
YCN_05:actual_range = NaNf, Infinityf ;
YCN_05:SampledRate = 1 ;
YCN_05:_FillValue = -32767.f ;
float YCN_06(Time) ;
YCN_06:long_name = "PROBE 2/CELL 6 CONCENTRATION (CTS/LITER)" ;
YCN_06:units = "N/LTR" ;
YCN_06:actual_range = NaNf, Infinityf ;
YCN_06:SampledRate = 1 ;
YCN_06:_FillValue = -32767.f ;
float YCN_07(Time) ;
YCN_07:long_name = "PROBE 2/CELL 7 CONCENTRATION (CTS/LITER)" ;
YCN_07:units = "N/LTR" ;
YCN_07:actual_range = NaNf, Infinityf ;
YCN_07:SampledRate = 1 ;
YCN_07:_FillValue = -32767.f ;
float YCN_08(Time) ;
YCN_08:long_name = "PROBE 2/CELL 8 CONCENTRATION (CTS/LITER)" ;
YCN_08:units = "N/LTR" ;
YCN_08:actual_range = NaNf, Infinityf ;
YCN_08:SampledRate = 1 ;
YCN_08:_FillValue = -32767.f ;
float YCN_09(Time) ;
YCN_09:long_name = "PROBE 2/CELL 9 CONCENTRATION (CTS/LITER)" ;
YCN_09:units = "N/LTR" ;
YCN_09:actual_range = NaNf, Infinityf ;
YCN_09:SampledRate = 1 ;
YCN_09:_FillValue = -32767.f ;
float YCN_10(Time) ;
YCN_10:long_name = "PROBE 2/CELL10 CONCENTRATION (CTS/LITER)" ;
YCN_10:units = "N/LTR" ;
YCN_10:actual_range = NaNf, Infinityf ;
YCN_10:SampledRate = 1 ;
YCN_10:_FillValue = -32767.f ;
float YCN_11(Time) ;
YCN_11:long_name = "PROBE 2/CELL11 CONCENTRATION (CTS/LITER)" ;
YCN_11:units = "N/LTR" ;
YCN_11:actual_range = NaNf, Infinityf ;
YCN_11:SampledRate = 1 ;
YCN_11:_FillValue = -32767.f ;
float YCN_12(Time) ;
YCN_12:long_name = "PROBE 2/CELL12 CONCENTRATION (CTS/LITER)" ;
YCN_12:units = "N/LTR" ;
YCN_12:actual_range = NaNf, Infinityf ;
YCN_12:SampledRate = 1 ;
YCN_12:_FillValue = -32767.f ;
float YCN_13(Time) ;
YCN_13:long_name = "PROBE 2/CELL13 CONCENTRATION (CTS/LITER)" ;
YCN_13:units = "N/LTR" ;
YCN_13:actual_range = NaNf, Infinityf ;
YCN_13:SampledRate = 1 ;
YCN_13:_FillValue = -32767.f ;
float YCN_14(Time) ;
YCN_14:long_name = "PROBE 2/CELL14 CONCENTRATION (CTS/LITER)" ;
YCN_14:units = "N/LTR" ;
YCN_14:actual_range = NaNf, Infinityf ;
YCN_14:SampledRate = 1 ;
YCN_14:_FillValue = -32767.f ;
float YCN_15(Time) ;
YCN_15:long_name = "PROBE 2/CELL15 CONCENTRATION (CTS/LITER)" ;
YCN_15:units = "N/LTR" ;
YCN_15:actual_range = NaNf, Infinityf ;
YCN_15:SampledRate = 1 ;
YCN_15:_FillValue = -32767.f ;
float FLWC(Time) ;
FLWC:long_name = "WATER CONTENT (FSSP PROBE) (G/M3)" ;
FLWC:units = "gram/m3" ;
FLWC:actual_range = NaNf, Infinityf ;
FLWC:SampledRate = 1 ;
FLWC:_FillValue = -32767.f ;
float FCONC(Time) ;
FCONC:long_name = "CONCENTRATION (FSSP PROBE) (N/CC)" ;
FCONC:units = "1/cm3" ;
FCONC:actual_range = 0.f, 363.7f ;
FCONC:SampledRate = 1 ;
FCONC:_FillValue = -32767.f ;
float FDBAR(Time) ;
FDBAR:long_name = "MEAN DIAMETER (FSSP PROBE) (MICRONS)" ;
FDBAR:units = "MICRONS" ;
FDBAR:actual_range = NaNf, Infinityf ;
FDBAR:SampledRate = 1 ;
FDBAR:_FillValue = -32767.f ;
float FDISP(Time) ;
FDISP:long_name = "DISPERSION (FSSP PROBE)" ;
FDISP:units = "unk" ;
FDISP:actual_range = NaNf, Infinityf ;
FDISP:SampledRate = 1 ;
FDISP:_FillValue = -32767.f ;
float YLWC(Time) ;
YLWC:long_name = "WATER CONTENT (200Y PROBE) (G/M3)" ;
YLWC:units = "gram/m3" ;
YLWC:actual_range = NaNf, Infinityf ;
YLWC:SampledRate = 1 ;
YLWC:_FillValue = -32767.f ;
float YCONC(Time) ;
YCONC:long_name = "CONCENTRATION (200Y PROBE) (N/LITER)" ;
YCONC:units = "N/LITER" ;
YCONC:actual_range = NaNf, Infinityf ;
YCONC:SampledRate = 1 ;
YCONC:_FillValue = -32767.f ;
float YDBAR(Time) ;
YDBAR:long_name = "MEAN DIAMETER (200Y PROBE) (MICRONS)" ;
YDBAR:units = "MICRONS" ;
YDBAR:actual_range = 0.f, 2417.15f ;
YDBAR:SampledRate = 1 ;
YDBAR:_FillValue = -32767.f ;
float YDISP(Time) ;
YDISP:long_name = "DISPERSION (200Y PROBE)" ;
YDISP:units = "unk" ;
YDISP:actual_range = NaNf, Infinityf ;
YDISP:SampledRate = 1 ;
YDISP:_FillValue = -32767.f ;
float YDBZ(Time) ;
YDBZ:long_name = "REFLECTIVITY FACTOR (200Y ) (DBZ,MM6/M3)" ;
YDBZ:units = "MM6/M3" ;
YDBZ:actual_range = -30.f, 33.80299f ;
YDBZ:SampledRate = 1 ;
YDBZ:_FillValue = -32767.f ;
// global attributes:
:institution = "NCAR Research Aviation Facility" ;
:Address = "P.O. Box 3000, Boulder, CO 80307-3000" ;
:creator_url = "http://www.eol.ucar.edu" ;
:Conventions = "NCAR-RAF/nimbus" ;
:ConventionsURL = "http://www.eol.ucar.edu/raf/Software/netCDF.html" ;
:ConventionsVersion = "1.3" ;
:Metadata_Conventions = "Unidata Dataset Discovery v1.0" ;
:standard_name_vocabulary = "CF-1.0" ;
:time_coordinate = "Time" ;
:Phone = "(303) 497-1030" ;
:ProcessorURL = "https://github.com/ncareol/GENPRO" ;
:ProcessorRevision = "8ff1ae2e-dirty" ;
:Categories = "Position,Thermodynamic,Aircraft State,Atmos. State" ;
:geospatial_vertical_positive = "up" ;
:date_created = "2016-08-09T18:43:27 +0000" ;
:Platform = "N306D" ;
:wind_field = "WSPD WDRCTN WI" ;
:time_coverage_start = "1982-12-11T06:10:46 +0000" ;
:time_coverage_end = "1982-12-11T09:09:44 +0000" ;
:TimeInterval = "06:10:46-09:09:44" ;
:FlightDate = "12/11/1982" ;
:geospatial_lat_min = 42.395f ;
:geospatial_lat_max = 43.28999f ;
:latitude_coordinate = "LAT" ;
:geospatial_lon_min = -71.683f ;
:geospatial_lon_max = -70.351f ;
:longitude_coordinate = "LON" ;
:zaxis_coordinate = "HP" ;
:geospatial_vertical_units = "m" ;
:geospatial_vertical_min = 1.200012f ;
:geospatial_vertical_max = 4899.5f ;
:DESCRIPTION = "677-2 NEWS 11DEC82" ;
:CYCLE_TIME = 1.f ;
:FlightNumber = "RF02B" ;
:ProjectName = "NEWS (New England Winter Storms)" ;
:converted_from = "G51565" ;
}ASTER facility Info
Introduction
This document is a standard product of the NCAR/ATD/SSSF ASTER facility, which gives an overview of the measurements taken and conditions during the DOWNWASH94 field experiment.
ASTER data are stored in two forms:
- 5-minute averages of first and second-order moments of calibrated data. We recommend combining these to obtain more statistically-significant averages over longer time periods.
- 1, 10, or 20 sample/second uncalibrated values. Software is maintained at SSSF to generate calibrated time series on demand using the most current calibration routines.
Also available is a computer-readable log of comments noted by ASTER personnel. The logbook can be read here (sorry, some comments are garbled and this version cannot be searched). For access to the ASTER data, please contact SSSF. For access to other data from the DOWNWASH program, please contact Dave Strimaitis at Sigma Research Corporation.
Several photographs are available in compressed TIFF format.
Experiment Description
DOWNWASH94 (Full name: Combustion Turbine Plume Rise and Building Downwash Model Development) was an EPRI-funded program with principal investigator Lloyd Schulman (Sigma Research Corporation). This program was designed to provide data for the development of a new computer model to represent the plume rise and building-induced downwash from power plants, especially those with "less than Good Engineering Practice" stack heights. In particular, the research goal was to define conditions under which the exhaust plume from a combustion turbine would be drawn downward due to the turbulence induced by the structure housing the turbine.
Norman Bowne (ENSR Consulting and Engineering) was the manager for the field phase of this program which, in addition to ASTER, included an auxiliary weather station and tethersonde operated by ENSR and a scanning aerosal LIDAR operated by Norm Nielsen (SRI International). New Jersey Power and Light also operated a Doppler SODAR at a nearby plant. The entire EPRI program also included wind-tunnel and numerical modeling studies of plume rise and downwash.
Location
This experiment was located in Sayreville, New Jersey (about 20 miles south of Newark) at the Sayreville Generating Station. This site was quite complex, with the CT stacks about 12m high, the three oil storage tanks to the west about 18m high, and the main power plant to the northwest about 45m high, with stacks going up to 67m. Bordering the plant were marsh lands and the Raritan River.
Sensors
The DOWNWASH Tower Layout shows the location of the ASTER towers ("cav1", "cav2", and "far") used for this program relative to structures in the power plant. Most of the towers were located near the southern-most combustion turbine (CT4) to obtain mean and turbulent flow statistics in a two-dimensional cross section aligned with the expected mean flow direction. (The DOWNWASH Tower Survey, shows detailed locations of these towers.) The third tower ("upwind") was located in an unused parking lot near the plant entrance to provide reference flow measurements. The DOWNWASH Configuration documents which sensors were deployed on each of the towers. Each sensor is labeled by the quantities it measures, its name, its height on the tower, and the tower name. DOWNWASH Sensor Table lists the type, manufacturer, and other specifications of the sensors used for this project. "Cav1" had three levels of mean temperature and humidity sensors and two levels of turbulence sensors (three-dimensional sonic anemometer and temperature sensor). "Cav2" had three levels of mean wind speed and direction sensors (propeller-vanes). "Far" had one level with a mean wind sensor and another level with turbulence sensors, which can be combined to give a two-level wind profile. The reference "upwind" tower also had three levels, each with wind, temperature, and humidity sensors and one with turbulence sensors (including a fast-response hygrometer). Also included at the "far" tower were measurements of net, upward and downward visible and infrared radiation, radiometric surface temperature, and precipitation.
The non-standard (not included with ASTER) sensors used for this program were:
- A temperature and humidity data logger on the roof of the main plant deployed by NCAR to give a crude measure of the atmospheric stability at the height of the plume. (Data were not archived by ASTER, but are available as an ASCII file of 1-minute values from SSSF.)
- Two NOx analyzers deployed by ENSR, each with three multiplexed inlets, which sampled the NOx concentration from tubes placed at two levels on each of the cav1, cav2, and far towers.
- A weather station deployed by ENSR which reported temperature, wind speed, direction, and variation of wind direction every 5 minutes. This station was located off of the axis of the cav1, cav2, and far towers to provide some information about the lateral extent of the building wake.
Operation
This program occurred during one of the worst winters on record for the northeastern U.S., characterized by freezing rain, cold temperatures which caused "brown-out" electrical power conditions, and flooding due to ice-jammed rivers. Flooding extended to the "upwind" and "far" towers in conjunction with a tidal surge on day 63, which damaged the data acquisition system for the "far" tower.
Albedo from the radiometers should give a good indication of when snow was on the ground (most of the time). Surface conditions (including snow depth) often were noted in the system logbook.
Setup of cav1 and cav2 was delayed until day 41 while CT4 was being repaired. During this time, data were being collected from these towers while they were laying close to the ground.
Known instrument problems:
- All psychrometer temperature measurements are high by about 0.9 C, due to a laboratory calibration error. These measurements should be corrected (and this comment deleted) by Spring 1995. No other temperature measurements were affected by this problem.
- Soil measurements, usually included with ASTER to measure the total energy balance, were not made since the surface was a gravel parking lot.
- The Krypton hygrometer had a very low signal level, and might not have recoverable data. Our only spare also was not working correctly and was not fixed until too late in the program. It should be possible to make a crude estimate of the latent heat flux using a Bowen ratio from the upwind tower sensors.
- Fast temperature sensors (fine-wire Platinum resistance thermometers) usually broke during precipitation. This common problem was worse than usual since the precipitation often was freezing rain. Heat fluxes also can be obtained from the sonic anemometer virtual temperature measurements.
- Tilt corrections were not applied to the sonic anemometer data due to the irregular flow conditions at this site. All towers were leveled using the theodolite, so the data should be close to a gravitational coordinate system. Also, data from two-axis electrolytic levels on the sonic anemometers used on the cav1 tower are available as a check of the instrument orientation.
- The cav1 sonic anemometers were observed to "sway" (yaw) in high winds, probably due to the wind loading from the psychrometers on the same tower. We have been unable to detect this motion in the sonic anemometer velocity data.
- The atik.4m.cav1 sonic anemometer failed a few days before the first CT run on day 45 due to a faulty CPU board. A replacement arrived 30 minutes into this run and was installed.
- The UW sonic anemometer processing used the wrong calibrations prior to day 38. Since this was before operations, these data have not been reprocessed.
- The UW sonic anemometers typically had 2 spikes per hour, which was considered acceptable. All sonic anemometers had spiking problems and eventually failed with heavy precipitation. Light spiking can be removed using standard ASTER despiking software.
- The upward-looking Epply pyrgeometer batteries had to be replaced early in the experiment. Data was bad before Day 039, 14:50 until this was corrected. Also note that the radiometer was cooling from the trailer to the outside temperature just after replacement, so it might not be accurate for the first 1/2 hour.
- The Epply pyrgeometer, and possibly the other upward-looking (and net) radiometers often had snow/ice accumulated on the domes during and after precipitation.
- All radiometers were shadowed (when there was sun) frequently during the day from nearby power line towers.
- Prop wind directions on upwind tower are off by about 0.5 degree prior to day 37. Since operations had not started then, this small error has not been corrected.
- The prop.10m.far, and sometimes prop.6m.upwind, had periods with lost or reduced wind speeds. We have identified these units for repair.
- We replaced psychrometers on the upwind tower to reduce apparent biases early in the experiment. Between day 39 and 40 the "6m" unit was at 0.5m for testing. Biases noted on day 43 were +0.1 C and +1% RH for the psyc.6m.upwind.
- psyc.2m.cav1 was at 1.8m between erection of cav1 on day 41 and day 44 at 2100Z, since we couldn't climb the tower due to ice.
- The ENSR met tower blew down at 1800 on day 54, but was reinstalled a short time later. The wind vane was damaged by this.
- Note that all azimuth angles were shot using the theodolite with the sun as a reference (which is normal ASTER operations) since compass readings could not be trusted at this site. There were enough sunny periods to accomplish this task.
- Vehicles often were parked just to the west of CT 3 and 4, which might affect the flow. Vehicles also accessed the garage between cav2 and far occasionally throughout the experiment.
Refer to the logbook for more details on sensor operation.
Chronology
Julian Day: Action
- 035: Archiving Started; Far tower up
- 036: Upwind tower erected
- 041: CT4 fixed; cav1 and cav2 towers erected
- 044: cav1 and cav2 towers leveled.
- 045: CT started 1630, low-load (4 MW) run from 1700-2000, base load (62 MW) from 2000-2115.
- 047: CT @4 MW from 1630-1830, 30 MW from 1830-1930, 62 MW from 1930-2130, shutdown 2150.
- 048: CT ran from 1500-1900 for a plume rise experiment.
- 049: CT ran from 2100-0117 for plume rise
- 050: CT started at 1420 for plume rise
- 053: CT ran from 1345-1545 on gas for downwash experiment
- 057: CT started 1300 for downwash
- 058: CT ran from 1400-2100
- 059: CT ran from 1100-1415 for plume rise; CT 1 and CT 3 also ran during this period
- 062: far and upwind towers flooded overnight; prop.10m.far destroyed; prop.6m.cav2 missing blades; uw.4m.far destroyed; other sonics iced up
- 063: CT operating for power; recoverable sensors fixed
- 065: ASTER operations ended
Daily Plots
The following plots summarize conditions during each day of the project. Each plot covers one Julian day (0000-2359 GMT) and is labeled with time in GMT at the bottom and local time (EST) at the top. The top panel displays temperature and specific humidity from the 2m upwind tower, pressure, and precipitation rates (if present). Below that is a plot of wind speed and direction from the 6m upwind tower, with dotted lines showing the best directions for downwash to occur. The next panel shows net radiation measured near the far tower, and sensible heat flux from 10m on the upwind tower. The bottom panel shows the Monin-Obukhov stability parameter, z/L, and the friction velocity, u*, calculated from the 10m upwind data. Since these fluxes and derived parameters are based on smoothed, 5-minute average statistics, they should not be used quantitatively and are only shown for guidance in selecting periods to analyze further. The latent heat flux and Bowen ratio, which normally are shown on this series of plots from ASTER, are not present due to the above-mentioned poor performance of the Krypton hygrometer.
Other plots
- Data from the entire experiment from the roof-top sensors along with measurements from the 10m level of the upwind tower
Field Logbook
A computer-readable field logbook of comments by NCAR and other personnel is available in read-only html form.
Publication or Paper On the cumulus diurnal cycle over the tropical warm pool
Field Project MITTS
Project Information
Letter from the Project Manager
Publication or Paper The Impacts of Dry Dynamic Cores on Asymmetric Hurricane Intensification
5 Quick Questions
1. Why is it critical that we understand the initiation processes of the Madden-Julian Oscillation?
DYNAMO will provide researchers with vital observations of the Madden-Julian Oscillation (MJO), a poorly understood phenomena, particularly the initiation phase. The results will help researchers to more accurately forecast the weather and climate of the equatorial Indian Ocean and around the world. Large-scale weather events, such as the MJO, create pulses that have direct effects on regional weather patterns around the world, similar to that of a chain reaction.
Gaining a better understanding of the environmental factors during developmental stages of the MJO will vastly increase our understanding of global climate systems and enable researchers to produce more accurate climate models. With these added benefits, scientists can better predict future changes to our climate.
2. How is the MJO a "bridge" between weather and climate?
A MJO event is characterized as a period of enhanced tropical rain storms, with intervals of little to no rainfall, creating regional weather patterns in the Indian and Pacific Oceans. The 30-90 day weather cycle usually then becomes nondescript as it moves beyond the region. The size and scale of this regional weather pattern causes direct effects on other weather, as well as climate patterns around the globe.
Like a row of dominos, one falls over causing a chain reaction of others to follow suit, a MJO weather event can have a chain reaction of other response, some large enough to affect climate.
"With a greater understanding of the initiation process of the MJO, improvement in weather prediction can be gained on one hand while improving the seasonal predictions of climate variability on the other hand" states Chidong Zhang, DYNAMO Chief Scientist.
3. How will this study of the initiation of the MJO benefit climate modeling?
|
"The data collected during DYNAMO will improve our confidence in climate models", says Zhang. |
The large amounts of observational data collected during DYNAMO will provide researchers with an unprecedented data set that will be incorporated into climate models. These empirical data provide information such as the physical properties of clouds; cloud population and evolution; general atmospheric attributes; wind speeds and direction; amount of energy being absorbed and emitted by the Earth; and a host of ocean conditions.
This abundance of new data from a previously poorly-understood phenomena, will be incorporated into different climate models to help better predict regional weather and global climate variabilities.
4. What other global climate patterns are associated with the MJO?
The MJO has far reaching effects on many other global climate patterns such as the El Niño-Southern Oscillation (ENSO), Northern Hemisphere monsoons, tropical storm development, and even pineapple express events. Having a better understanding and prediction capability of the initiation phase of the MJO would have direct benefits to communities all over the globe.
- ENSO :: The MJO shows variability from year to year of periods of strong activity to periods of weaker activity. Past observations have shown strong periods of MJO activity about 6-12 months prior to the onset of the El Niño-Southern Oscillation (ENSO) event, a global climate pattern, demonstrating a direct connection between the MJO and global climate patterns. The fishing industry is directly affected by this climate pattern.
- Asian Monsoons :: MJO events have an tendency to move in a northeasterly direction when they develop, which in turn impact the monsoon rainfall over Asia. Environmental conditions associated with the MJO impact the enhanced period of intense rain and periods of suppressed drought-causing conditions over the Asian continent (Yasunari 1979; Annamalai and Slingo 2001). Improved MJO prediction and modeling would have beneficial impacts on industries such as agriculture, natural resource management, and human health in one of the world's most populated regions.
- Tropical Storm Development :: Evidence has been shown that tropical storms, both in the Pacific and Atlantic basins, react to favorable or unfavorable, large-scale environmental conditions - such as sea surface temperature and wind patterns - that the MJO provides. Communities affected by tropical storms would have more time to prepare for storms with better prediction capabilities and modeling of the MJO.
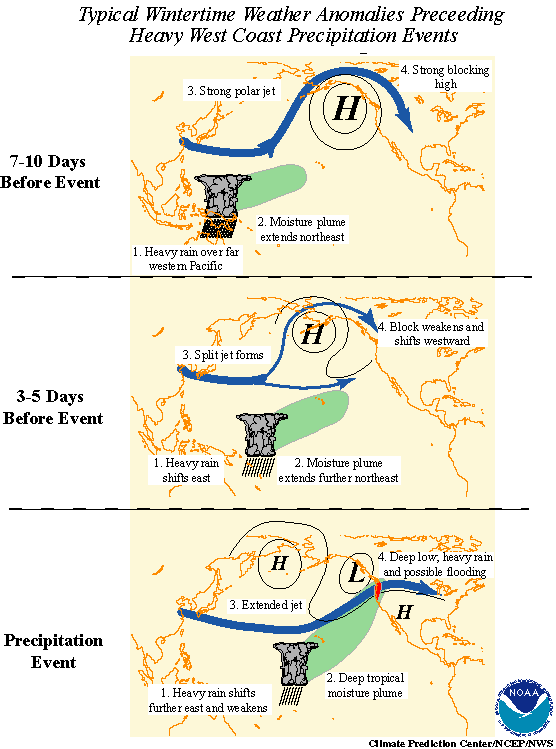
- Pineapple Express Events :: The term "Pineapple Express" is derived from an influx of warm, moist tropical air into the Pacific Northwest regions of the United States, usually accompanied by heavy rainfall. The warm, wet air masses are typically associated with an eastwardly moving MJO event moving from the western Pacific to eastern Pacific Ocean. The high pressure system involved with the MJO weather disturbance forces the strong global pattern of wind, also called the jet stream, to shift northward creating pressure differences on either side of it. The resulting weather events are heavy rain storms in North America's northwest and west coast regions.
5. Six months is longer than the average field project, why does DYNAMO need to collect data for this amount of time?
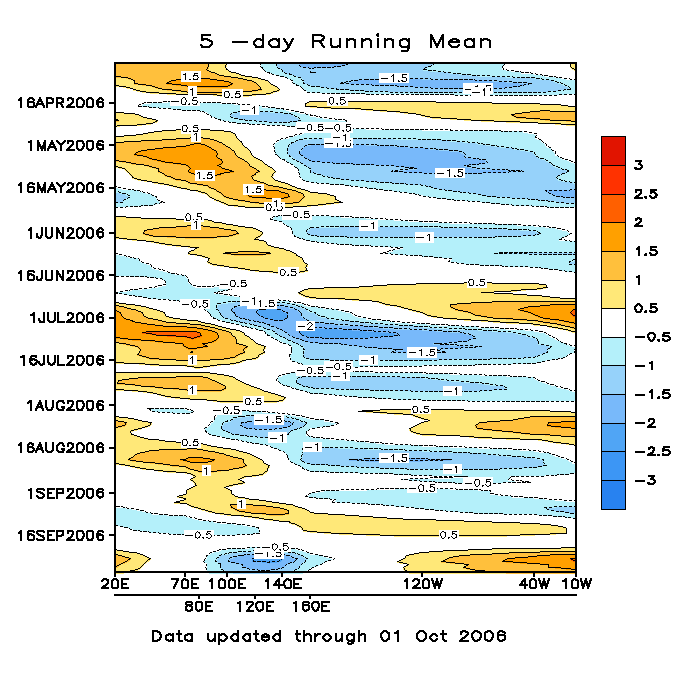
The MJO is a 30-90 day weather pattern that moves eastwardly across the the Indian Ocean region, typically during the fall and winter months of the Northern Hemisphere. In order to increase the chances that at least one, ideally more, target weather oscillation will pass over the large study area, a longer time frame increases the probability of being able to successfully observe an entire initiation process of the Madden-Julian Oscillation.
This Hovmöller diagram shows the time on the y-axis and longitude on the x-axis, showing the intensity of an MJO event over a seven month period in 2006.
Data Policy
Data Set Documentation Guidelines
Data Submission Instructions

