In July and August of 1987 Explorer was flown in flights over the Magdalena Mountains near Socorro with the 2D-Q instrument in addition to previously existing instrumentation. The Cannon Particle Camera had been removed to compensate for the added weight and power needed for the 2D-Q. Results from a spectacular flight to a true altitude of 40, 200 ft on Aug. 6, 1987, just south of Langmuir Lab are shown in Fig. 30. Unlike most previous flights of Explorer in growing cumulus congestus or small, isolated thunderstorms where the objective was to study the initial electrification of growing cloud, this flight in 1987 was in a small thunderstorm that was actively producing lightning. During the mid to later part of this ascent the pilot reported “almost continuous graupel and wet snow” and later commented “quite a bit of lightning up here". Lightning occurred but was not frequent during most previous sailplane in-cloud ascents.
The sailplane track and measurements from the ascent from about 7.5 to almost 11 km (-12 to -35 0C) are shown in Fig. 30. Note that updrafts during this period were 15 to >25 m/s and liquid water content was highly variable with peaks decreasing from ~2 g m-3 between 1319 - 1322 to ~0.1 g m-3 after 1324. Explorer was clearly in an actively growing cell.
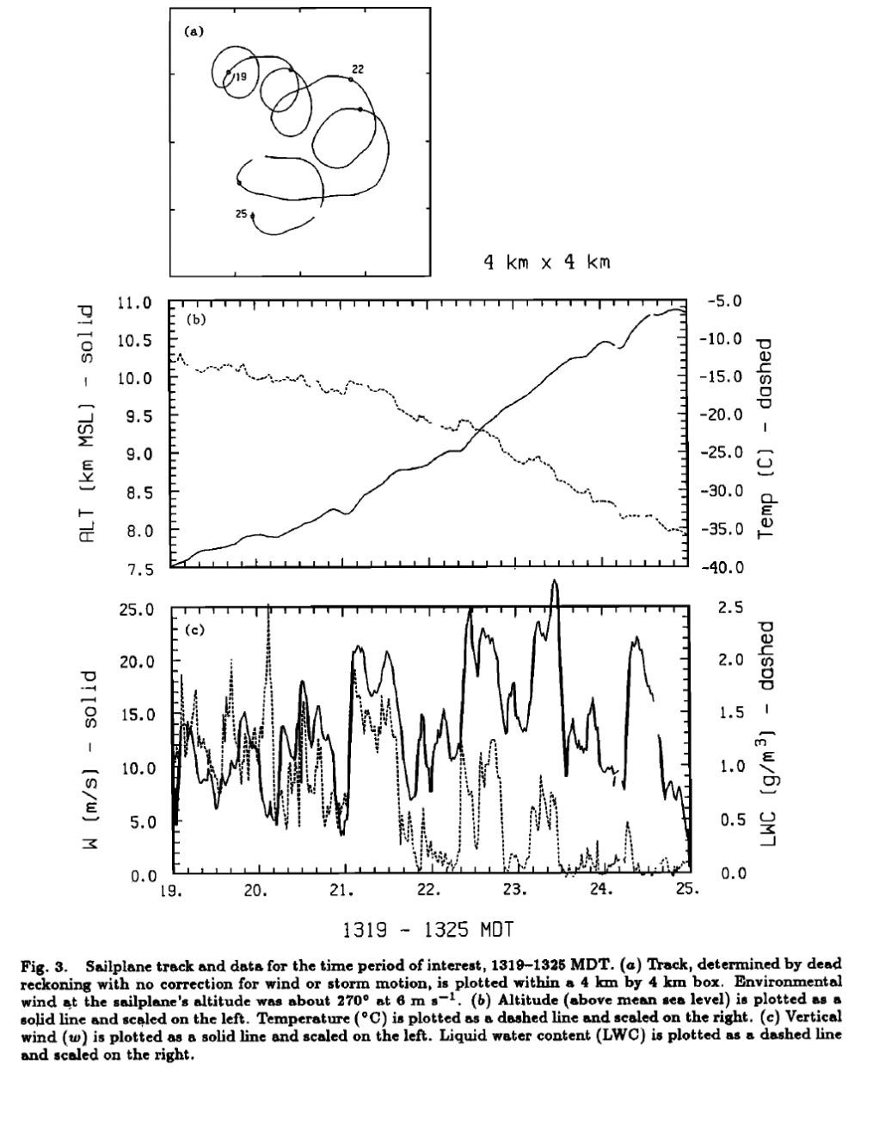
Fig. 30 A copy of Fig. 3 from Weinheimer et al., 1991.
Examples of 3 particles with associated charge sampled at an altitude of 9 km and temperature of -26 C are presented in Fig. 31. The dual traces of charge for each image are from the two induction rings located inside the cylindrical housing of the charge measurement device. To be accepted as a viable charge associated with the imaged particle the time location of the first trace must be within 8 mm of the expected time for the particle transit and the separation in time between the two traces must be correct. See Weinheimer et al., 1991, for more information.
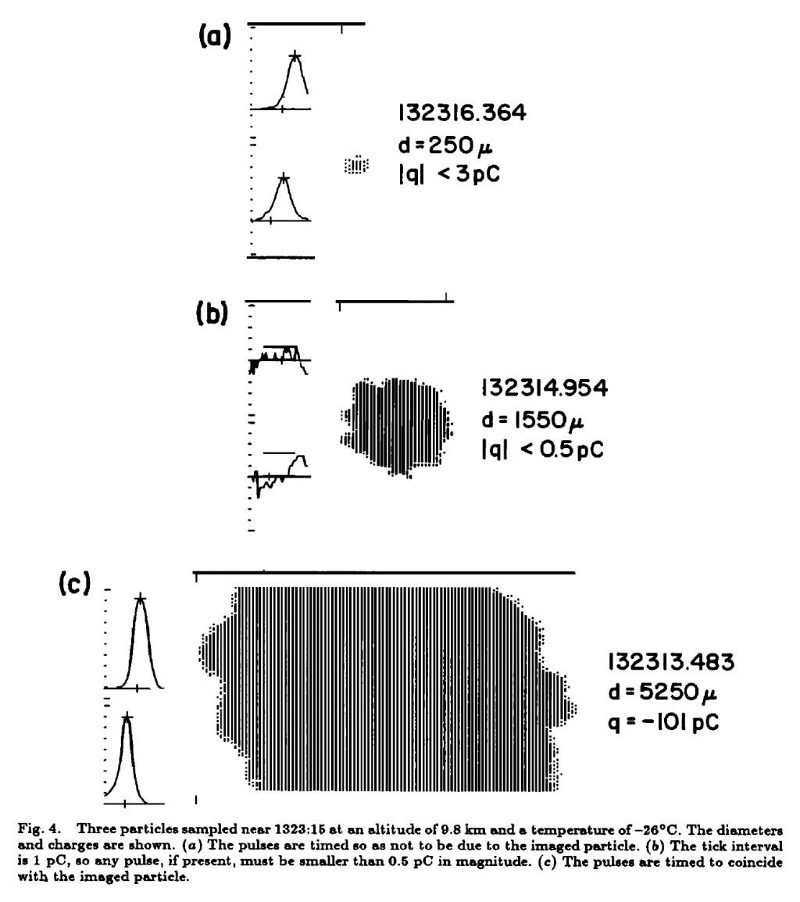
Fig. 31 A copy of Fig. 4 from Weinheimer et al., 1991.
Fig. 32 shows a plot of particle charge vs time that includes all detected particles with charge above the 1 – 3 pC noise threshold of the 2D-Q for the period of 1319 to 1325. Note in Fig. 32 that before 1321 (below about 8 km) charges on acceptable images carried charges of both negative and positive sign. However, after 1322 (about 9 km, -20C) charges were almost exclusively of positive sign. This change to positive sign at temperatures colder than -20C is consistent with what might be expected from the non-inductive ice collisional mechanism.
Although not shown here, the measurements showed that larger particles tended to carry more charge but not all larger particles were charged. The particles which did contain charge increased with increasing size. For particles with 1 to 2 mm size, less than 5% contained charge above the detection limit of 1 to 3 pC. In contrast 50% of particles of 5 to 6 mm size contained detectable charge. It is puzzling why there should be such a large difference in the fraction of particles which carried charge above the threshold. Additional studies are needed to further understand what is happening. See Weinheimer etal., 1991 for additional discussion of these results.
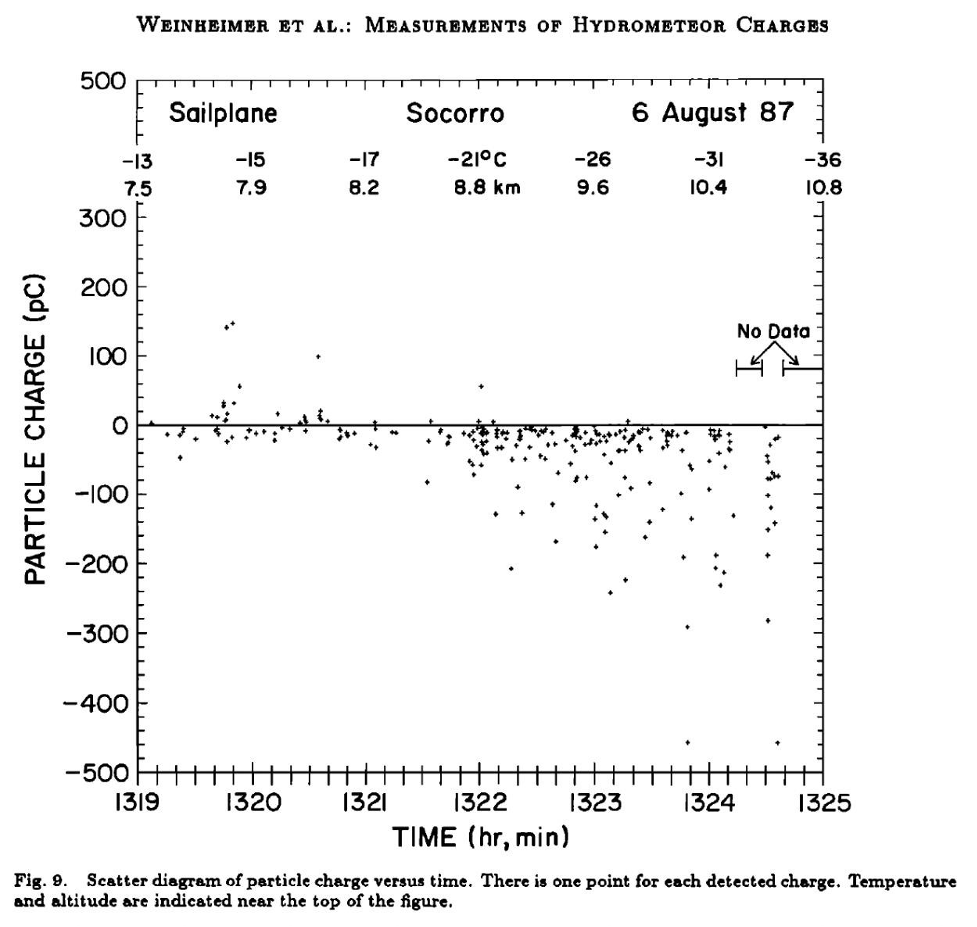
Fig. 32 A duplication of Fig. 9 from Weinheimer et al.