The first important discovery from Explorer sailplane resulted from examination of images of particles from the new CPC measurements. There were many precipitation-sized (>200 µm) ice particles of many types above the freezing level in the upper levels of updrafts in cumulus congestus clouds in NE Colorado but a paucity of precipitation-sized (~>200 µm) water drops. Based on observations from Explorer ascents in CuCg clouds, a three-part paper published in 1974 concluded that the ice process (Bergeron-Findeisen) was the dominant process of precipitation formation in the cumulus cloud in Colorado. This conclusion was based on examination of graupel, and rimed ice particles collected on the sailplane (Knight et al 1974); the CPC photos of abundant ice particles and the paucity of drops (Cannon et al. 1974); and coordinated sailplane and radar measurements that showed the high altitude/cold temperature location of first radar echoes could be explained by the observed graupel size and concentrations. (Dye et al. 1974).
At the time of these sailplane findings the consensus of the cloud physics community was that the warm rain process (coalescence of colliding droplets to form larger drops that then fall from the cloud) was the dominant mechanism of precipitation formation. Historically the cloud physics community initially thought that the ice process was the dominant process of precipitation formation in most geographical regions based on the work of Bergeron (1933) and Findeisen (1938) which was conducted at mid-latitudes. Ice particles initiated from activation on ice nuclei was followed by diffusional growth of the tiny ice crystals until they were sufficiently large to begin to rime and grow into precipitation sizes. These frozen particles then fell below the 0 oC isotherm and melted to form raindrops. But as observations were made in the tropics it became apparent that rain fell from clouds that were entirely warmer than 0 oC. Additionally, the Thunderstorm Project results (Byers and Braham, 1948) from Florida and Ohio showed that large drops appeared in deep clouds at temperatures colder than 0 oC before the appearance of ice. Similarly, observations from Project Whitetop in southern Missouri found the presence of large drops in the updrafts preceded the appearance of ice in the clouds. Braham, 1964; Koenig, 1964).
However, Explorer observations from 1971 into 1974 clearly showed that ice formation was the dominant precipitation forming process in Colorado. In the ascents in updrafts of freshly growing cumulus clouds precipitation-sized drops (roughly >200 µm) were seldom observed. From all the sailplane measurements in NHRE from the 1972, 1973, 1974 and 1976 NHRE field campaigns (Knight et al, 1982) in Vol I, Chapter 7 of the NHRE final report (p. 170) summarized that the concentration of drops >150 µm was 2 m-3. For the entire NHRE field seasons average concentration of ice precipitation particles was ~1 L-1, roughly a factor of a thousand more ice particles than water drops.
An example of the concentration difference between water drops and ice particles is clearly shown in Fig. 20 (Dye et al. 1983) for the sailplane ascent on 25 July 1976. Each individual drop detected by the CPC is shown near the top of the fifth panel by a small open circle. The bottom of that panel shows that the 10-sec. average concentrations of all ice particles observed (light solid line) and the concentration of ice particles >1mm (bold line with shading) were typically 1 to 10 L-1 and the concentration of ice particle >1 mm were 0.1 to 1.0 L-1.
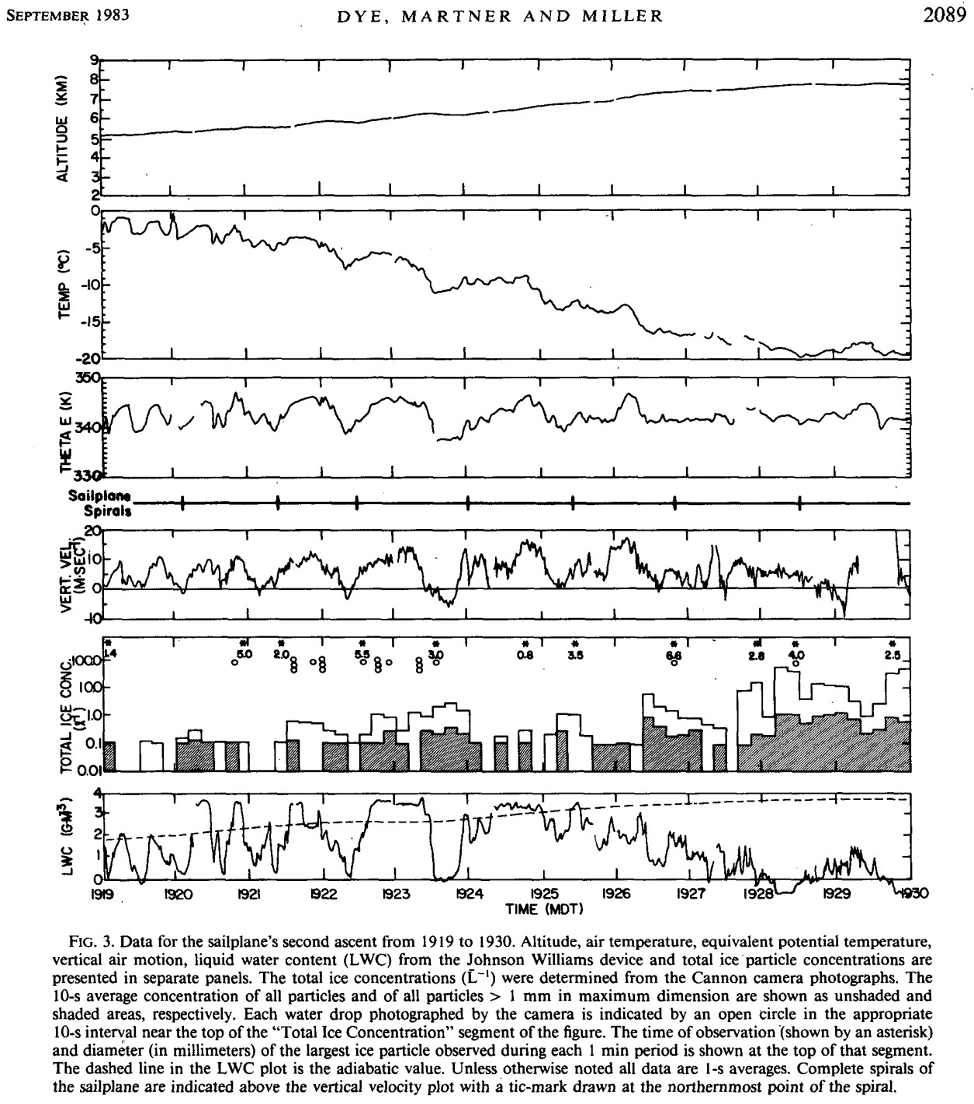
Fig. 20 Modified from Fig 3. in Dye et al., 1983
Similar results were found from later Explorer observations in clouds in central New Mexico (Dye, 1980) and Montana (Dye et al. 1986) and by other investigators using measurements from powered aircraft. Cooper and Lawson 1984)
The combined airborne evidence in clouds in Florida, Ohio, and Missouri as well as in Colorado, Montana and New Mexico from aircraft including Explorer sailplane results showed that the precipitation formation process was different in different geographical locations. This was thought to be because the clouds in Colorado, Montana and New Mexico had colder and higher cloud bases than the clouds in Florida and Ohio. Also, clouds in Colorado, Montana and New Mexico were continental in nature with droplet concentrations near cloud base of 500 to 1000 droplets cm-3. Both the cold cloud bases and the continental nature of the airmasses resulted in small cloud droplets, and thus were not favorable for coalescence.
An example of the many measurements made on Explorer is illustrated in Figure 20 for the sailplane flight in NE Colorado on July 25 1976 when it spiraled up in the updraft from 5.2 km (~-2C) to 7.8 km ~(-19 C). Cloud base for this case was 3.8 (+7 C).
The 4th panel down shows the measured vertical velocity of the air during this ascent. Notice the quasi-periodicity in the vertical velocity, as the sailplane spirals in and out of the updraft core. This quasi-periodicity can also be seen in the temperature, theta E, and liquid water content measurements. The 3rd panel down displays the equivalent potential temperature (Qe), calculated from the measured temperature and pressure. The red dashed line shows the adiabatic value of Qe from near cloud base. (3.8 km, 7 C). The plot shows that there were periods in the updraft even at upper levels in which air from cloud base had ascended almost adiabatically unmixed from cloud base to near the top of the sailplane ascent at 7.8 km.
During the research flights of the sailplane in projects such as NHRE in Colorado; Cooperative Convection and Precipitation Experiment (CCOPE) in SE Montana; and New Mexico projects near Socorro the position of the sailplane was known either from X-band tracking in NHRE or in later projects the Multiple Aircraft Position System (MAPS). MAPS was developed in our group by Peter Johnson and Jack Fink. (Johnson and Fink, 1982). It was vitally important to know aircraft location in the developing and mature storms to avoid flying in regions with hail, to safely separate the flights of individual aircraft from each other, and for research purposes to know the position of the sailplane or other aircraft relative to the radar reflectivity structure. An example of tracking of the sailplane relative to the developing radar structure for the 25 July 1976 storm is shown in Fig. 21.
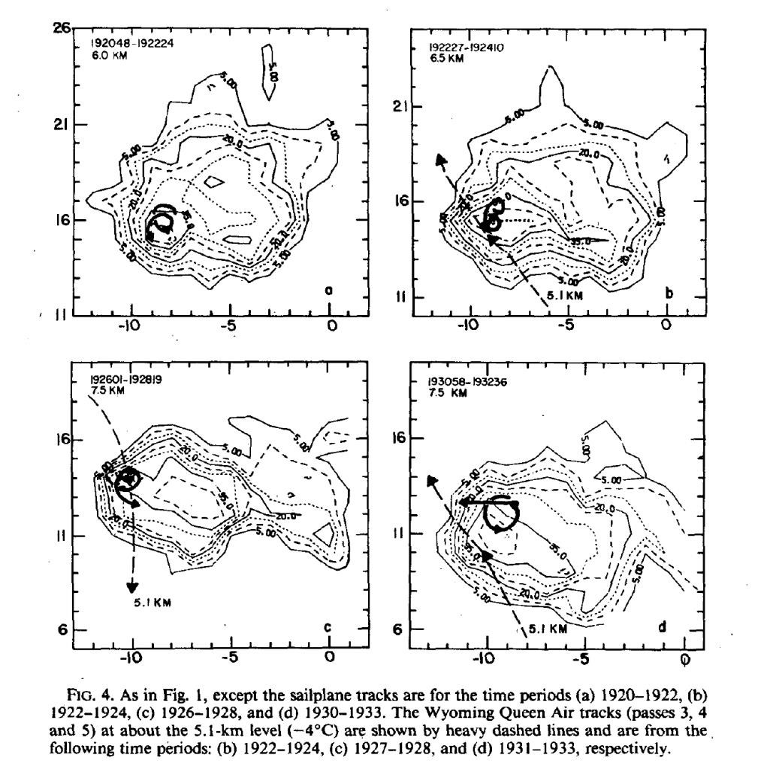
Fig. 21. A copy of the original Fig. 4 in Dye et al., 1983 showing the sailplane track overlaid on radar reflectivity.
As seen in Fig. 21 the sailplane flight was coordinated with the flight of the University of Wyoming Queen Air aircraft, N10UW. The Queen Air measurements documented the continuity of the updraft and microphysical conditions near cloud base. In this figure we see that in the upper part of its spiraling ascent the sailplane was flying in 30 to 35 dBZ at 6 km altitude from 1920 to 1922, but in 35 to 40 dBZ at 7.5 km later in the flight. Observations of graupel size and concentration determined from the Cloud Particle Camera photographs were found to be able to account for the observed radar reflectivity.