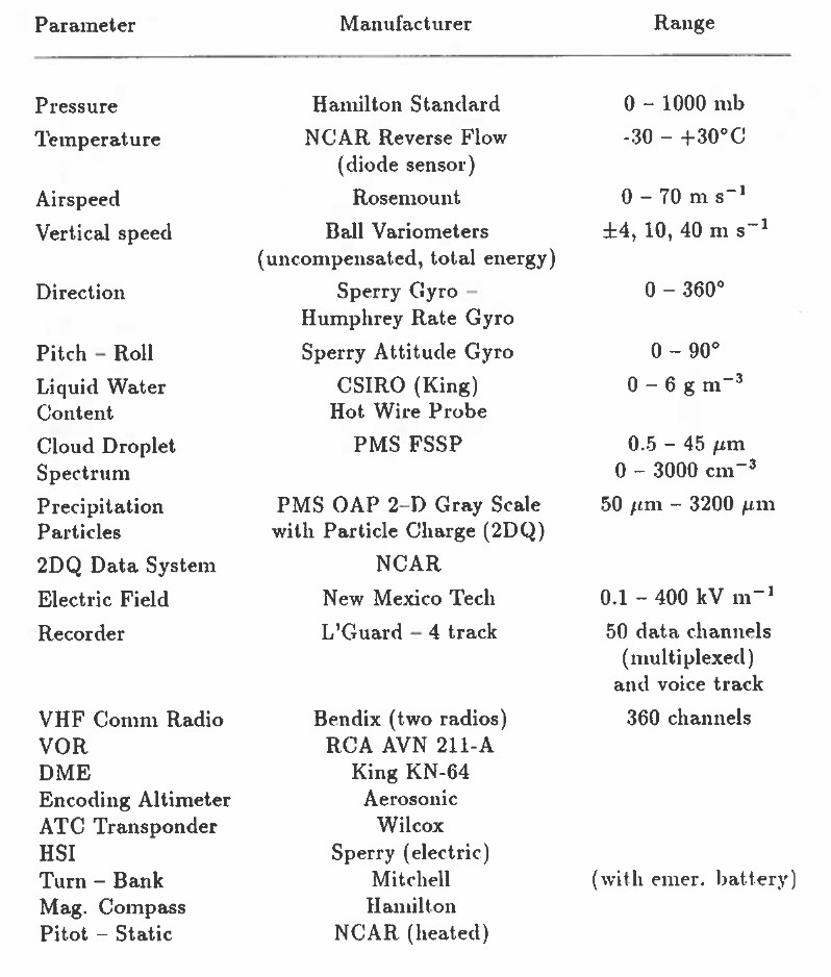
Immediately after the transfer of Explorer from ERC to ESSA/NCAR, personnel in the NCAR Cloud Physics Program worked actively to add telemetry, cloud physics instruments and flight instruments and radios to Explorer for both research and flight purposes. To take advantage of the sailplane capabilities it was necessary for instruments on the sailplane to be able to successfully operate at temperatures well below 0 C and in conditions with heavy icing. The updraft regions which are of primary interest for studies of precipitation development are the same regions in which heavy icing is likely. Substantial icing frequently occurred during sailplane flights, especially on higher ascents. The photographs of icing shown in Figs. 3-6 typify the kind of icing that Explorer experienced during some of the larger vertical ascents in cloud. Even with heavy icing on the wings, Explorer maintained stable flight characteristics.
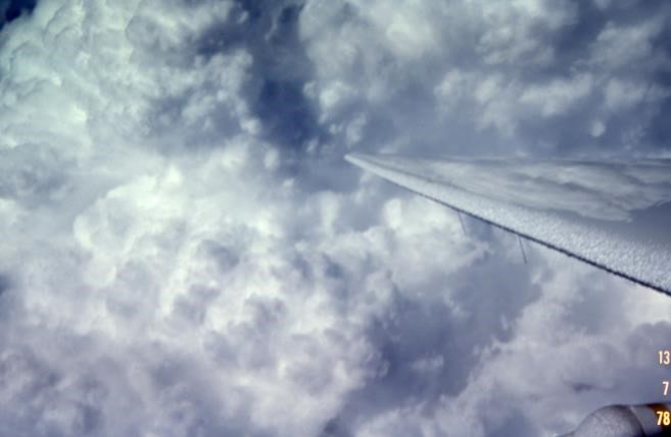
Fig. 3 An example of icing from July 13, 1978 of rime-like, rough, opaque ice on the right wing after an ascent in Colorado with small cloud droplets and lesser amounts of supercooled liquid water (SLW)
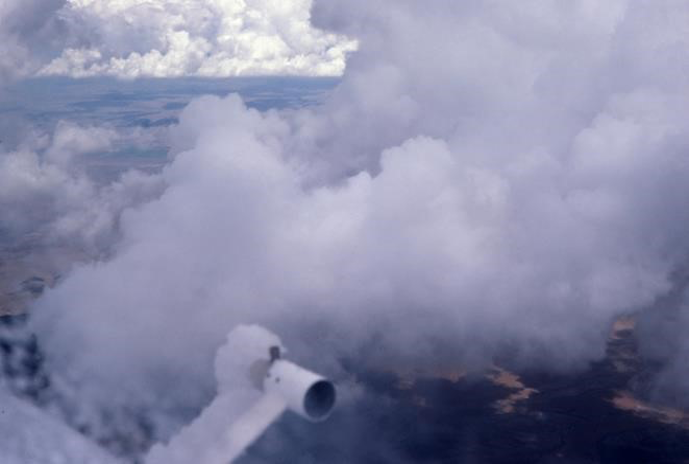
Fig. 4 Icing on the leading edge of the reverse flow temperature probe after an ascent in the mid 1970s. Note the absence of ice on the rear edge of the probe which is the inflow to the temperature sensor.
Fig. 5 An icing example which shows relatively clear ice with rivulets running back across the top of wing.
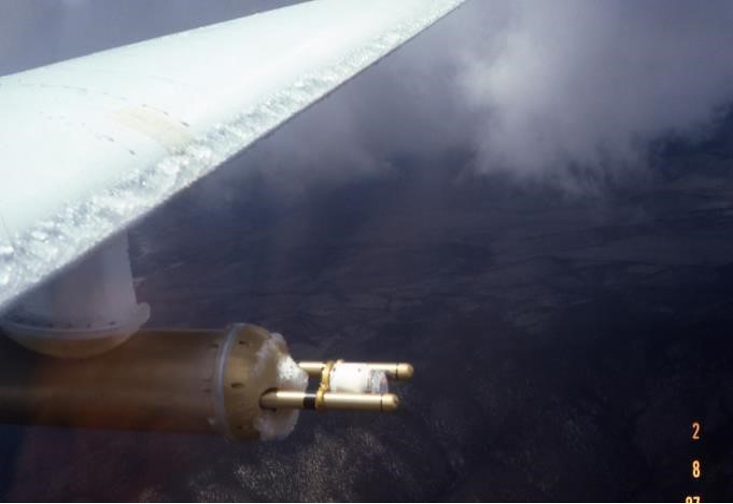
Fig. 6 Photo of relatively clear icing on the leading edge of the wing and the PMS 2D imaging probe with coupled induction ring after a very high flight in a region with high values of SLW near Socorro NM. This photo was from the record altitude Explorer flight of flight level 39,900 ft. on Aug. 2, 1987.
Because the space in the cockpit of Explorer was limited, the aviation instrument panel and the placement of instrument and heater switches had to be very tight. Photos 7 - 10 are photographs of the cockpit showing the cockpit panel, switches, and radios. The back seat photos show instruments and wiring after Explorer was flown without a back seat observer. This of course necessitated adding many new switches to the dashboard in the cockpit.
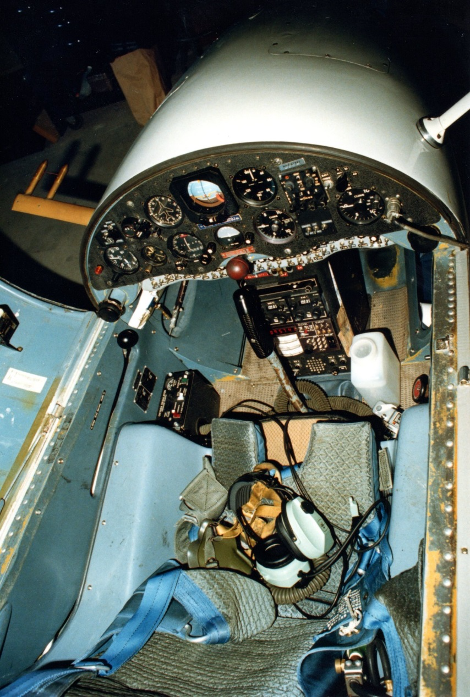
Fig. 7 A photograph of the cockpit showing the dashboard with radios below; the demand oxygen controller on the left immediately in front of the seat; the head set; and at the very back on the right the pressurized bottle with breathing oxygen.
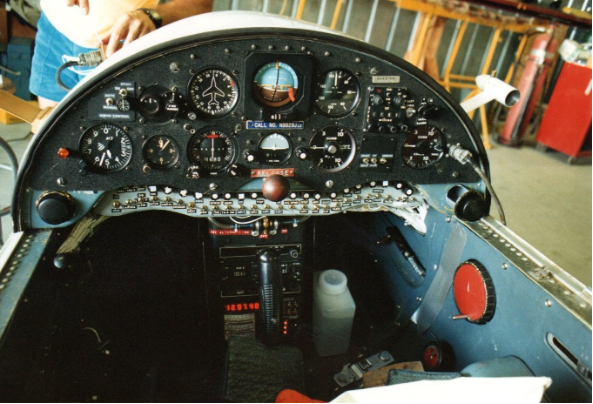
Fig. 8 A photo of the aviation instrument flight panel with the many instrument and heater switches below the panel and the radios stacked on the floor with the joystick for flight control in front of the radios. The red disk on the right operates the dive brakes (i.e. spoiler flaps on the wings which reduce lift thus allowing the sailplane to descend rapidly).
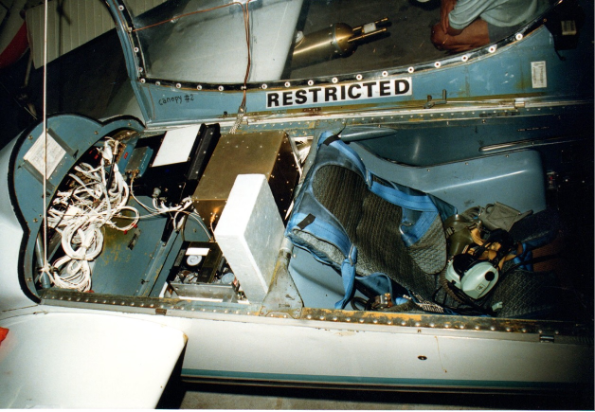
Fig. 9 A photograph showing the pilots seat with the recording device, associated electronics, and a multitude of wiring now placed in the rear observer’s seat. This photo was taken after on-board recording was included on the aircraft in addition to telemetry to the ground.
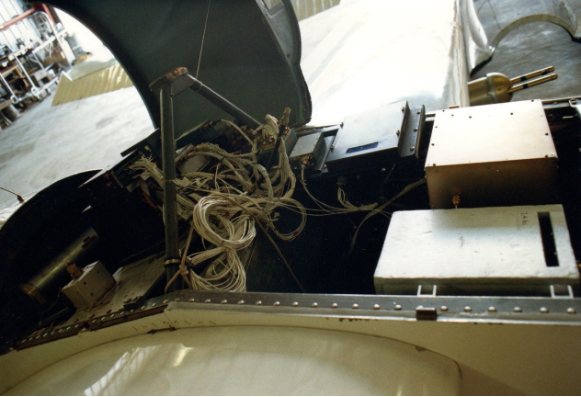
Fig. 10 A closeup photograph of the wiring and recording devices.
Whereas the measurements made by the ERC during lee wave studies were recorded on a five-channel strip chart recorder on board the sailplane, shortly after arrival at NCAR telemetry was developed for the sailplane so that measurements were telemetered to a ground station, which was a modified camping trailer (Fig. 11).
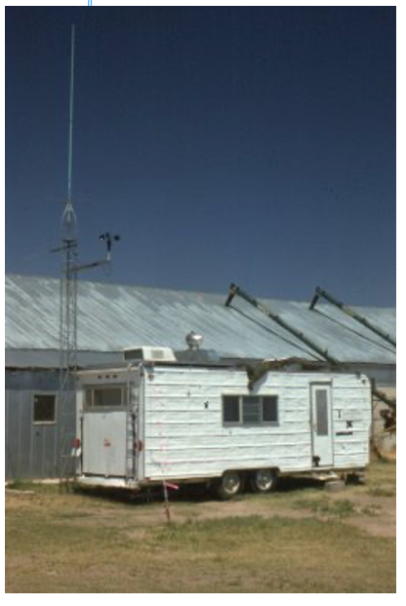
Fig. 11 Ground station at Butler, Wyoming during the NHRE Project (See Table I.). Note the highly dented side of the ground station caused by impacts from large hail in northeast Colorado.
In the ground station the measurements were recorded on strip chart recorders and on magnetic tapes so they could be viewed and recorded in real time and could be evaluated/analyzed by observers on the ground for feedback to the pilot and on-board observer. This alleviated the need for a recording system on-board the aircraft thus reducing the power and weight load on the sailplane. It also enabled the sailplane operations to be mobile and have the capability of operating in different geographical locations. Improved radios and a “hot” mike were implemented so that comments by the pilot and observer were continuously recorded and monitored in the ground station. The pilot and observer were encouraged to comment as frequently as possible on cloud details, the presence of updrafts or downdrafts, flight conditions or anything else they observed. With the addition of the telemetry system, calibrations of the various parameter systems could be checked in flight.
Beginning with the field project in New Mexico for TRIP (See Table I) on-board data recording was developed and implemented but data were also telemetered to and recorded in the ground station. As a result of the on-board recording Explorer flights no longer included an observer. The observer was situated in the ground station.
In preparation for the Cooperative Convection and Precipitation Experiment, CCOPE, (see Table I.) a semi-truck trailer was modified to build a bigger and better ground station for the sailplane operations. Telemetry receivers, analog and digital recorders, strip charge recorders with displays allowed direct viewing of many measurements, analog voice recorders and radio transmitters and receivers. The back of the ground station included a small electronic workshop. Photographs of the outside and inside of the ground station are show in Figs. 12 though 15.
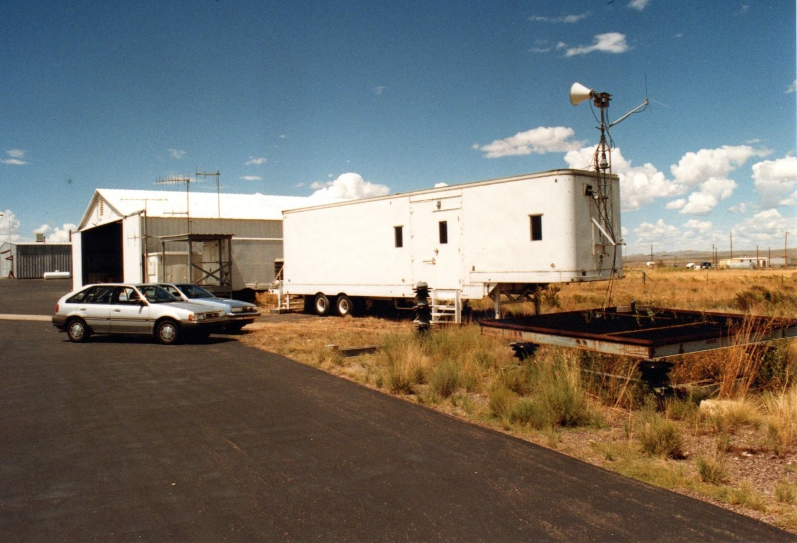
Fig. 12 A photograph of the sailplane ground station in Socorro New Mexico in 1984 next to the hangar of New Mexico Tech. The telemetry antenna is above the trailer on the right.
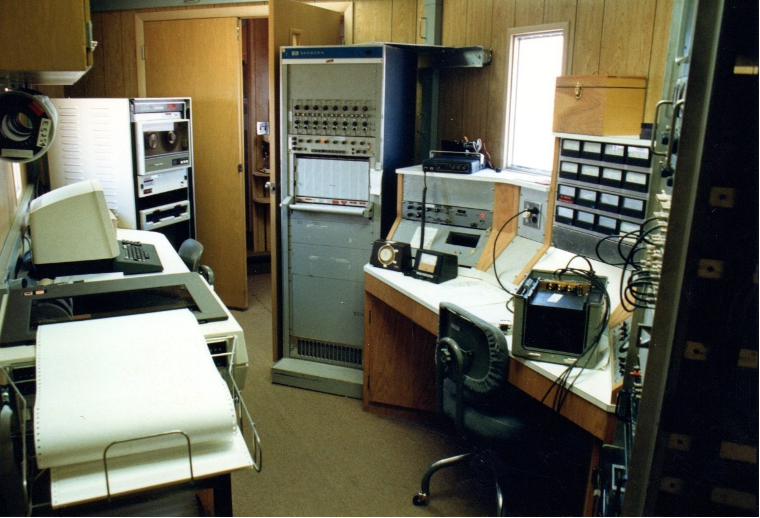
Fig. 13 A photograph of the interior of the ground station for and after CCOPE showing the strip chart recorders, digital tape recorder, computer consul and printer, and operation’s director consul.
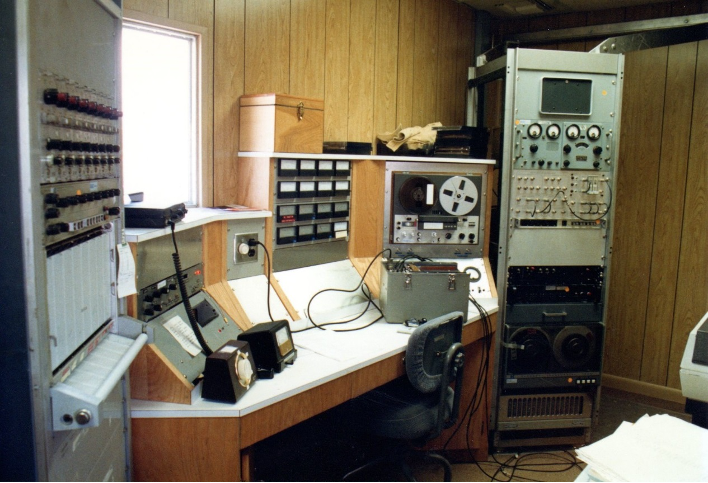
Fig. 14 Photograph in the ground station showing the strip chart recorder, radio consul, instrument monitors, audio tape recorder for pilot/ground station communications, time code generator and telemetry monitors.
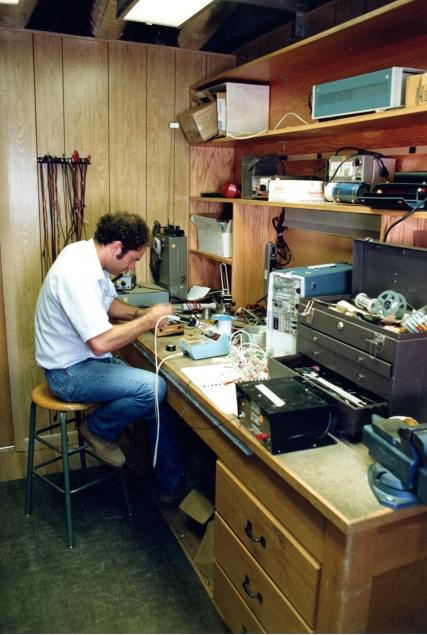
Fig. 15 Tom Gardner working in the small electronics shop in the ground station with test equipment on the shelves.
The document, “Sailplane Operations”, written by Dan Breed in 1988 gives an excellent, very detailed description of Explorer, its operation and of components of the sailplane system. It can be found at the following link:
Advances in understanding of physical processes in clouds from sailplane investigations were often the result of the development and availability of new instruments for Explorer. The sailplane studies were conducted from 1969 to 1995, a period of almost three decades. Huge strides in electronics, technological capabilities, miniaturization, and the change from analog to digital electronics all occurred during the 1967 to 1995 time-period. It was technically challenging to develop instruments for Explorer because the demands of low power and low weight were critical for anything flown on the sailplane. Unlike a powered aircraft in which electrical power is generated by the engine, on a sailplane the power was provided by silver-zinc batteries which are heavy and bulky. The history of cloud physics instruments added to Explorer is presented in Table II.
Table II. Chronological Installation of Cloud Physics Instruments on Explorer
March 1970 – Electrostatic Disdrometer to measure cloud droplet spectra.
March 1971 – Cannon Cloud Particle Camera to photograph hydrometeors in situ.
March 1973 – Particle Decelerator/Sampler to collect and view ice particles in the cockpit.
March 1975 – Reverse Flow Temperature Probe developed for the sailplane.
March 1975 – Modified Johnson-Williams (JW) Hot Wire Liquid Water Content Meter.
March 1975 – Humphrey Gyroscopes, three-axis accelerometers for updraft measurements.
March 1975 – Time-Resolved, Rotating Filter to sample AgI particles and aerosols.
March 1976 – PMS Forward Scattering Probe modified for Explorer to measure cloud droplets, replaced the Electrostatic Disdrometer.
1978 – Continuous-Belt sampler for time resolved collection of ice particles.
1981 – Cylindrical, Rotating Electric Field Mill to measure two components of electric field- designed and built by Professors Bill Winn and Dan Jones of New Mexico Tech.
1986 – PMS 2D Imaging Probe with Coupled Induction Ring for measuring precipitation particle images and charge.
1990 –4 Fuselage-Mounted Electric Field Mills, New Mexico Tech design.
1994 – 5 Fuselage Mills NMT design to measure 3 dimensions of Electric Field
Table III below shows the instrument package including avionics that was used for the 1987 field project at New Mexico Tech, Socorro, New Mexico. This package shows the multi-parameter capability and sophistication of Explorer measurement capability near its peak.
Table III Parameters, manufacturer, and response range of instruments on Explorer in 1987.