In 1984 Explorer was flown in New Mexico again with microphysical instruments and a new NMT electric field mill. The new mill had the capability of measured ambient electric field as well as the field due to charge on the sailplane. The project was primarily funded by NSF and the Office of Naval Research with Bill Winn and Jim Dye as Principal Investigators to investigate the dynamical, electrical, and microphysical properties of the storms that form almost daily over Langmuir Laboratory. Explorer flights were coordinated with those of the NMT Special Purpose Test Vehicle for Atmospheric Research (SPTVAR) which had the capability of making three-dimensional electric field measurements and limited microphysical measurements of liquid water content and particles >50 µm. The project included 4 coordinated Doppler Radars, the NMT fast scanning X-band radar located in Socorro and a surface network that included electric field meters near Langmuir Lab.
An example of the results from this project are presented in Fig. 28 for Aug 3, 1984, including measurements of electric field by Explorer, by SPTVAR and by the surface field mill near Langmuir Lab. Beginning at about 1242 electric field observations by the sailplane, SPTVAR, and at the surface near Langmuir Lab all show increases in association with new vertical growth of the cloud. The first lightning from the storm occurred near 1244 as shown by the first abrupt decrease in electric field observed by the surface field mill.
Dye et al., 1989 studied observations from 20 different storms from the New Mexico project and reported that electric fields inside these clouds showed negligible enhancement and did not exceed 1 kV m−1 until reflectivity at 6 km msl (about −10°C) exceeded approximately 40 dBZ and cloud tops exceeded 8 km. The onset of electrification occurred during or immediately after convective growth within these clouds.
Measurements from Aug 3, 1984, by SPTVAR (not shown) during a penetration at 7.0 km (-12 oC) showed that SPTVAR had passed through a small region of weak charge about 500 m in diameter at ~123430. See Dye et al (1988) for more information. This region of charge was in a transition zone between a region of downdraft containing ice particles and graupel into an updraft containing supercooled liquid water, and a substantial concentration of ice particles and graupel. These are precisely the conditions suggested by laboratory experiments to be necessary for charge separation by the non-inductive ice-graupel collision mechanism.
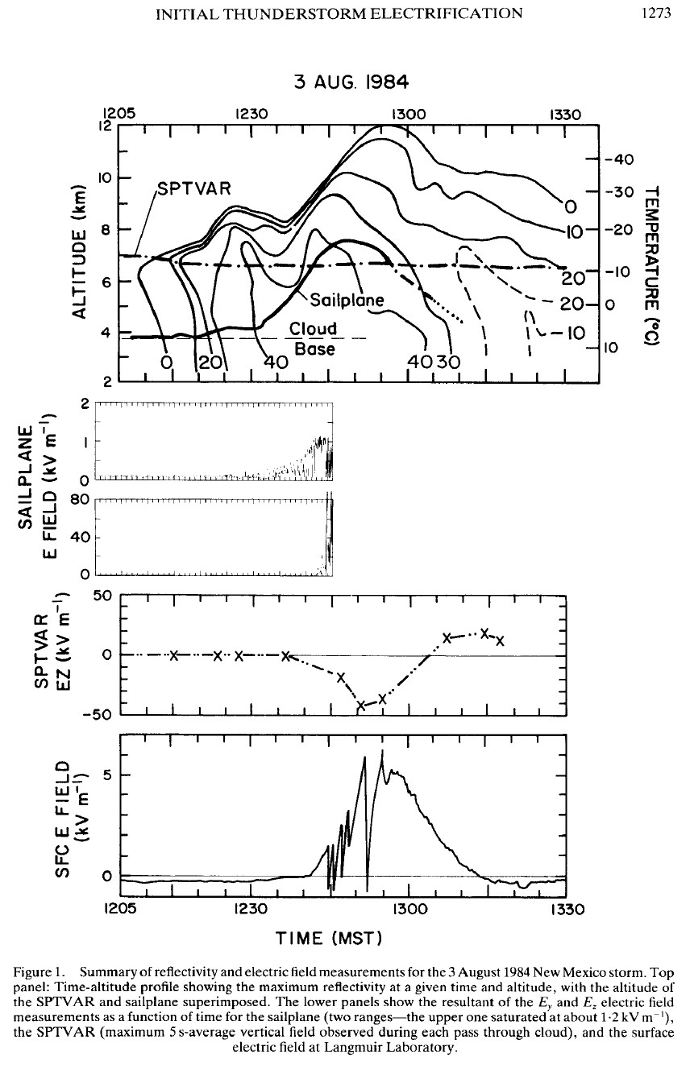
Fig. 28 A copy of Fig. 1 that appeared in Dye et al. (1989).
It’s very interesting that the electric field observed by SPTVAR was only about 600 V/m, yet significant charge separation was beginning to occur. The electric fields were not sufficiently large for the inductive charge separation mechanism to be effective, so these observations tend to rule out an inductive mechanism of charge separation between colliding graupel and ice particles. Few water drops were present. See Dye et al. (1989) for additional details.
Because the sailplane was making electric field measurement continuously inside the cloud, Dan Breed was able to closely examine the rate of increase of electric field strength and charge build-up in the cloud. If charge resided in a fixed location in the cloud, the motion of the sailplane towards or away from that charge would result in changes in the observed electric field strength. To determine the increases in observed electric field due to charge separation, the changes in electric field due to motion of the sailplane relative to the region of charge had to be compensated for. Results from Breed and Dye (1989) are shown in Fig. 29 for the 3 August 1984 case shown in Fig. 17 of the original publication. In the left plot in Fig. 29, the pluses shown the time history of measured electric field as the sailplane climbed in the cloud while the open circles show the result of motion of the sailplane away from a fixed charge at a fixed location.
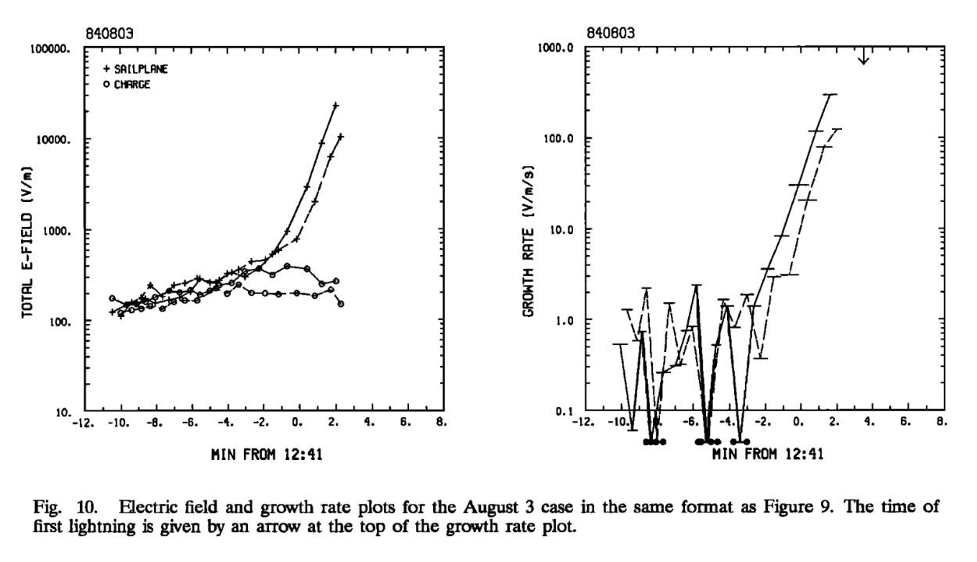
Fig. 29. Plots of observed electric field and the growth rate of electric field in the 3 August 1984 storm as originally presented in Fig. 10 of Breed and Dye (1989).
The figure shows that the slow buildup of observed electric field during the first 7 or 8 minutes of the plot mostly can be accounted for by the observed motion of the sailplane toward the charge, but then at time -2 to 0 min in the plot there is an abrupt increase in observed electric field. The rate in electric field growth determined from the measured electric fields in the right panel of Fig. 29 also shows the abrupt change in the rate of field growth at this same time. From this case and others presented in Breed and Dye there appear to be three phases in Explorer measured electric fields in New Mexico: initially a slow build-up of electric field probably due to early cloud growth that can largely be explained by the motion of the sailplane relative to the charge; a second stage with the exponential, rapid growth of electric field associated with the main surge in cloud growth; and third a plateau in the field growth rate at about 300 V-m1 s-1. See Breed and Dye (1989) for other cases and additional details.