NCAR Integrated Surface Flux Facility for CuPIDO (1 July - 31 Aug 2006)
This document describes the operation and measurements of the Integrated Surface Flux Facility (ISFF) during the Cumulus Photogrammetric, In-Situ and Doppler Observations field experiment (CuPIDO) - the 1 Jul - 31 Aug 2006. If you reached this page from a search engine, click here to see the full report, with frames.
See a more detailed experimental description here.
CuPIDO Links
- Site information (Excel)
- Directions to the 10 tower sites with map and travel times (MSWord)
- Site location map contoured with Tucson shown and roads(png)
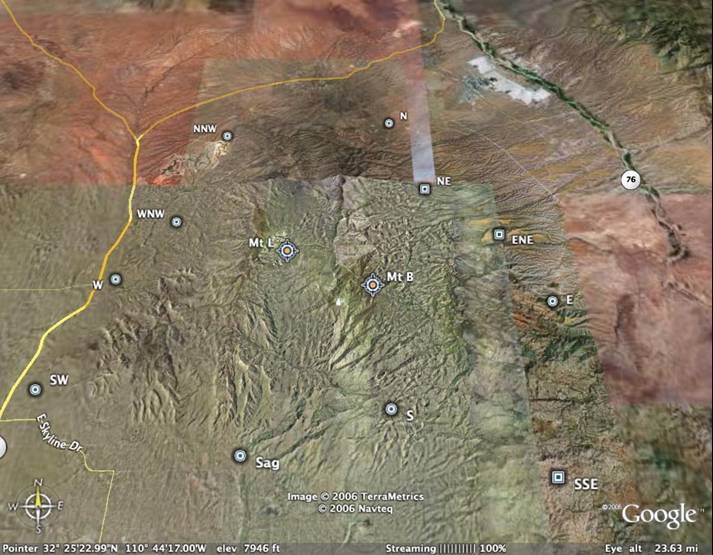
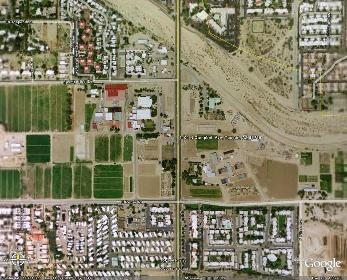
- Site location map - GoogleEarth view (jpg)
- NCAR Information for Landowners regarding towers (pdf)
- Joe Zehnder's CuPIDO cover letter
- Joe Zehnder, PI, CuPIDO Page
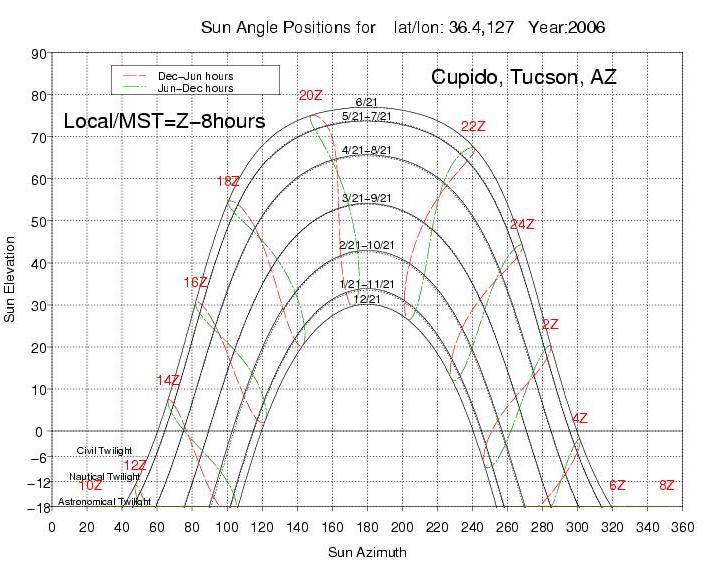
- Sun angle plot for Tucson
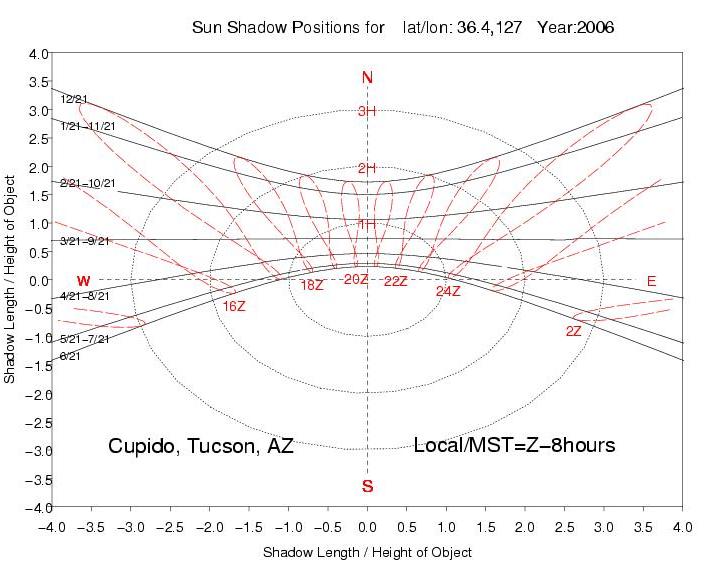
- Sun shadow plot for Tucson
- ASU CuPIDO Web page
- NCAR/EOL CuPIDO Field Catalog
NCAR EOL ISF ISFF Site Survey Information:
| Sept-05 | Photos | Notes: Militzer (text) | Notes: Horst (text) |
| Jan-06 | Photos | Notes: Poulos (Word) | |
| Photos | Site Photos | Desert Life&Landscape | AirSpaceMuseum |
Field Logbook
A computer-readable field logbook of comments by NCAR and other personnel is available in raw text format.
Schedule/Logistics
See schedule and logistics here.
CuPIDO Measurement Sites
Directions to the 10 tower sites with map and photos (MSWord)
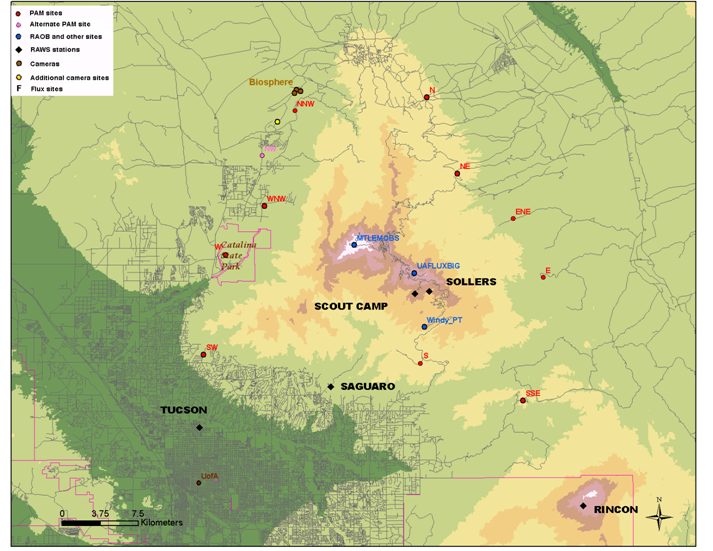
A Map of all ISFF PAM and ISFF tower site locations.
Table of Sites
Click on the site number to get a more specific description of a given site. Site order by elevation is: 7, 8, 9, 10, 4, 3, 5, 1, 2, 6.
| Station # |
Station ID and Name | Latitude (deg N) |
Longitude (deg W) |
Elevation m (feet) |
|---|---|---|---|---|
| 1 | N - North - Campo Bonito | 32° 34.303' | 110° 42.401' | 1305 (4362) |
| 2 | NE - Northeast - Stratton Canyon | 32° 30.243' | 110° 40.772' | 1365 (4560) |
| 3 | ENE - East Northeast - Davis Mesa | 32° 27.855' | 110° 37.400' | 1234 (4120) |
| 4 | E - East - Lone Hill | 32° 24.716' | 110° 35.517' | 1141 (3812) |
| 5 | SSE - South-southeast - Bellota Ranch | 32° 18.200' | 110° 36.709' | 1270 (4244) |
| 6 | S - South - Bug Springs | 32° 20.440' | 110° 42.897' | 1500 (5011) |
| 7 | SW - Southwest - Pusch Ridge, Archery site | 32° 21.328' | 110° 57.526' | 840 (2805) |
| 8 | W - West - Catalina | 32° 25.928' | 110° 55.331' | 853 (2852) |
| 9 | WNW - West Northwest - Golder Ranch | 32° 28.711' | 110° 53.026' | 961 (3210) |
| 10 | NNW - North Northwest - Rancho Solano | 32° 33.661' | 110° 51.172' | 1044 (3490) |
Instrumentation
- Layout of the Basic towers (N, E, S, SW, W, WNW and NW) in PDF format.
- Layout of the ENE and SSE flux towers with 180 degree sonic orientation PDF format.
- Layout of the NE flux tower with 135 degree sonic orientation PDF format.
- Layout of the NNW flux tower with 210 degree sonic orientation PDF format.
A total of 128 meteorological variables will be recorded by the ISFF team on behalf of CuPIDO's scientific goals. Each of the 10 tower sites is 10 m in height and they are outfitted as follows:
- All 10 towers have a basic set of meteorological instrumentation: 1 Hz temperature/RH/wind direction/windspeed/barometric pressure/net radiation, and a tipping-bucket precipitation gauge. T/RH, net radiation and P are at 2 m agl while the anemometer is at 10 m agl. Each site will have GOES satellite communication of 5 minute average quantities if the GOES satellite is available. See pressure measurement references for the Vaisala PTB220B, barometer and the single-disk static pressure port
- The four flux tower (ISFF) sites (NE, ENE, SSE and NNW) will each be outfitted with a single Campbell CSAT3 thermosonic anemometer) at 7 m (mean winds, momentum and sensible heat fluxes); a Campbell KH2O Krypton hygrometer at 7 m (water vapor fluxes), located ~25cm behind each of the CSAT3s. Each flux site also has a "darkhorse" radiometer stand with 4-component radiometers of type Epply PSP and PIR. Located near this stand are the soil sensors: heat flux (5cm), soil temperature (2-8cm), soil moisture (5cm), and soil properties (5cm). In addition a LiCor model 7500 which measures fast-response CO2 and H20 will be placed at the SSE site (which requires the use, due to its weight, of a Rohn tower, rather than a PAM mast.
Data Collection Notes
This is the 2nd use of the Viper-based PC104 data systems (NIDAS, from which the HIAPER data system is derived), running the new data acquisition code for primary data acquisition. This is the first deployment of NIDS with the new GOES satellite transmit channel, 5 minute average data creation and near-real-time transmission. Online data plots will be available (dependent on GOES transmissions) and updated in ~30 minute increments. This is the first time 10 towers have been deployed with the NIDAS data acquisition system.
- The ISFF base trailer will be located ~ 9 miles NW (and 20 minutes) of the Residence Inn at the University of Arizona Agricultural Research Station
The UA Agricultural Research Station at 4101 N. Campbell Ave., Tucson, and location of the ISFF Base Trailer. The base trailer is located on the west side of the large white buildings near the center of the image (enter from the south gate).
Sensor Notes
General note
All data coming from sensors that were on the main mast will be removed from the NetCDF files while the mast was down or in the case of site 5, when there was an individual on the tower.
Sonic Anemometer
The sonic anemometers generally worked properly. Tilt corrections were applied to stations 2, 3, and 10, and station 5 was left untouched.
There were the usual bad values expected when rain affected the sensor, which is characterized when a drop of rain covers one of the 0.5 cm diameter transducers. Although no data was removed from the NetCDF files for the rain cases, very good indicators of quality of the data during these rain events can be viewed by plotting either uflag.7m, vflag.7m, wflag.7m, and tcflag.7m, which are fractions of the points that are detected as spikes. Also, one can plot diag.7m, which indicates the sonic detected a problem. Click on this link: sonic manual and look at pages 11 & 12 for a more detailed description. Lastly, one can plot samples.sonic, which indicates the amount of samples recorded in a 30 minute period, which should be 18,000 points. Anything less may indicate a problem associated with rain.
Please use the "Height.Site" link to view the tilt plots
| Height.Site | Boom Angle | Actual Height (m) | Lean (deg) | Lean Azimuth (deg) |
|---|---|---|---|---|
| 7m.ne | 135° | 7.0 | 2.9 | -179.3 |
| 7m.ene | 180° | 7.0 | 1.7 | -48.3 |
| 7m.sse | 180° | 7.0 | 0.2 | -34.5 |
| 7m.nnw | 210° | 7.0 | 2.0 | -78.3 |
All sonics will report at 60sps to minimize the influence of pulse-sequence delay errors on the 20Hz fluxes.
Krypton Hygromter
The krypton hygrometers generally worked properly. Any spikes in the data associated with cleaning the sensor will be removed from the NetCDF files. During rain events, the sensor voltage was too low to be reliable, so those data will be removed from the NetCDF files too. There are also a few obvious outlying points that will be removed, reasoning for those outliers has not been established.
Values of sensible and latent heat flux derived from the measured sonic w, virtual temperature, and krypton hygrometer will be added to the NetCDF files.
Infrared Gas Analyzer LICOR-7500
The open path licor generally worked properly other than expected bad values during rain events. Removing co2 data when the krypton hygrometer had a voltage reading at or below 0.01V removed the vast majority of the rain cases. One other unknown outlier was removed too. We have yet to implement a Webb correction to remove humidity artifacts.
Prop-vane Anemometer
The prop-vane anemometers generally worked properly. There was in issue at station 3, where the starting threshold was too high because of a problem with a tight bearing. The issue seemed to have surfaced in mid July and got progressively worse until the sensor was replaced at 16:25 MST on August 9, 2006. Because of that problem, the user should be cautious in using low windspeed values from the prop-vane anemometer during that period. One option is to use the values coming from the sonic anemometer at station 3. There are still some outstanding issues concerning boom angles, so the quality control process is not yet complete.
Temperature/Relative Humidity
The sensor generally worked properly. There were two instances where the sensor was pegged to full scale possibly because the A/D got stuck somehow, so that data will be removed from the NetCDF files. They occured during the following periods:
- Station 4: August 20, 16:25 - August 21, 14:30
- Station 5: July 19, 18:15 - July 21, 12:29
There were also a few instances (~13 total for all 10 towers) when rain infiltration, tower maintenance periods, or unknown reasons caused unrealistic values in the data, those too will be removed from the NetCDF files.
Surface Temperature
The sensor generally worked properly. There were a few instances (~4 total from 4 flux towers) when rain or unknown reasons caused unrealistic values, those values will be removed from the NetCDF files.
Note: The surface temperature sensor at Station 2 was aimed away from a large mesquite bush to a more representative spot on the ground at ~15:45 on July 14.
Barometer
The sensor worked properly.
Rain Gauge
The rain gauge generally worked properly. False rain tips were performed throughout the project to insure that the sensor was working properly, these false rain tips will be removed from the NetCDF files.
Radiometers
The radiometer generally worked properly. There were various times when cleaning or releveling the sensor affected the data, those bad data will be removed from the NetCDF files. There were also a few instances (~13 total from all towers) in which electrical shock, a loose connection, cable being chewed by cows, or yet undetermined reasons caused the removal of some data from the NetCDF files. In addition, a new net radiometer was installed on August 10, 2006, at station 1, because the previous one was affected by electrical shock. This caused a slight descrepency in the data. If looked at closely, when comparing the net radiation values at station 1 to station 10 (the station with the closest proximity to station 1), one can see that the nighttime values at station 1 are slightly lower (more negative) than station 10 for the remainder of the project. This could be a result of a slightly different nighttime calibration of the newly installed net radiometer (click on this link for an example plot) , but that is only a speculation.
Longwave radiation values calculated from the measured Rpile, Tcase, and Tdome values will be added to the NetCDF files. (Note that the Kipp\&Zonen pyrgeometers do not have Tdome sensors.)
The wind speed correction recommended by Campbell Scientific for the net radiometers will be implemented.
Soil Sensors (soil temperature, soil heat flux, soil moisture, soil thermal properties (TP01))
Soil Temperature:
The sensors generally worked properly. At station 5, a data glitch appearing from approximately June 27 - July 2 caused one unrealistic point every three hours, those points will be removed from the NetCDF files.
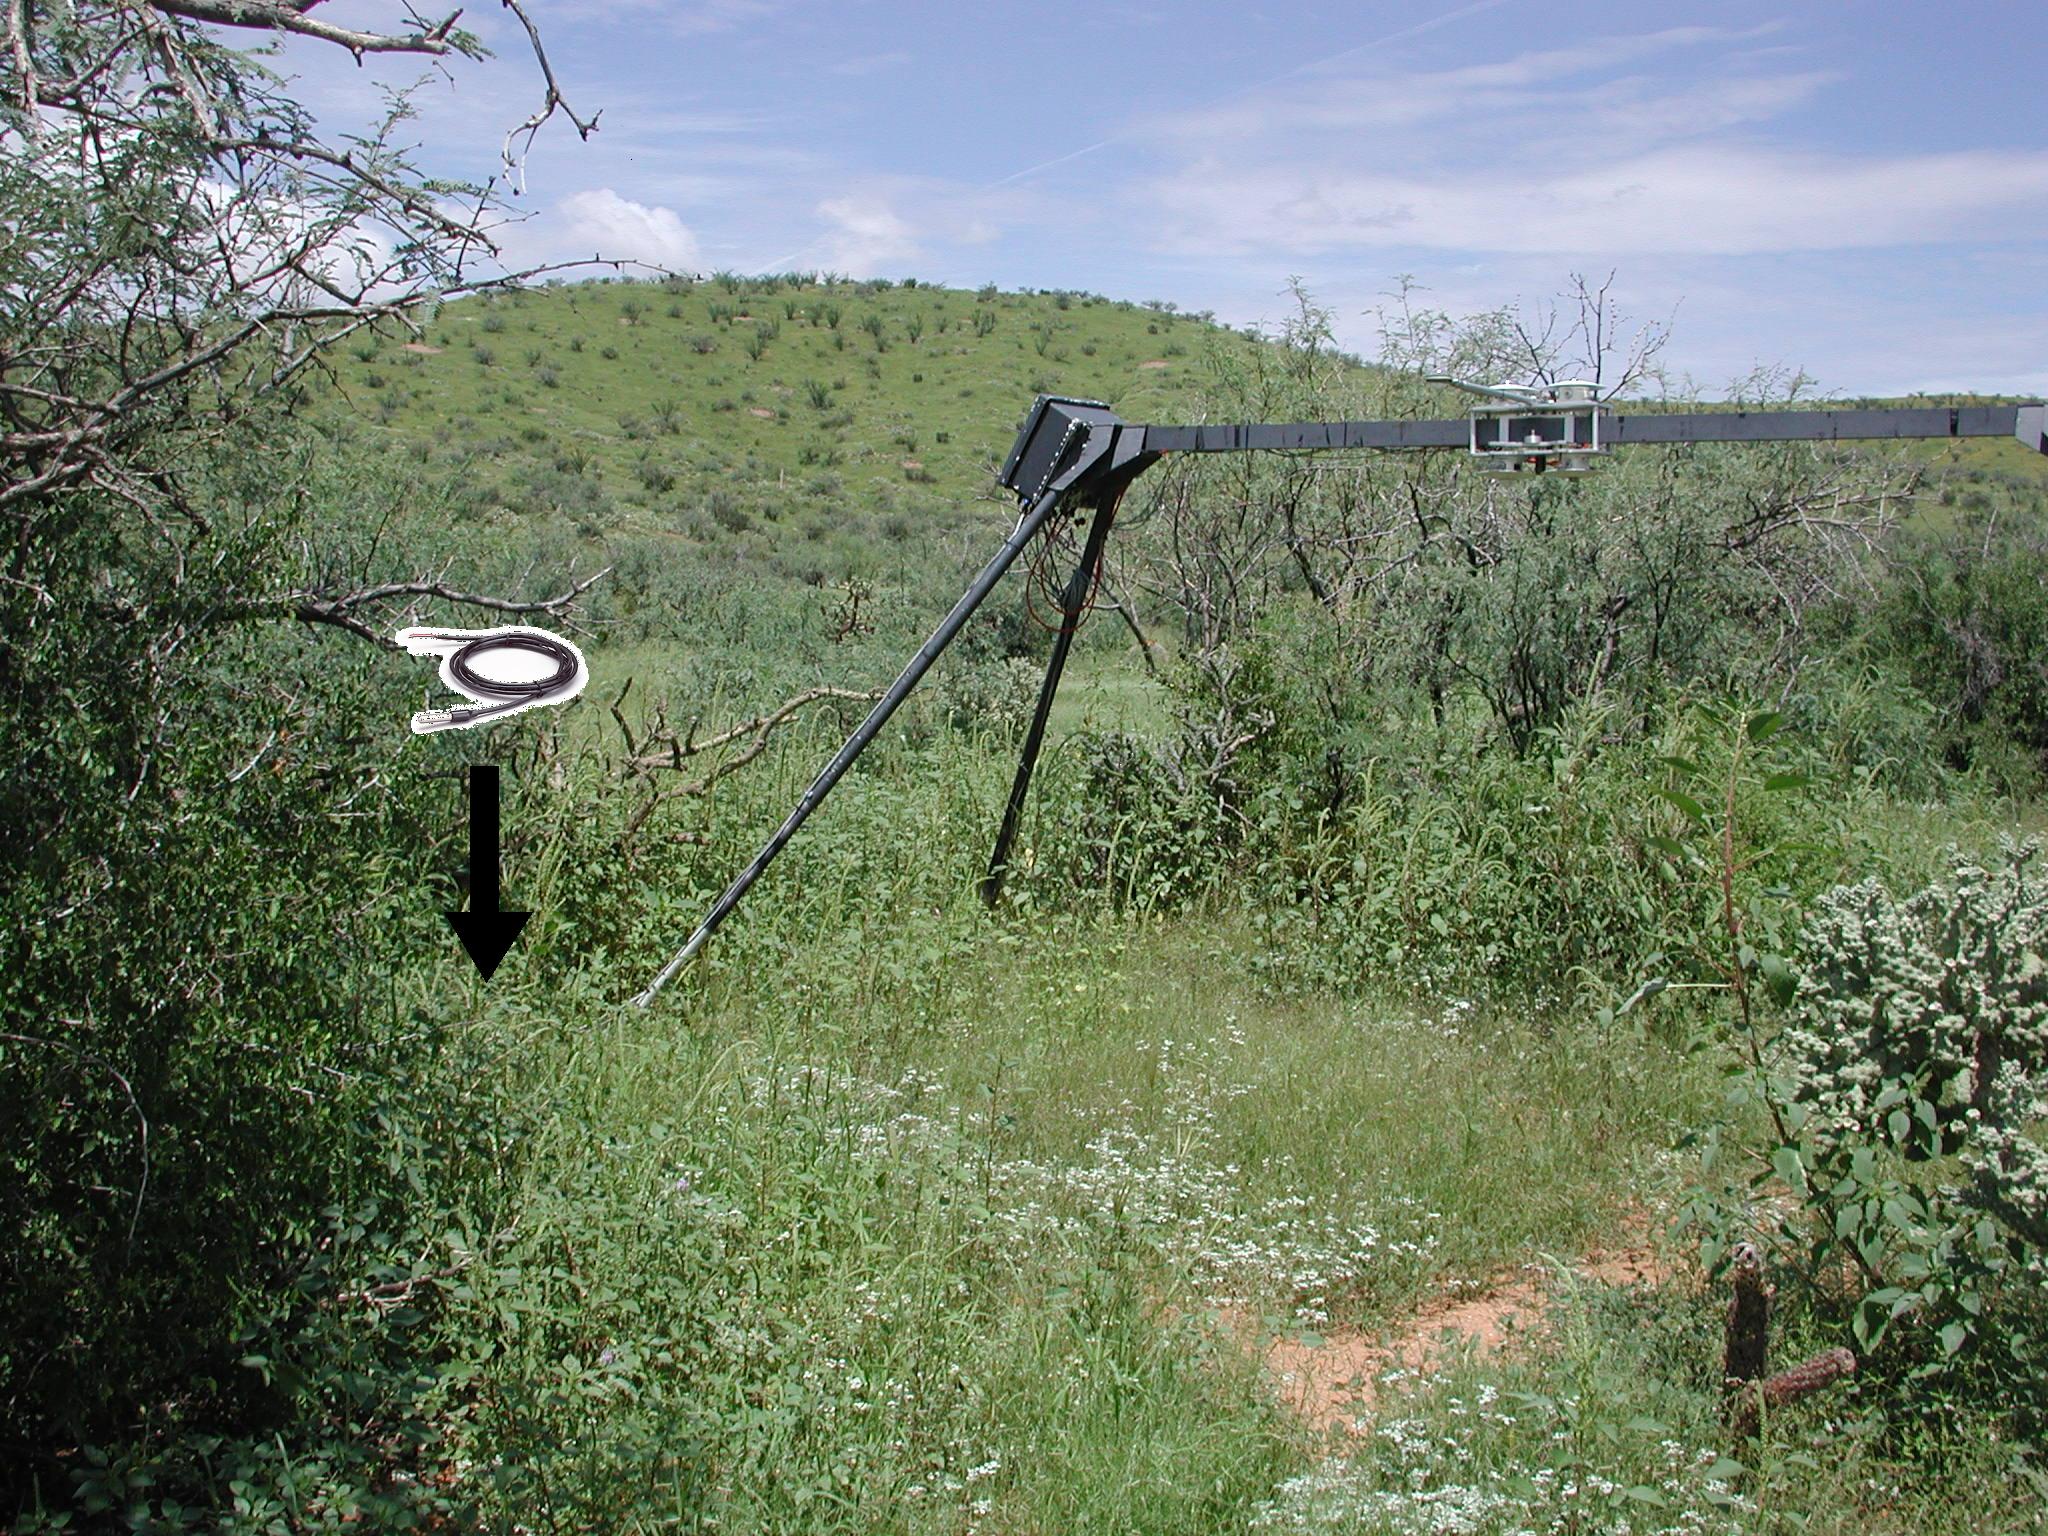
At station 10, after the first significant rainfall event on July 26th overnight, the soil temperature signal began to gradually attenuate and level off for the rest of the project. Here is a link to a plot at station 10: Tsoil vs. T . We presume this was caused by abundant grass growth having an insulating effect on the area around the soil temperature sensor. The grass didn't allow direct sunlight (shortwave radiation) to conduct effectively into the soil to warm it up during the day and didn't allow nighttime diffuse radiation (longwave radiation) to effectively exit the soil and cool it down at night in a "greenhouse" type effect. Please follow the links below for examples of before and after pictures illustrating the abundant grass growth after the first significant rainfall.
- before significant rainfall (with approximate location of sensor)
- before significant rainfall
- after significant rainfall
- after significant rainfall (with approximate location of sensor)
Soil Heat Flux:
The sensors generally worked properly. There were a few instances (~7 total from 4 flux towers) when unknown reasons caused an unrealistic spike in the data, those will be removed from the NetCDF files. At station 5, a data glitch appearing from approximately June 27 - July 2 caused one unrealistic point every three hours, those points will be removed from the NetCDF files. At station 3 and 10, data glitches occuring at nighttime because of problems with the wireless Xbee dropping characters is in the process of being quality controlled. The approximate time when these data glitches occurred are as follows:
- Station 3: June 26 - July 16
- Station 10: June 29 - July 13
Soil Moisture:
The sensors generally worked properly. All four sensors are currently being calibrated to soil specific conditions to reduce any errors associated with associated soil properties. There were a few instances(~3 total from 4 flux towers) when unknown reasons caused an unrealistic spike in the data, those will be removed from the NetCDF files. At station 5, a data glitch appearing from approximately June 27 - July 2 caused one unrealistic point every three hours, those points will be removed from the NetCDF files.
Soil Thermal Properties (TP01):
The sensor worked properly.
Values for the soil heat capacity, thermal diffusivity, and thermal conductivity derived from the raw TP01 readings will be added to the NetCDF files.
GOES Communications
Each station transmits a message every 5 minutes, on channel 95 of GOES East, in its own time slot, specified by an offset in seconds after the start of each 5 minute interval. Basic stations send 46 bytes of data, which takes about 5 seconds at the GOES RF baud rate of 100 bps. Flux stations send 162 bytes (~16 seconds), and the Flux/CO2 station (SSE) sends 182 bytes (~18 seconds).
Station GOES Id Transmission
Offset (sec)Transmission
Length (sec)1 3640C550 165 5 2 3640D626 30 16 3 364102B4 60 16 4 3641372E 90 5 5 36417424 120 18 6 3641A24C 150 5 7 3641B13A 180 5 8 3641D4DC 210 5 9 3641E146 240 5 10 3641F230 270 16 Data Tables and Plots
Click on the above link to view tables and plots.
The tables display mean, deviation, number of missing values, and number of clipped values for each variable, from 0:00-6:00, 6-12:00, 12-18:00 and 18-24:00 each day.
The 5 minute statistics for most variables are shown on time-series plots.
Data Download
The NCAR data are available for download in the following forms:
- 5-minute statistics in ASCII (.txt) form (via a Java Applet).
- 5-minute statistics in NetCDF form
We will also have a Table of Variables available in these files.
Photographs


