HIPPO 2
HIAPER Pole to Pole Observations 2 (HIPPO-2)

The "Collaborative Research: HIAPER Pole-to-Pole Observations (HIPPO) of Carbon Cycle and Greenhouse Gases Study" measured cross sections of atmospheric concentrations approximately pole-to-pole, from the surface to the tropopause, four times during different seasons over a 2 year period. A comprehensive suite of atmospheric trace gases pertinent to understanding the Carbon Cycle was measured. HIPPO transected the mid-Pacific ocean and returned either over the Eastern Pacific, or over the Western Atlantic. The program provided the first comprehensive, global survey of atmospheric trace gases, covering the full troposphere in all seasons and multiple years.
This phase of the HIPPO project is the second one of five. HIPPO Global Phase I took place in January 2009; Phase III took place during April 2010.
To accomplish the objectives of the second phase, the NCAR G-V flew the following missions:
- Rocky Mountain Metropolitan Airport, CO, USA -> Anchorage, AK, USA
- Anchorage, AK to the North Pole (up to 85 degrees North) round trip
- Anchorage, AK, USA -> Kona, Hawaii, USA
- Hilo, HI, USA -> Rarotonga, Cook Islands
- Rarotonga -> Christchurch, NZ
- Christchurch, NZ -> South Pole (up to 67 degrees South) round trip
- Christchurch, NZ -> Honiara via Wollongong, Australia
- Honiara -> Kona, Hawaii
- Kona, Hawaii -> Anchorage, AK
- Anchorage, AK -> Jeffco
This 45,900 km long route differs from the Phase 1 route, which went via Eastern Pacific and had stopovers in Tahiti, Easter Island and Costa Rica. Images below show the actual flight tracks; the last hour of each flight track is shown in red. Earth images are courtesy of Google, GoogleEarth project.
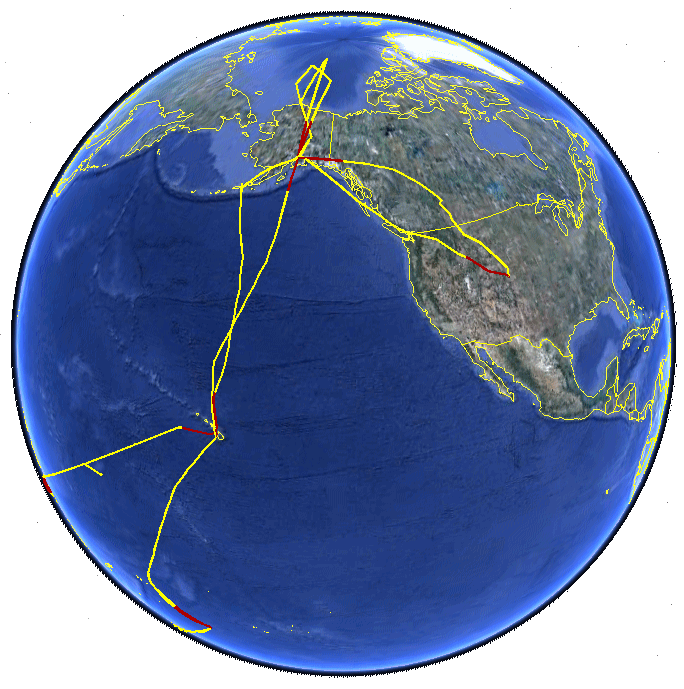
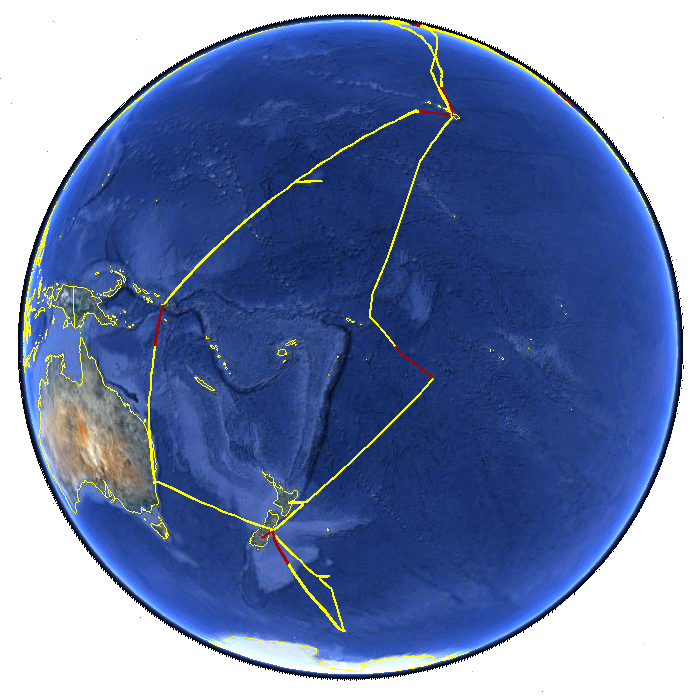
All of the flights were essentially direct point-to-point routes with ongoing altitude changes. It was planned to have two maximum altitude ascents per flight, one in the first half and one in the second half, depending on the ability of the ATC to support altitude changes. Most of the flight was conducted below RVSM (usually 28,000 ft) in order to allow the G-V to go up and down constantly to collect data at different altitudes throughout the troposphere. Ideally the flight would take off and go to FL430 for 15 min, then descend below RVSM and proceed in a sawtooth pattern between FL270 and FL100 with a 1,500 ft/min climb/ascent rate, then climb to FL450 near the end of the flight for about 15 min, descend and proceed to the airport.
All flights were followed by at least one no-flight, maintenance day and may be followed by a rest day ("hard down" day); see the flight reports table for details.
Principal Investigator:
Steve Wofsy Harvard/SEAS
swofsy AT seas.harvard.edu
Project Manager:
Pavel Romashkin NCAR/EOL/RAF
pavel AT ucar.edu
EOL Data Management:
NCAR/EOL/DMS
eol-archive AT ucar.edu
CDIAC Data Management:
Les Hook CDIAC/ORNL
hookla AT ornl.gov
Principal Investigator:
Steve Wofsy Harvard/SEAS
swofsy AT seas.harvard.edu
Project Manager:
Pavel Romashkin NCAR/EOL/RAF
pavel AT ucar.edu
EOL Data Management:
NCAR/EOL/DMS
eol-archive AT ucar.edu
CDIAC Data Management:
Les Hook CDIAC/ORNL
hookla AT ornl.gov