ISFS Measurements
AABC Main Tower
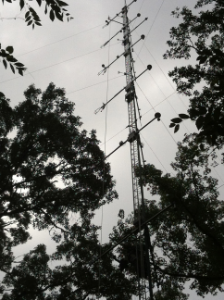

The main tower at the AABC site was a 45m (150') Rohn tower for in-situ flux and gradient measurements within and just above the deciduous forest.
The position of this tower was: 32.69456 deg (32 deg 41' 40.42") N, 87.2488 (87 deg 14' 55.68") deg W.
The following table lists the sensors on the tower.
| Height | Location | Sonic | TRH | Fast Scalar | Radiation, Wetness | Inlet | Other |
|---|---|---|---|---|---|---|---|
| 43.9m | Above canopy | CSAT | NCAR | Li7500 | gradient+fast | Pnano | |
| 41m | KZ CNR4 radiometer, Wetness | ||||||
| 38m | CSAT | NCAR | CSI IRGA | gradient | WWWcam | ||
| 32m | Canopy top | CSAT | NCAR | Li7500 | PAR, Infrared temp (Tsfc), Wetness |
gradient | Pnano |
| 26m | Bottom of crown | CSAT | NCAR | Li7500 | PAR, Infrared temp, Wetness |
gradient | |
| 20m | Trunk space | CSAT | NCAR | Li7500 | PAR, Infrared temp, Wetness |
Pnano | |
| 13.9m | Trunk space | CSAT | NCAR | Krypton | PAR, Infrared temp, Wetness |
gradient | |
| 8m | Top of subcanopy | CSAT | NCAR | Li7500 | PAR, Infrared temp. Wetness |
Pnano | |
| 2m | Close to surface | CSAT | NCAR | Krypton | gradient |
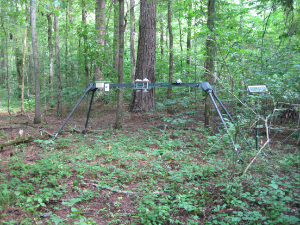
Radiation and Soil Measurements Near Main Tower
| Location | Instrumentation |
|---|---|
| Radiation stand | Up and down looking Kipp and Zonen pyrgeometers |
| Up and down looking Kipp and Zonen pyranometers | |
| SPN1, up-looking diffuse and global pyranometer | |
| Wetness | |
| Soil sites "a" and "b" | 4 soil temperatures from 1-5 cm |
| Decagon EC-5 soil moisture, | |
| REBS heat flux plate | |
| TP01 soil thermal properties | |
| Near radiation stand | Tipping bucket rain gauge |
AABC SODAR ("pond") Site
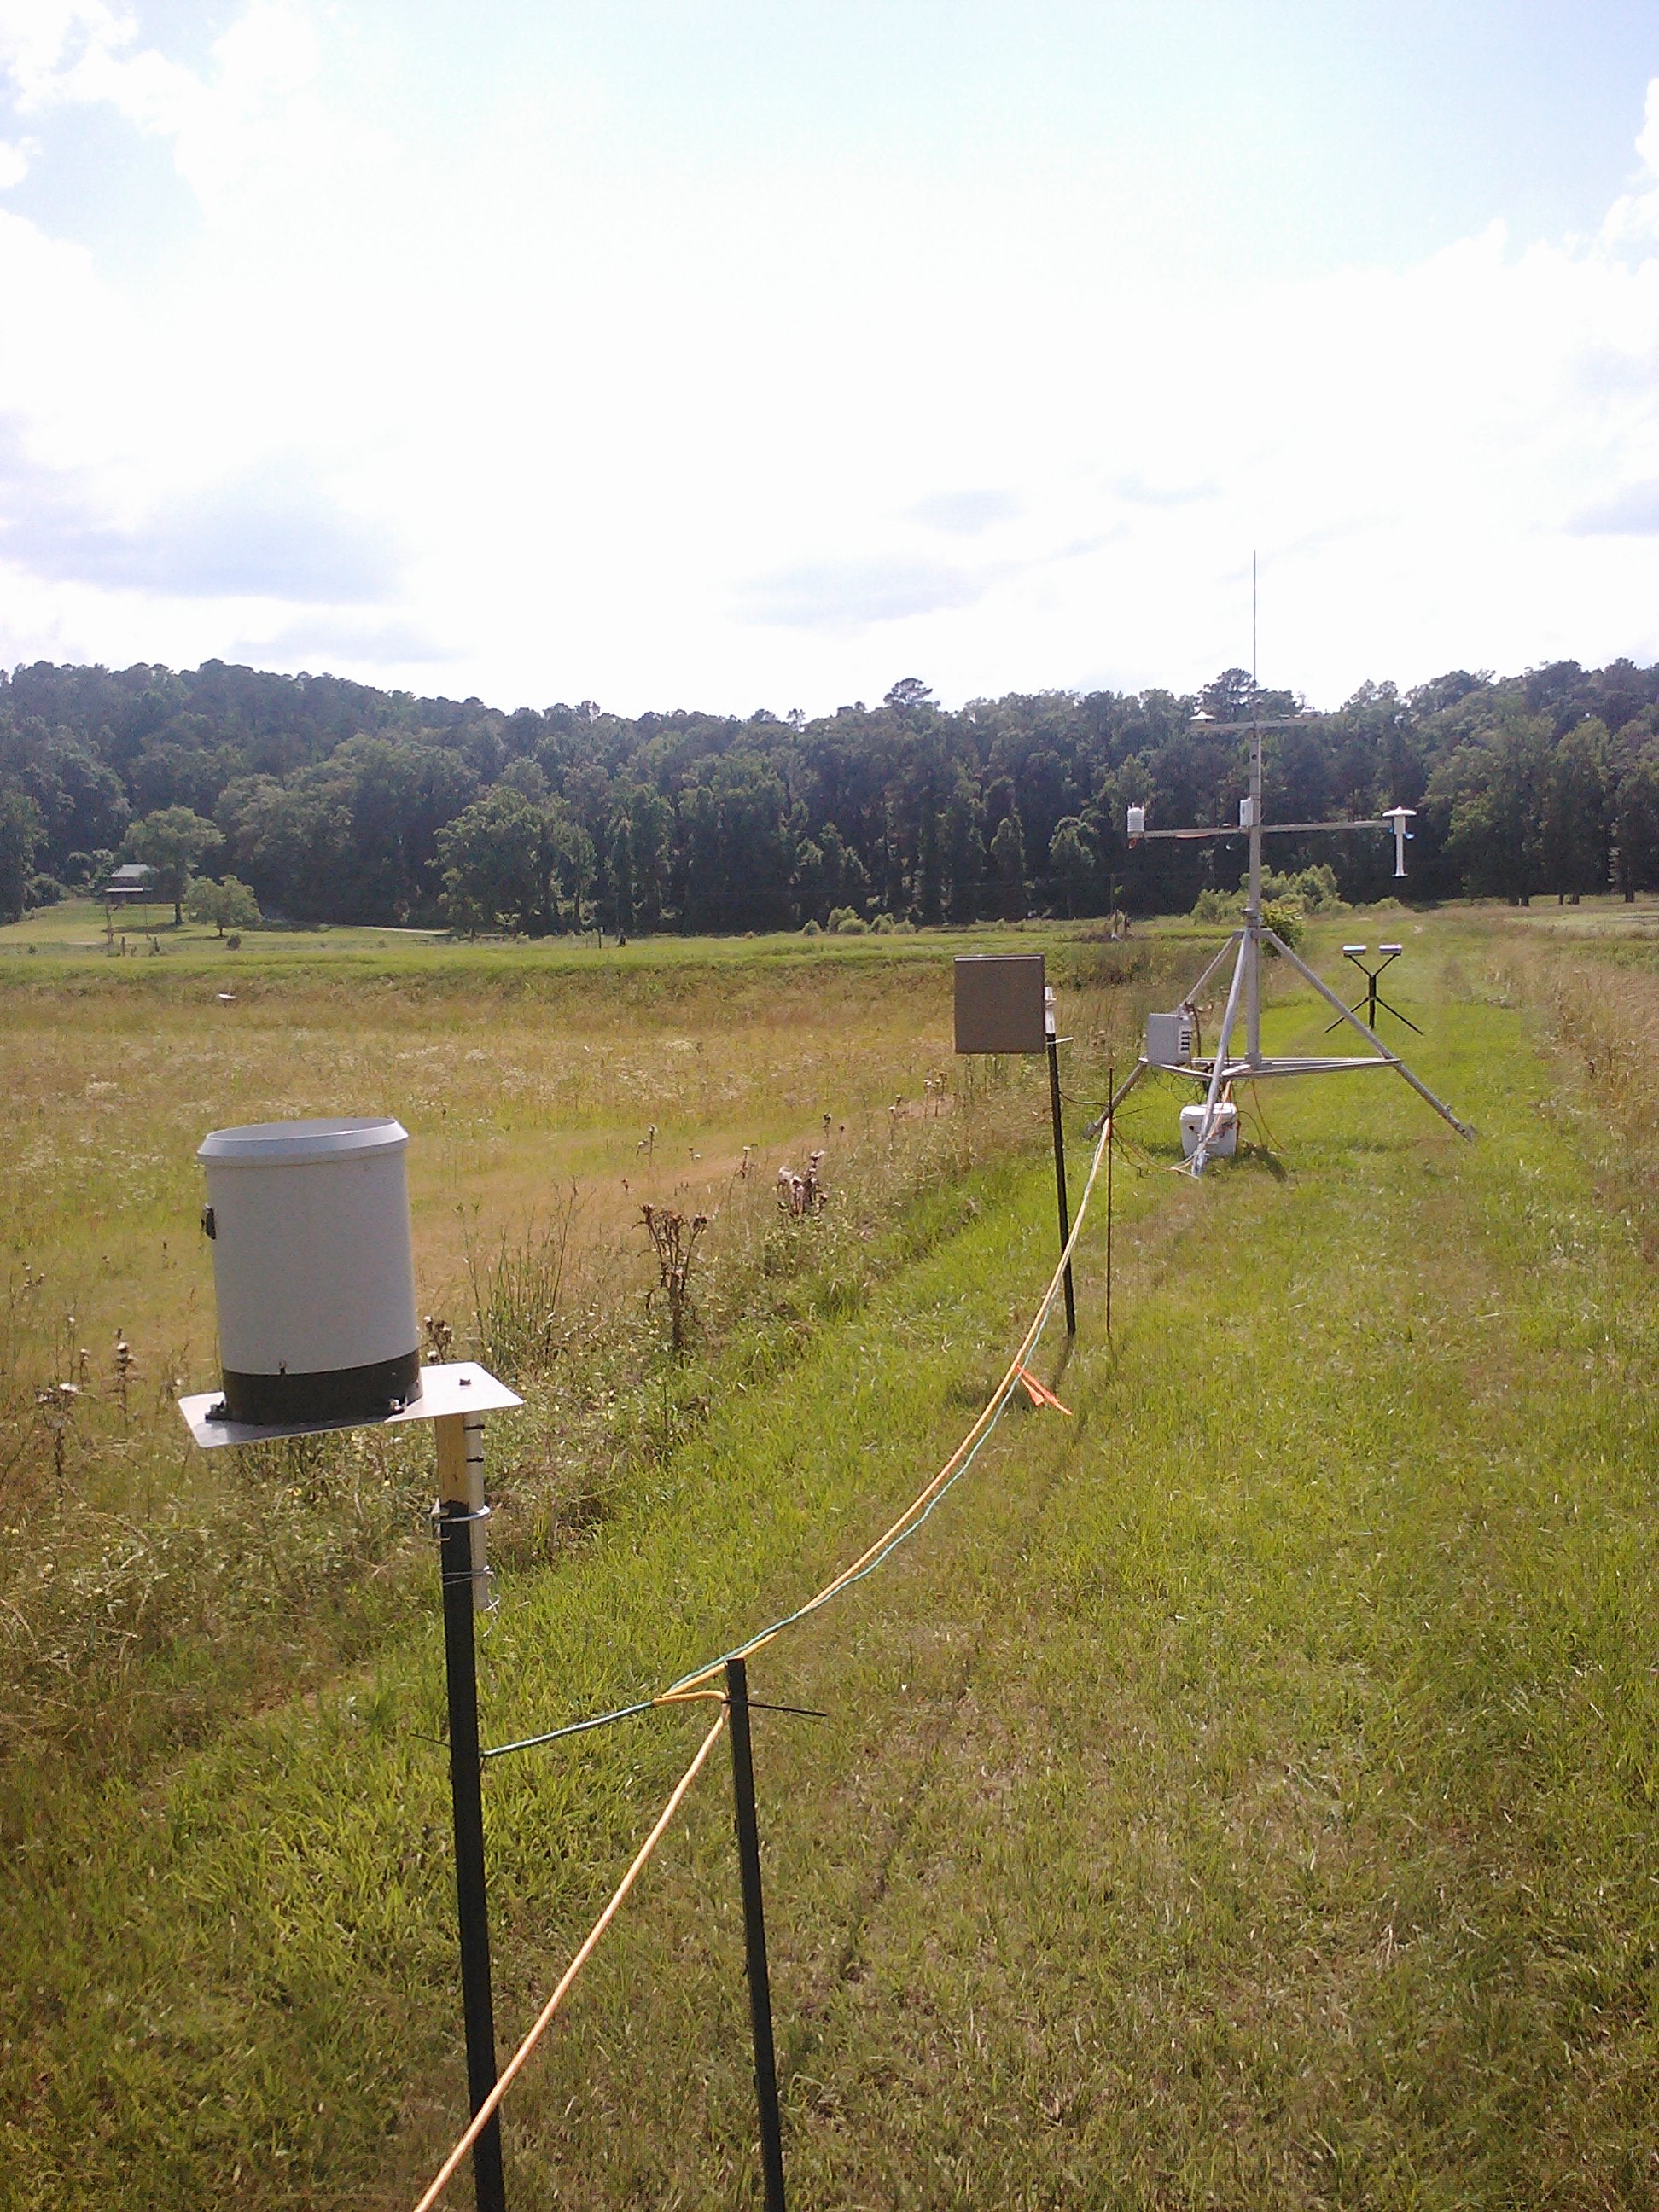
The pond site was near where the SODAR was deployed.
| Height | Location | Met | TRH | Radiation | Precip |
|---|---|---|---|---|---|
| 0-3m | pond site, near SODAR | WXT | NCAR | Rsw.in, SPN1, Wetness | TB4 Tipping Bucket OTT Parsivel optical disdrometer |
Field Logbook
A computer-readable field logbook of comments by NCAR and other personnel is available.
Plots and QC Tables
These quicklook time series plots and tables were created during the field phase of the project.
Data Download
The following data are available for download:
| Name | Information | Download Link |
|---|---|---|
| 5 minute means and covariances | https://www.eol.ucar.edu/content/5-minute-isfs-data-soas | https://doi.org/10.5065/D6FB514H |
| 30 minute means, covariances and computed fluxes | https://www.eol.ucar.edu/content/30-minute-isfs-data-soas | https://doi.org/10.5065/D6K35RVF |
| high rate values from 45 meter tower | https://www.eol.ucar.edu/content/high-rate-isfs-data-soas | https://doi.org/10.5065/D69K48F7 |
Data Quality Notes
Meteorology
Rainr
Some data needed to be removed from certain sensors due to either misconfiguration or debris blocking the device from operating properly. These dates/times can be found under the Logbook heading, "Rain Gauge Comparison Results," as entered on June 30th.
TRH & P
Temperature and Relative Humidity data were checked mostly on a basis of agreement within the profile of heights between sensors. Some edits pertained to the sensors malfunction or servicing and can be found as noted in the logbook; notably were a couple instances where the sensor needed to be reset to revive irregular fan operation on June 2nd and July 8th/9th.
3D Sonic Anemometers
The sonic anemometers generally operated normally, though data were bad when water was on the transducers. These events were detected by internal diagnostic flags. Data (sample by sample) when these flags were triggered have been removed.
(Virtual) temperature measured by the sonic anemometers can have small offset and gain errors. These have been corrected by a linear fit to slow-response temperature and relative humidity sensors.
See: PDF of Correlation Plots for 'Tc' versus 'tc'.
| Height | Offset | Gain | 'rms' value |
|---|---|---|---|
| 2m | 1.31 | 0.999 | 0.16 |
| 8m | 1.13 | 0.991 | 0.14 |
| 13.9m | 1.19 | 1.006 | 0.11 |
| 20m | 0.92 | 0.986 | 0.17 |
| 26m | 0.86 | 1.013 | 0.11 |
| 32m | 0.61 | 1.020 | 0.17 |
| 38m | -0.56 | 0.997 | 0.15 |
| 43.9m | 0.75 | 1.008 | 0.11 |
The U and V componets of the wind vectors from the 3D sonic anemometers have been rotated from instrument coordinates to geographic coordinates, where +U is wind TO the east, +V is wind TO the north. These rotations are based on anemometer array azimuth angles measured during field operations.
The wind vectors have not been corrected for any tilt of the anemometers.
Fast Scalars
Fast Water Vapor from Licor 7500s, Kryptons and CSI IRGA
Data for the Kryptons at 2 & 13.9 meters were verified based on a collaboration of several metrics. The most pertinent was the presence of moisture on the sensors which could be quantified using data from the closest Wetness sensor as well as the fluctuations in the Kryptons own voltage reading; any voltages dropping below a threshold of 0.1 Volts were marked as suspect and edited as necessary. Reinforcing this, the convergence of the closest H2O measurement with its calculated relative humidity set to 100% also served as a good indicator for the Kryptons performance. Whenever the Krypton measurements exceeded those saturated values they were removed from the dataset. Also removed from the dataset were any times (as noted in the logbook) when personnel were climbing the tower.
CO2 from Licor 7500s, CSI IRGA
The data for these sensors were edited to remove any times in which the tower or sensors were being serviced throughout the project. A few instances were removed when the sensors were malfunctioning during a wetness event, but for the overall breadth of the project, instances of wetness events were maintained in the data.
Soil Sensors
Gsoil
One REBS heat flux plate was installed at each of the soil a and b sites at a depth of 5cm. Both appear to have functioned normally.
Tsoil
The experiment started out with a 4-depth soil temperature probe at each of the a and b sites. Failures of these probes during the experiment caused several actions to be taken:
"Tsoil.4.4cm.a" failed on June 8th at 17:00. Another soil sensor ".a2" was installed near the location of ".a" on June 14th at 19:00 and operated well for the rest of the experiment. After this date, ".a2" data have been relabled as ".a". The ".a2" probe shows less daily variability than ".a", so derived soil heat storage values will decrease after this date.
The entire ".b" probe stopped reporting 15 Jun, possibly due to rain infiltration into a connector. The probe fixed itself later in the day. Some data injected from a spare probe in the air during the debugging process have been removed.
"Tsoil.4.4cm.b" failed on 17 Jun 14:20. Questionable data also appears on "Tsoil.3.1cm.b" at this time and have been removed. A new probe was installed on 23 Jun, but was allowed to settle for 24 hours before being connected on 24 Jun 10:55. Data taken during the overlap were within 0.1 degC, so no calibration adjustment was needed.
There are at least 2 downward "spikes" on Tsoil.0.6cm.b that appear to be real and likely associated with rain infiltration into the soil.
Qsoil
One Decagon EC-5 soil moisture probe was installed at each of the soil a and b sites. During the field phase, 4 sets of gravimetric samples were taken to check the EC-5 calibrations. The variability of soil moisture was small between these samples, so it was not possible to determine a gain correction. Both probes appeared to read low by about 8% volumetric soil moisture. An adjustment for this offset has been included in the final data set.
The first rain event of the experiment was on the night of 1 June. This event appears to have "seated" the probes in the soil. Data prior to this event do not appear to represent the true state of the soil and have been removed.
Soil thermal properties
Hukseflux TP01 heat capacity probes also were installed at each of the soil a and b sites. However, both probes accidentally were installed oriented horizontally. Due to this orientation, high values for heat capacity, thermal conductivity, and low values of thermal diffusivity were measured after rain events, caused by water pooling on the probes. These anomolous values persisted from 3--21 hours after the event. Since these values do not represent the true state of the soil, they have been removed (using a limit check) in the final data set.
As with Qsoil, data prior to the rain event on 1 June have been removed in the final data set.

