METCRAX
Meteor Crater Experiment
Overview
Meteor Crater Experiment (METCRAX) is a NSF research program to investigate the structure and evolution of temperature inversions or cold-air pools that form on a daily basis in topographic basins and valleys. One phase of this research will be a one month long field experiment to be conducted in October 2006 in Arizona's Meteor Crater; a simple, near-ideal, topographic basin formed by the impact of a meteor. In this basin, the physical processes leading to the buildup and breakdown of temperature inversions and the formation of atmospheric seiches (atmospheric oscillations in the basin caused by wind disturbances at the basin crest) can be studied without the complications introduced by more complex topography.
METCRAX Links
- University of Utah METCRAX page
- Michigan State University METCRAX page
- Barringer Meteorite Crater
- Meteor Crater Enterprises
ISS Operations for Metcrax
ISS Operations for Metcrax
Schedule
- September 10th, 2006 - setup begins
- September 25th, 2006 - initial measurements for determination of optimum sensor heights
- October 1st, 2006 - operations
- November 1st, 2006 - tear-down
ISFF Measurement Sites
| site | abbrev. |
latitude (degN) |
longitude (degW) | altitude (m) | slope azimuth (degTrue) | slope angle (deg) | structure hardware | power load PV panels | comms storage |
| southwest SODAR | sw |
35.01033 (35.0103) |
111.03883 (111.0388) |
1697 1697* [1697] (1697) |
10m PAM tripod, rad stand |
16W, 30AH/day (w/o LICOR), AC generator |
EtherAnt wifi, 4GB pen drive |
||
| crater rim Barringer Pt | rim | 35.02945 (35.0295) | 111.02915 (111.0292) | 1751 1744* [1745] 1745.5** (1744) | 10m PAM tripod, rad stand | 28W, 52AH/day, 2x65W, 1x30W | EtherAnt wifi, 4GB pen drive | ||
| west slope upper | wu | 25.02745 (35.0274) | 111.02689 (111.0270) | 1605 1602* [1604] (1609) | 98 (87) | 21 (22) | 20' Aluma, rad stand | 34W, 64AH/day, 6x65W, 3x30W | EtherAnt wifi, Xbee, 60Gb pocketec |
| west slope lower | wl | 35.02736 (35.0272) | 111.02548 (111.0255) | 1575 1572* [1573] (1572) | 113 (69) | 5.4 (4) | 30' Rohn, rad stand | 34W, 64AH/day, 6x65W, 3x30W | EtherAnt wifi, XBee, 60Gb pocketec |
| crater floor profile tower, radiation tower | flr | 35.02800 (35.0280) | 111.02277 (111.0225) | 1565 1564* [1564] (1563) | 2 30' Rohn, rad stand | 38W, 72AH/day, 8x65W, 4x30W, 35W H2 fuel cell | EtherAnt wifi, 60Gb pocketec | ||
| east slope lower | el | 35.02731 (35.0272) | 111.01977 (111.0198) | 1575 1572* [1574] (1572) | 265 (265) | 6.5 (7) | 30' Rohn, rad stand | 34W, 64AH/day, 6x65W, 3x30W | EtherAnt wifi, XBee, 60Gb pocketec |
| east slope upper | eu | 35.02731 (35.0272) | 111.01844 (111.0184) | 1602 1600* [1600] (16000) | 267 (263) | 21 (24) | 20' Aluma, rad stand | 34W, 64AH/day, 6x65W, 3x30W | EtherAnt wifi, XBee, 60Gb pocketec |
| ISS | 35.0722 | 111.0342 | 1670 | ||||||
| WIFI repeater, south rim | 10m PAM tripod | ?, 3x30W | AP24 dual wifi |
*elevations provided by Sebastion Hoch from DEM using ISFF gps latitude and longitude
[data] are barometric altitudes above crater floor
**benchmark adjacent to the station on Barringer Point
(data) were measured for the nearby radiation stands, see logbook entry 152; elevations from DEM
We have also calculated the barometric altitudes of the ISFF sites with reference to the crater floor, 1564 meters. The ISFF barometers have an absolute accuracy of 0.05 mb, corresponding to an altitude difference accuracy of 0.5 meters. The barometric altitude is calculated from the hydrostatic equation using the ISFF 1.5 or 2 meter temperature and humidity values to estimate air density. The tabulated altitudes are again the median values for the month of October. The standard deviations of the barometric height differences range from 0.6 meters ("wl" to "flr") to 1.3 meters ("sw" to "flr").
The distributions of the barometric height differences are often skewed, particularly within the crater. The distributions from the west sidewall stations have positive skewness (1.9 to 2.4) and those from the east sidewall have negative skewness (-2.5 to -2.6), while the distribution for SW-Rim has a skewness of 1.7. Skewness of the barometric height differences are likely caused by asymmetric diurnal cycles of pressure, temperature and humidity for the near-surface station data used in the calculations.
Whiteman and Hoch used handheld gps latitude and longitude data for the radiation stands and interpolated from the 10 meter lat/lon grid of map elevations (USGS DEM, Meteor Crater, AZ) to get altitudes for each of the sites. This required accounting for the different datums used by the USGS quadrangle map and the handheld gps. Hoch also used this technique with the ISFF gps latitudes and longitudes to obtain interpolated altitudes for the ISFF towers.
Instrumentation
| sensor [included sites] | heights/depths (preliminary) | sites | variable names | sample rate (Hz) | orientation |
| [All Sites] | |||||
| Vaisala PTB baromter | 2 m | flr, el, eu, wl, wu, rim, sw | (P, Tbaro).site | 1 | |
| Garmin GPS 35 | flr, el, eu, wl, wu, rim, sw | (lat, lon, alt).site | 1 | ||
| Power Monitor | flr, el, eu, wl, wu | (Vbatt, Isolar, Iload).site | 1 | ||
| [Crater Floor, 30' profile tower] | |||||
| NCAR TRH hygro-thermometer | 0.5, 2, 5, 8.5 m | flr | (T, RH).?m.flr | 1 | west |
| CSAT3 sonic anemometer | 0.5, 2, 5, 8.5 m | flr | (u, v, w, tc).?m.flr | 60 | east |
| CSI krypton hygrometer | 2 m | flr | (kh2oV, kh2o).2m.flr | ~60 | |
| [Lower Slopes, 30' towers] | |||||
| Vaisala 50Y hygro-thermometer | 0.5 (NCAR), 1.5, 3, 5, 8.5 m | el | (T, RH).?m.el | 1 | north |
| NCAR TRH | 0.5, 1.5, 3, 5, 8.5 m | wl | (T, RH).?m.wl | 1 | north |
| CSAT3 sonic | 0.5, 1.5, 3, 5, 8.5 m | el, wl | (u, v, w, tc).?m.site | 60 | south |
| CSI krypton | 3 m | el, wl | (kh2oV, kh2o).3m.site | ~60 | |
| [Upper Slopes, 20' towers] | |||||
| Vaisala 50Y | 0.5, 1.5, 3, 5 m | eu | (T, RH).?m.eu | 1 | north |
| NCAR TRH | 0.5, 1.5, 3, 5 m | wu | (T, RH).?m.wu | 1 | north |
| CSAT3 sonic | 0.5, 1.5, 3, 5 m | eu, wu | (u, v, w, tc).?m.site | 60 | south |
| CSI krypton | 3 m | eu, wu | (kh2oV, kh2o).2m.site | ~60 | |
| [Crater Rim (Barringer Point), 10 m PAM mast] | |||||
| NCAR TRH | 2 m | rim | (T, RH).?m.rim | 1 | north |
| CSAT3 sonic | 3 m | rim | (u, v, w, tc).?m.rim | 60 | south |
| CSI krypton | 3 m | rim | (kh2oV, kh2o).3m.rim | ~60 | |
| RMYoung prop vane | 10 m | rim | (U, V, Spd, Dir).10m.rim | 1 | |
| [Southwest (Sodar site), 10 m PAM mast] | |||||
| NCAR TRH | 2 m | sw | (T, RH).2m.sw | 1 | north |
| CSAT3 sonic | 3 m | sw | (u, v, w, tc).3m.sw | 60 | south |
| Licor 7500 hygrometer | 3 m | sw | (h2o.co2).3m.sw | 10 | |
| RHYoung prop vane | 10 m | sw | (U, V, Spd, Dir).10m.sw | 1 | |
| "Darkhorse" Surface Radiation stands (south of towers) | |||||
| Everest 4000.4ZL IR surface temp | 2 m | flr, el, eu, wl, wu, rim, sw | Tsfc.site | 0.2 | down-looking |
| REBS Q7 net radiometer | 2 m | flr, rim, sw | Rnet.site | 0.2 | horizontal |
| REBS Q7 | 2 m | el, eu, wl, wu | Rnet.site | 0.2 | slope parallel |
| REBS Q7 | 2 m | el, eu, wl, wu | Rnet.horiz.site | 0.2 | horizontal |
| Epply pyranometer shortwave | 2 m | el, eu, wl, wu | Rsw.in.site, Rsw.out.site | 0.2 | up & down slope parallel |
| Epply pyrgeometer longwave | 2 m | el, eu, wl, wu |
(Rpile, Tcase, Tdome).in.site, (Rpile, Tcase, Tdome).out.site |
0.2 | up & down slope parallel |
| Epply pyranometer | 2 m | rim |
Rsw.in.rim, Rsw.out.rim |
0.2 | up & down horizontal |
| Epply pyrgeometer | 2 m | rim |
(Rpile, Tcase, Tdome).in.rim, (Rpile, Tcase, Tdome).out.rim |
0.2 | up & down horizontal |
| K & Z pyranometer | 2 m | flr | Rsw.in.flr, Rsw.out.flr | 0.2 | up & down horizontal |
| K & Z pyrgeometer | 2 m | flr |
(Rpile, Tcase).in.flr, (Rpile, Tcase).out.flr |
0.2 | up & down horizontal |
| Licor LI-200 diffused radiometer with shadow band | 2 m | flr, rim | Rdiff.in.site | 0.2 | horizontal |
| [30' Radiation Flux Divergence tower (crater floor)] | |||||
| K & Z pyrgeometer | 0.5, 2, 5, 8.5 m | flr |
(Rpile, Tcase).in.?m.flr, (Rpile, Tcase).out.?m.flr |
0.2 |
up & down 150 & 210 deg |
| [Buried Soil Probes] | |||||
| Micromet REBS soil temperature | 5 cm | flr, el, eu, wl, wu, sw, rim | Tsoil.site | 0.2 | near rad stand |
| Deacagon Ech2o Soil Moisture | 5 cm | flr, el, eu, wl, wu, sw, rim | Qsoil.site | 0.2 | near rad stand |
| HFT-3 Soil Heat Flux | 5 cm | flr, el, eu, wl, wu, sw, rim | Gsoil.site | 0.2 | near rad stand |
| Hukseflux TP01 Thermal Properties | 5 cm | flr, el, eu, wl, wu, sw, rim | (Vpile, Vheat, Tau63).site | 0.2 | near rad stand |
| port | floor | east lower | west lower | east upper | west upper | rim | sw |
| ttyS1 | Power SOAD | Power SOAD | Power SOAD | Power SOAD | Power SOAD | ||
| ttyS2 | logger | logger | logger | logger | logger | logger | logger |
| ttyS3 | GPS | GPS | GPS | GPS | GPS | GPS | GPS |
| ttyS4 | RMY Prop | RMY Prop | |||||
| ttyS5 | CSAT 0.5 m | CSAT 0.5 m | CSAT 0.5 m | CSAT 0.5 m | CSAT 0.5 m | CSAT/Kry 3.0 m | CSAT 3.0 m |
| ttyS6 | CSAT/Kry 2.0 m | CSAT 1.5 m | CSAT 1.5 m | CSAT 1.5 m | CSAT 1.5 m | TRH 2.0 m | TRH 2.0 m |
| ttyS7 | CSAT 5.0 m | CSAT/Kry 3.0 m | CSAT/Kry 3.0 m | CSAT/Kry 3.0 m | CSAT/Kry 3.0 m | LICOR | |
| ttyS8 | CSAT 8.5 m | CSAT 5.0 m | CSAT 5.0 m | CSAT 5.0 m | CSAT 5.0 m | ||
| ttyS9 | Barometer | Barometer | Barometer | Barometer | Barometer | Barometer | Barometer |
| ttyS10 | TRH 0.5 m | CSAT 8.5 m | CSAT 8.5 m | 50Y logger | TRH 0.5 m | ||
| ttyS11 | TRH 2.0 m | TRH 0.5 m | TRH 1.5 m | ||||
| ttyS12 | TRH 5.0 m | TRH 1.5 m | TRH 3.0 m | ||||
| ttyS13 | TRH 8.5 m | TRH 3.0 m | TRH 5.0 m | ||||
| ttyS14 | RFD logger | TRH 5.0 m | |||||
| ttyS15 | TRH 8.5 m |
Sensor Notes
Adams/Loggers
The adams at Rim and WU both stopped around 22:35 on October 5th, probably due to lightning; floor stopped around 05:20 on October 6th. The Rim adam was rebooted around 11:15 on October 6th, and WU was rebooted around 11:20 on October 6th. The floor adam had a few sporadic bursts of data until it recovered (no record of service) around 13:15 on October 6th.
The data from the radiometer/soil sensor logger at the Rim site was not transmitted to its adam prior to Oct 5th, around 11:50. The logger at EL had data losses on several afternoons of October 12th to the 25th. Other loggers had occasional periods of data loss.
Sonic Anemometers
METCRAX used 25 Campbell Scientific CSAT3 sonic anemometers; 19 NCAR sonics and 6 borrowed from John Wyngaard at Penn State University (S/N's 03xx). Most of the sonics were running on OS Rev 3; except S/N 0367 at WL, S/N 0376 at Rim, and S/N 0378 at SW. All of the NCAR sonics were calibrated by the manufacturer for OS Rev 3.0f in the months preceding the project. OS 3 and OS 4 use different techniques to detect the pulse arrival time. One consequence of this is that OS 3 has a temperature resolution of 0.002°C and OS 4 has a temperature resolution of 0.03°C.
We were short on sonics throughout most of the project. Sonic S/N 0378, was finally installed at SW around 15:25, October 8. The sonic initially installed at the Rim site, S/N 0673, was removed around 15:35 on October 6th, and only replaced successfully with S/N 376 around 12:35 on October 22nd.
The 0.5 m sonic at the WL site, S/N 0856, did not operate properly from the beginning of the project, and was replaced with S/N 0673 around 14:55 on October 7th. S/N 0673 was removed around 10:50 on October 22nd, to move back to the Rim site and replaced with S/N 367. However, the serial port (5) was apparently bad so that the replacement sonic did not become operational until around 12:45 on October 21st, when it was switched to serial port 16.
Before and/or after the field project, each sonic was operated in the 89-cm-diameter, low-turbulence wind tunnel of the NCAR Sensor Calibration Laboratory. The working section of this wind tunnel is too small to accurately calibrate the sonics, but the wind tunnel is sufficiently repeatable to examine the consistency of the sonic gain. This was done by operating the wind tunnel over the range from 0 to 20 m/s and calculating the linear regression of the wind components measured by each sonic with respect to the wind tunnel speed measured by a pitot-static tube.
During the post-project wind tunnel tests, most sonics had offsets below the manufacturer's performance specification of ±4 cm/s. The offsets on two sonics exceeded ±5 cm/s. S/N 0377 (WU, 0.5m) had a "U" component offset of -6 cm/s. We ran 4 wind tunnel tests on S/N 0536 (WU, 1.5m) with "U" and "V" offsets ranging from ±12 cm/s down to less than ±3 cm/s.
The sonics were initially reporting data at 60 Hz, but network bandwidth problems soon prompted reducing this to 20 Hz oversampled at 60 Hz. This change was made around 19:30 MST, October 2nd. Despite this change, there were sporadic losses of data throughout the project. These may be viewed by looking at the "samples.sonic" variable. No attempt has been made to filter the sonic data based on missing data samples. Note that this loss of data was severe prior to October 2nd. These problems were particularly acute at the west lower (WL) slope site, because it had the most serial channels of the 7 ISFF stations.
The sonic tilts have been calculated with the planar fit technique, using the 5-minute-averaged wind components from the entire project, and the sonic data have been rotated to a surface-parallel, geographic coordinate system. This coordinate system has a project-average vertical velocity of zero with a U wind component positive from west to east and a V wind component positive from south to north. The planar fit technique is not applicable to the Barringer Point station and the sonic data at this location have only been rotated into the geographic coordinate system.
Following rotation of the sonic data to a flow-normal coordinate system, the tilt calculations were repeated. The residual lean angles were found to be 0.1 degree or less, confirming the success of the coordinate system rotations. The scatter about the elevation angle axis was identical to the rms residual found initially and the scatter appears to be symmetric about the elevation axis. The sole exception was for the 0.5 meter sonic at EU where the departure from the model curve can also be seen by close examination of the corresponding tilt plot.
In the following table, the Boom Angle is the direction of the sonic boom, i.e. with the exception of the sonic on the crater floor tower, the sonic booms were pointing to the south. The tilt plots are the elevation angle versus azimuth angle of the wind components as measured by the sonic anemometer. Lean is the (negative of) the minimum elevation angle of the measured wind, and the Lean Azimuth is the azimuth, in sonic coordinates, of the lean. Since the lean azimuth is calculated in an orthogonal right-hand coordinate system, thus increasing in a counter-clockwise direction, and the boom azimuth is in a geographic coordinate system, with directions increasing in a clockwise direction, the lean azimuth in geographic coordinates is Boom Angle - Lean Azimuth. Click here to view images of tilt plots.
| height.site | s/n | os | boom angle | lean (deg) | lean azimuth (deg) | w offset (cm/s) | rm residual (deg) |
| 0.5m.flr | 0671 | 3.0f | 88.5 | 0.3 | 114.1 | -2.0 | 0.7 |
| 2m.flr | 0537 | 3.0f | 90.3 | 1.3 | 125.3 | -3.0 | 1.5 |
| 5m.flr | 0800 | 3.0f | 91.8 | 0.9 | 108.2 | -2.0 | 3.1 |
| 8.5m.flr | 0540 | 3.0f | 91.6 | 0.6 | 136.5 | -1.0 | 4.5 |
| 0.5m.eu | 1123 | 3.0f | 181.5 | 15.9 | 94.7 | -1.0 | 1.1 |
| 1.5m.eu | 0364 | 3.0a | 181.8 | 19.0 | 90.4 | 0.0 | 1.5 |
| 3m.eu | 1121 | 3.0f | 181.5 | 19.6 | 90.4 | -2.0 | 2.1 |
| 5m.eu | 1124 | 3.0f | 178.3 | 21.0 | 88.6 | -4.0 | 3.1 |
| 0.5m.el | 0539 | 3.0f | 187.1 | 5.1 | 81.9 | -2.0 | 0.7 |
| 1.5m.el | 0672 | 3.0f | 186.6 | 5.8 | 83.0 | -2.0 | 1.4 |
| 3m.el | 1120 | 3.0f | 186.8 | 6.3 | 77.1 | -2.0 | 2.3 |
| 5m.el | 0855 | 3.0f | 186.2 | 6.5 | 78.5 | -2.0 | 3.3 |
| 8.5m.el | 0538 | 3.0f | 186.9 | 6.2 | 73.1 | -3.0 | 4.8 |
| 05m.wu | 0377 | 3.0a | 177.5 | 23.8 | -79.6 | -7.0 | 1.0 |
| 1.5m.wu | 0536 | 3.0f | 178.8 | 22.5 | -75.8 | -5.0 | 1.7 |
| 3m.wu | 1122 | 3.0f | 178.2 | 21.6 | -74.0 | -6.0 | 2.3 |
| 5m.wu | 0677 | 3.0f | 176.6 | 21.1 | -78.2 | -1.0 | 2.6 |
| 0.5m.wl (oct 7th - 20th) | 0673 | 3.0f | 177.7 | 3.8 | -23.5 | -5.0 | 0.7 |
| 0.5m.wl (after oct 20th) | 0367 | 4.0s | 177.7 | 4.0 | -23.6 | -5.0 | 0.7 |
| 1.5m.wl | 0366 | 3.0f | 178.8 | 4.6 | -51.2 | -3.0 | 1.3 |
| 3m.wl | 1119 | 3.0f | 177.7 | 5.1 | -71.7 | -2.0 | 2.2 |
| 5m.wl | 117 | 3.0f | 177.1 | 5.4 | -63.7 | -1.0 | 3.0 |
| 8.5m.wl | 0674 | 3.0f | 176.6 | 5.4 | -63.8 | 0.0 | 4.2 |
| 3m.rim (before oct 6th) | 0673 | 3.0f | 181 | 2.5 | -175.1 | 80.0 | 5.7 |
| 3m.rim (after oct 20th) | 0376 | 4.0s | 181 | 4.3 | 149.1 | 38.0 | 9.2 |
| 3m.sw | 0378 | 4.0s | 178.2 | 0.3 | 0.7 | 1.0 | 0.8 |
If the sonic w-axis were perfectly vertical, then the Lean Azimuth at the slope towers would be the wind direction for a down-slope wind and the Lean Angle would be the slope angle. However, since the sonic u-axis is oriented roughly cross-slope, a sonic deviation from vertical by a roll about its u-axis would produce an apparent lean angle equal to the slope angle plus the roll angle on the east slope and equal to the slope angle minus the roll angle on the west slope. A sonic deviation from vertical by a pitch angle about its v-axis would cause a departure of the Lean Azimuth from the down-slope direction of roughly 11 degrees per degree of pitch for a 5 degree slope angle and roughly 3 degrees per degree of pitch for a 20 degree slope. The pitch angle is most likely to be negative, due to sag of the sonic boom, which would cause an underestimation of the magnitude of the Lean Azimuth.
It can be noted that the Lean Angles for sites with horizontal surfaces ("flr" and "sw") are on the order of a degree or less. Pitch and roll angles of 0.5 degree each over a horizontal surface produce a Lean Angle of 0.7 degrees and a Lean Azimuth of 135 degrees for positive pitch (see 8.5m.flr) and 45 degrees for negative pitch. The Lean Azimuths have the same sign as the roll angles. Thus the "flr" sonics have a combination of (small) pitch and roll angles, whereas SW is principally a (very small) pitch angle. This suggests that the pitch and roll angles for the slope sonics might have a comparable magnitude, which is also consistent with (in most cases) the small scatter in the Lean Angles and Lean Azimuths.
Ignoring the systematic errors possibly introduced by sonic pitch and roll, the following are the average values of the inferred slope angle and downslope wind direction for each of the four slope sites. The 0.5 meter level has not been included in the averages since it may be unduly influenced by the very local topography.
| site | slope angle | downslope wind dir | topo downslope dir* |
| eu | 20º ± 1º | 91º ± 1º | 88.5º |
| el | 6º ± 0.3º | 109º ± 4º | 99.7º |
| wu | 22º ± 0.7º | 254º ± 1º | 262.1º |
| wl | 5º ± 0.4 | 241º ± 8º | 252.5º |
Values of the sensible heat flux (H), have been computed at the locations where a fast-response hygrometer was available, using our standard procedure to correct for separation between the sonic and hygrometer, water vapor response of the sonic temperature, and oxygen response of the krypton hygrometers. These values of H are included in the NetCDF statistics files. For the purpose of computing the Obukhov length (used to set the spatial scales of turbulence in the sensor separation correction), u* was set to the square root of the magnitude of the stress vector (rather than the projection along the mean wind) to avoid discarding the many cases when u* was imaginary. Also, the pressure measured by the barometer at each site (without any height correction) was used in the calculation of specific humidity and air density required by these calculations. When data from the barometer at the site was not available, the median of all the other station values was used.
Krypton Hygrometer
Obviously erroneous krypton hygrometer data, mostly associated with rain events, have been deleted from the quality-controlled data set. A krypton hygrometer was not installed at the Rim site between 15:34 on October 6th, and 17:20 on October 20th, since there was also no sonic available for the Rim site during this period. The krypton hygrometer initially installed at the floor site (S/N 1101) did not operate properly and was replaced with S/N 1397 at 11:58 on October 9th.
Latent heat fluxes (LE) have been computed using the procedure stated above. The sensor separation distance was estimated as 24 cm from photographs.
Infrared Gas Analyzer LICOR-7500
The Licor-7500 was not installed at the SW site until around 15:25 on October 8th, when a sonic was first installed at that site. The data have been edited to remove rain contamination.
Latent heat fluxes (LE) have been computed using the procedure stated above. Obviously, no oxygen correction was required. The sensor separation distance was estimated as 14 cm from one photograph of SW.
Prop-vane Anemometer
The prop-vane data for the Rim site have been edited to remove data when the mast was lowered.
Temperature/Relative Humidity
The University of Utah Vaisala 50Y temperature/relative humidity sensors were calibrated in the EOL Sensor Calibration Laboratory both prior to and immediately following field operations. Temperature calibrations are done in an oil bath whose temperature is measured with an NBS-traceable sensor. The differences between the 50Y measurements and the reference scatter in the range ±0.2°C with the mean differences less than 0.05°C.
The RH calibrations are done in a humidity chamber which is based on the principal of saturating air at one temperature and then transferring it to the chamber at a second temperature, so the basic measurements are again temperatures (pressure). The calibrations were done for an ambient temperature of 15°C. The results show differences between the 50Y's and the reference less than ±2% RH, with most less than ±1% RH.
We found that the University of Utah TRH booms were installed in the wrong order at east lower. The order of the sensors in the data is 1.5, 5, 8, and 3 meters. The configuration file was changed to correct this error.
The University of Utah Vaisala 50Y TRH sensors at EL and EU were noisy at times, particularly RH.eu at 1.5, 3, and 5 meters and RH.el at 3, 5 and 8.5 meters; also T.el at 1.5, 3, 5, and 8.5 meters. Obviously bad data were edited. T.3m.el has numerous spikes to high temperatures from 22:55 on September 26th, until 17:50 on October 3rd, which have not yet been edited out of the data set.
The NCAR hygrothermometers were also checked in the EOL Sensor Calibration Laboratory following field operations. The temperature sensors were within less than ±0.1°C of the reference, with the exception of TRH703 (WU, 0.5 meter) with an offset of 0.1°C and TRH004 (WL, 1.5 meter after 20:06 on October 6th, UTC) with an offset of -0.15°C. The relative humidity sensors were within less than ±3 % RH of the reference, with the exception of TRH005 (FLR, 5 meter) with an offset up to -5 % RH that was greatest at high humidity and TRH704 (WL, 1.5 meter until 18:00 October 4th, 0.5 meter after 18:24 UTC), with an offset of 20% RH at 90% RH. The data have not been altered to reflect these post-project calibrations because we do not know how the sensor changed during the project. The NCAR WL and WU TRH's initially deployed at 1.5 meters failed and were repaired or replaced as noted above. Again, obviously bad data have been edited.
Values of specific humidity (Q) computed from these sensors (again, with site-specific, but not height-corrected pressure measurements) have been included in the NetCDF statistics files.
Barometer
Sporadic data dropouts that occurred at WU prior to September 30th, have been edited from the pressure data.
Radiometers
The surface radiative temperatures were measured by Everest 4000.4ZL infrared radiometers mounted at a nominal height of 2 meters on the NCAR sawhorse radiation stands. These radiometers used an assumed emissivity of 0.98 to convert the measured longwave radiation to a surface temperature. The radiometers were oriented normal to the local surface and have a field of view of 15°.
T_surface was not powered on at SW until October 8th.
The Rnet gains in the SW logger were about 5% larger than those of the net radiometer (Q06094) installed there around 17:00 on October 3rd. The gains in the WL logger for the horizontal Rnet were 4 - 5% lower than those of the net radiometer (Q94197) installed there. These gain errors have been corrected during post-processing of the data.
Licor pyranometers were used with manual shadowbands to measure diffuse radiation at the Rim and Floor sites. The Licor pyranometer at the Rim site was scratched, presumably prior to or during setup, but was repaired by the manufacturer prior to recalibration at the end of the project. Sebastion Hoch has performed a post-project calibration; of both pyranometers to account for the blockage of diffuse radiation by the shadow band, as well as the alteration of the Rim pyranometer response by the scratch.
Rlw.out at EL had a loose wire in the data logger which caused an error in the case temperature. This was fixed on October 12th around 15:04. Rlw.in on the crater floor was malfunctioning until October 5th at around 22:48 (no record of service).
Values of long-wave radiation (Rlw) computed from the thermopile and case temperature (and in the case of Epply pyrgeometers also the dome temperature and short-wave radiation) have been included in the NetCDF statistics files.
Campbell Scientific also recommends correcting net radiometers for dome ventilation using the measured wind speed. For METCRAX, the measurements from the nearest anemometer in height for each site were used with no correction since a general correction in this flow regime probably is impossible. Since this correction contains some uncertainty, a different variable name (Rnetc) was used when writing these corrected values to the NetCDF statistics files.
Soil Sensors (soil temperature, soil heat flux, soil moisture, soil thermal properties [TP01])
Qsoil values mostly did not agree with the 1 or 2 manual measurements taken near the end of the project and some readings were below zero. Since there was not enough information to perform a linear correction, offsets of 0, +5, +4, +5, +5, 0, and -5% were applied to data from flr, el, wl, eu, wu, rim, and sw, respectively. Application of these offsets makes all readings above 0. The rain on the 6th of October is obvious in the data but it is possible that the sensors were not completely "seated" in the soil prior to this event.
From 16:00 on October 24th, until the end of the project, the Gsoil.rim data contain numerous noise spikes. The most egregious noise has been removed from the edited data, but those data still remain noisy and should be used with caution. The frequency of the noise decreases significantly after 17:00 on October 25th.
The TP01 sensor at floor was not connected until October 30th, at around 17:00. A little over four days of data were then collected, which should give a value for the volumetric soil heat capacity at that site which can be extrapolated back to the beginning of the project using the trends observed at the other sites.
Values of soil heat capacity (Cvsoil) and thermal conductivity (lambdasoil) derived from the TP01 measurements have been included in the NetCDF statistics files. Also included are values of the surface heat flux (Gsfc), including the the heat storage above the heat flux plates determined from soil temperature and Cvsoil.
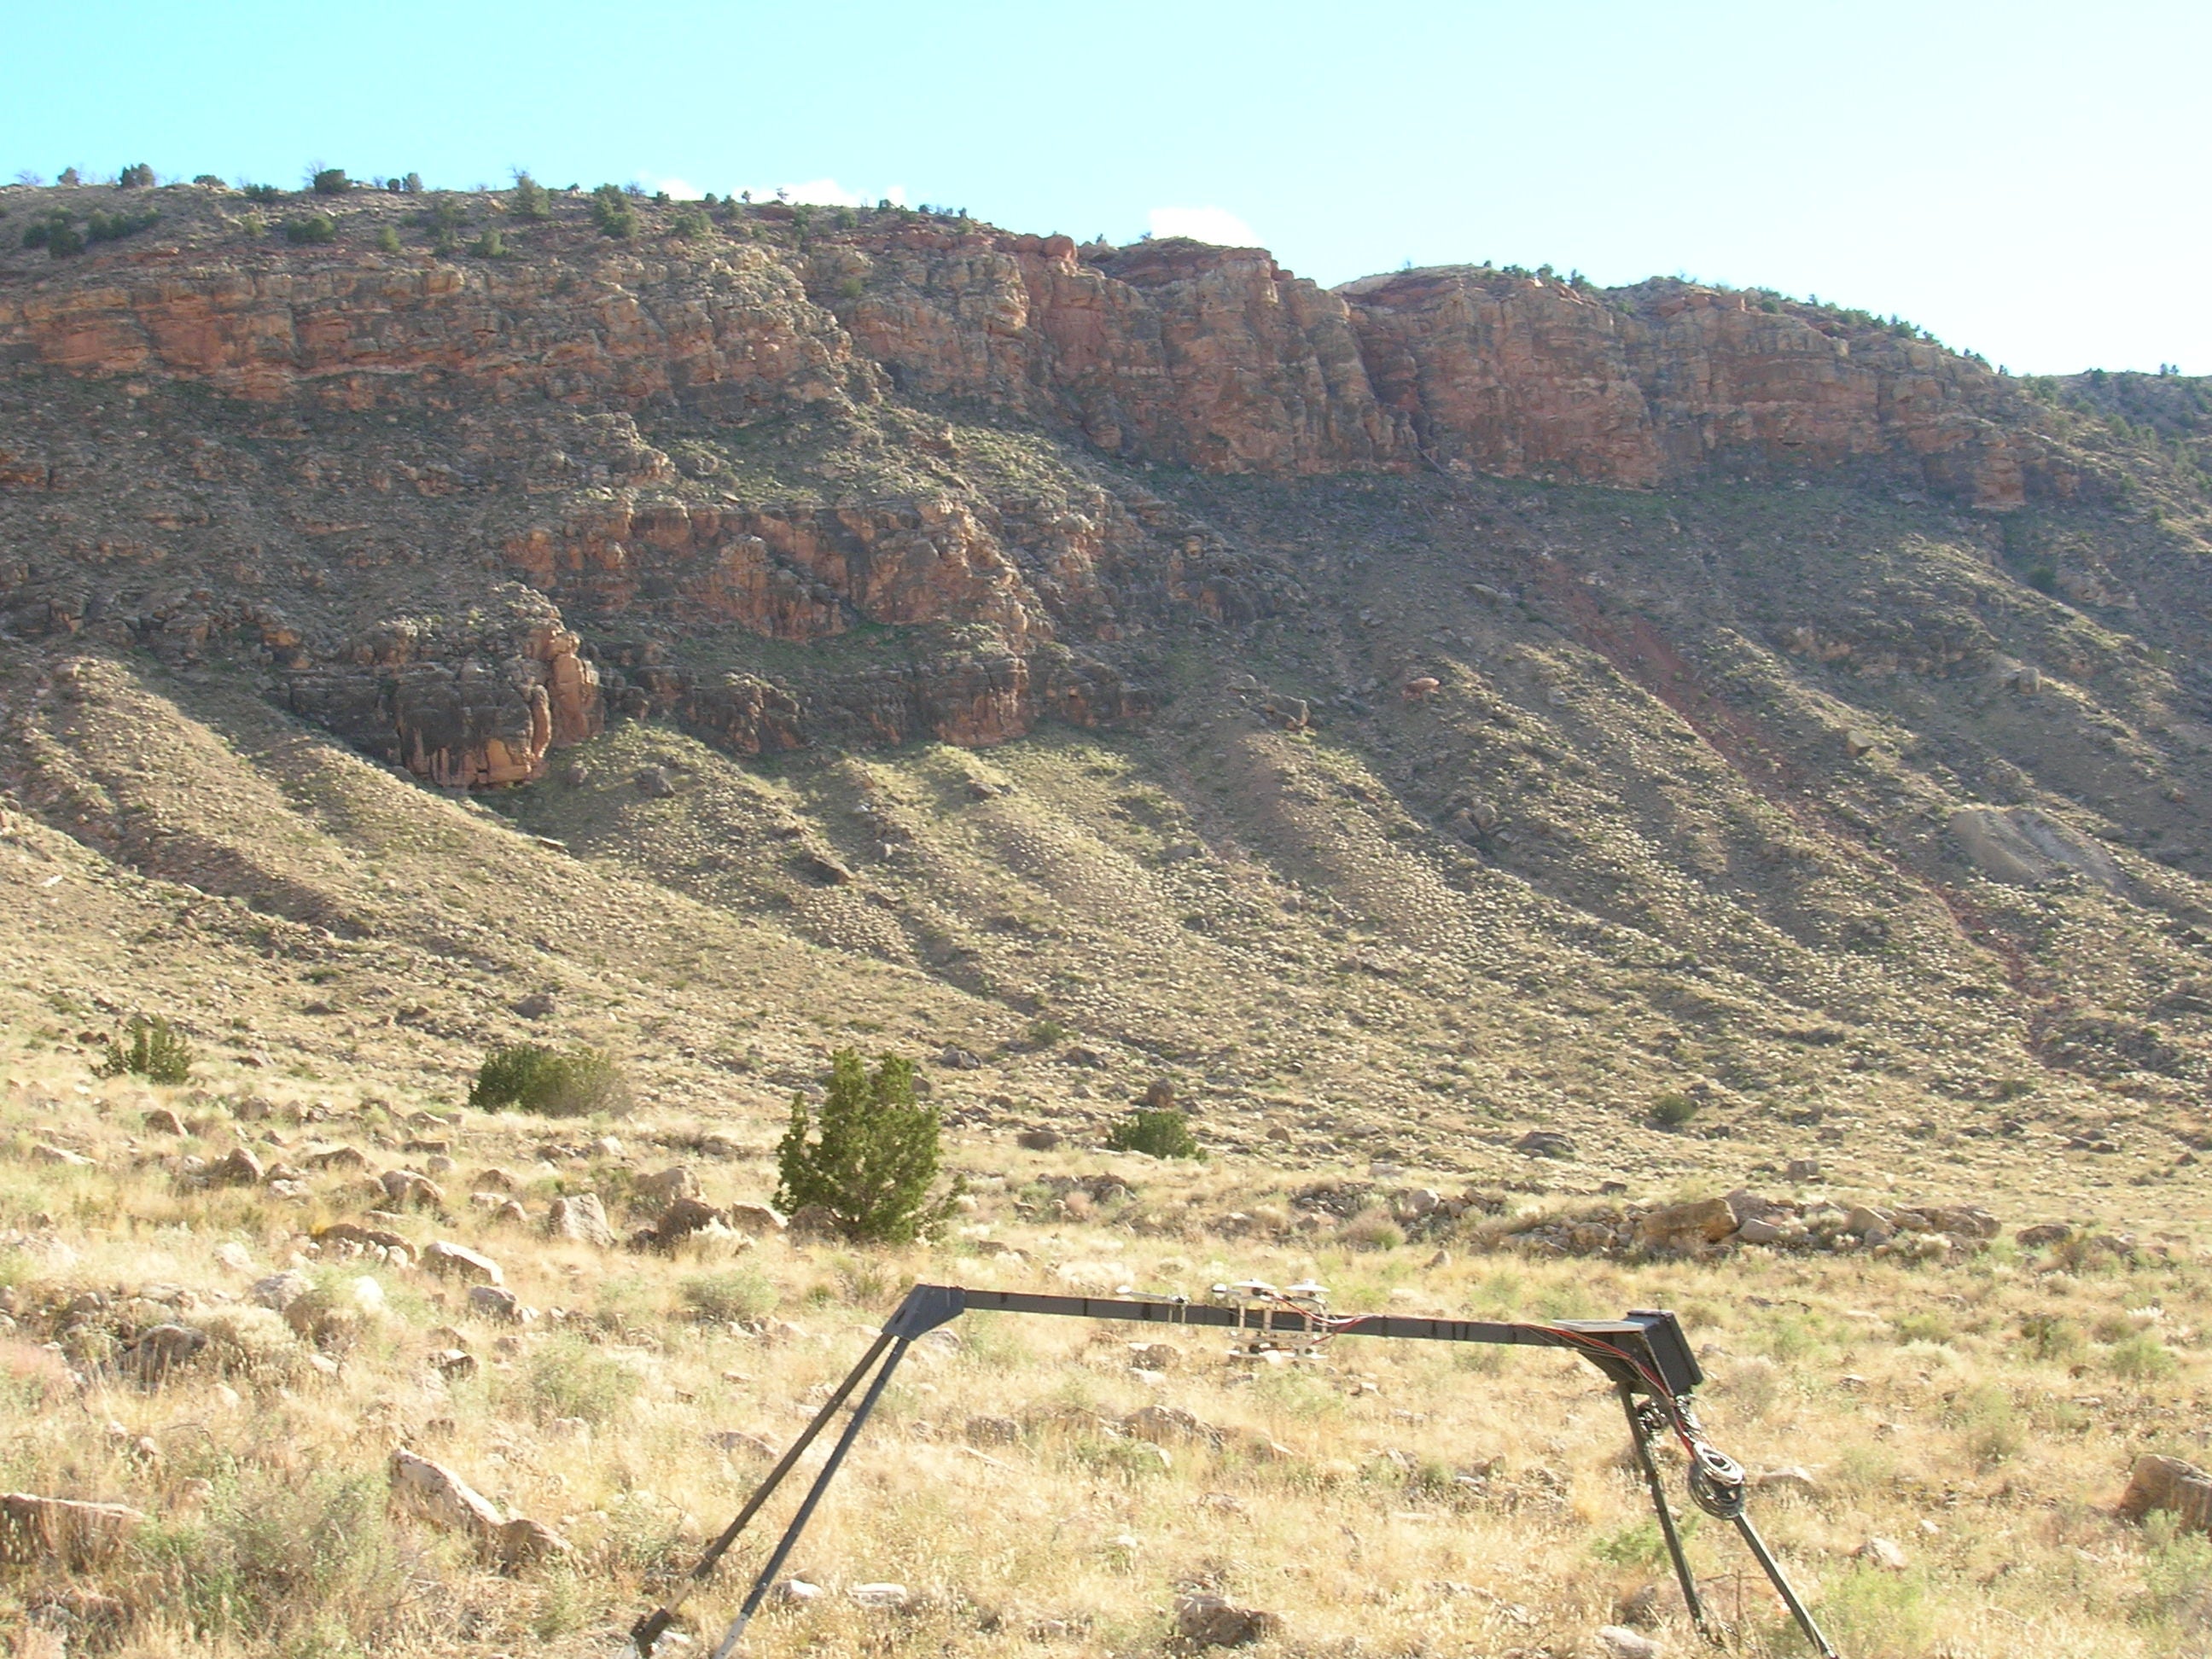
Photos
- East-upper
- East-lower
- Floor
- West Lower
- West Upper
- Rim
- Southwest
- South Rim Repeater Site
- Miscellaneous
- Setup
Field Logbook
The ISFS field logbook is available in read-only form.
Data Plots
Click here to view plots time series and profile plots.
Data Download
Click here to download data.
Tom Horst - NCAR/EOL/ISF
Data Manager
EOL Archive, NCAR/EOL/DMS