(NB: The following WWW page was imported using cut-and-paste from our earlier WWW page and has suffered some formatting issues. Formatting will be updated as time allows. All content is present.)
Flux-PAM sled train (J. Militzer)
1.0 Introduction
SHEBA (Surface Heat Budget of the Arctic) was an interdisciplinary program to study the interactions of clouds, atmospheric radiation, and the surface energy balance over the Arctic Ocean. The field phase involved the deployment of numerous measurement systems on board and in the vicinity of the Canadian ice breaker N.G.C.C. Des Groseilliers, which was frozen into the Arctic ice pack north of Alaska from October 1997 to October 1998. During this period, Ice Station SHEBA drifted from approximately 75° N, 144° W to 80° N, 166° W.
The research teams at the ice camp included the SHEBA Atmospheric Surface Flux Group (ASFG), which was responsible for direct measurement of the fluxes contributing to the surface energy balance. The principal investigators in this group are Ed Andreas (U.S. Army Cold Regions Research and Engineering Laboratory), Chris Fairall (NOAA Environmental Technology Laboratory), Peter Guest (Naval Postgraduate School), and Ola Persson (NOAA Environmental Technology Laboratory and the Cooperative Institute for Research in Environmental Sciences). The Atmospheric Surface Flux Group instrumented a 20 m micrometeorological tower located about 1 km from the Des Groseilliers and also requested the use of four NCAR Flux-PAM stations to measure fluxes over a variety of different surface types.
2.0 NCAR Flux-PAM Stations
Flux-PAM remote meteorological stations are one of the principal components of the NCAR Integrated Surface Flux Facility (ISFF). These stations measure the standard meteorological variables of wind, temperature, humidity, pressure and precipitation plus net radiation, soil heat flux and the eddy fluxes of momentum, water vapor and sensible heat. To provide maximum siting flexibility, Flux-PAM stations are powered by solar-charged batteries and the sensor are mounted on an internally-guyed mast with a tripod base. The Flux-PAM data-processing computer, known as EVE, ingests data from the sensors at rates commensurate with their individual response characteristics and calculates 5-min means, variances and covariances. These data statistics are stored locally on EVE and also transmitted to a base computer system for archival, analysis and display. Data transmission is accomplished in real time either through the GOES satellite and/or, for networks of limited spatial extent, by means of line-of-sight RF modems. For SHEBA, RF modems were used to transmit the data from each station to a base computer located on the Des Groseilliers.
Flux-PAM sled (J. Militzer)
In order to meet the research requirements of the SHEBA Atmospheric Surface Flux Group, the Flux-PAM stations required several modifications. Propane-fueled thermoelectric generators were used to power the stations, supplemented during the spring and summer with solar panels and (at two stations) wind generators. For operation in the extreme cold, the thermoelectric generator and propane bottles were packaged with the 12V batteries and data computer in an insulated container. For station portability, each of these containers was mounted on a freighter sled that could be towed by snowmobile. In order to accurately determine true wind direction on the drifting ice pack, an electronic compass was mounted on the meteorological mast to measure station orientation. A strobe beacon and GPS receiver were added to help service personnel locate the sites, to archive station coordinates, and for accurate time-keeping. More details on the modifications to the Flux-PAM infrastructure for the SHEBA field program will be provided in a future section of this report.
Several adaptations were also made to the standard complement of Flux-PAM sensors. Because of sensor maintenance requirements, no attempt was made to directly measure eddy fluxes of water vapor. The standard net radiometer was replaced by a 4-component measurement of incoming and outgoing, short and long-wave radiation utilizing aspirated Kipp and Zonen pyranometers and Eppley pyrgeometers. Since the standard platinum-resistance thermometer used by Flux-PAM has a lower limit of -40 °C, it was supplemented with a thermistor calibrated over the range -55 °C to 10 °C. Additional details are provided in separate sections that discuss each of the Flux-PAM sensors.
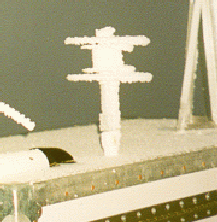
SHEBA Flux-PAM station (J. Militzer)
Fig. 2.1 SHEBA Flux-PAM Station
Figure 2.1 shows one of the SHEBA Flux-PAM stations (Atlanta?) in October 1997, shortly after setup. On the upper right is an R2 Solent sonic anemometer at a height of 3.5 m, and below the sonic is a hygrothermometer with the inlet of its mechanically-aspirated radiation shield at a nominal height of 2 m. The red strobe beacon can be seen at the top of the central mast and the electronic compass is in the cubical box mounted on top of the hygrothermometer boom. On the left is the 4-component radiometer array, also at a height of 2 m. Temperature and heat flux sensors have been installed below the radiometer boom at the snow-ice interface. In the background is the sled-mounted container housing the barometer, the thermoelectric generator, 12 V batteries, and the station data computer.
3.0 SHEBA Field Operations
Maui rescue (P. Guest)
An electronic logbook was maintained at the SHEBA ice camp to keep a record of station operation and maintenance. This logbook also records pre-project preparation and post-project data analysis activities.
The Flux-PAM stations were installed and decommissioned by NCAR personnel. However, with the exception of several visits by NCAR staff to the ice camp, the stations were maintained by ASFG personnel. Table 3.1 below is a record of Flux-PAM service personnel at the ice camp.
Table 3.1. NCAR/ASFG Flux-PAM Maintenance Personnel
Person
Dates
Person
Dates
Kurt Knudson 2 Oct-16 Oct 1997 Ola Persson 31 Mar - 23 April 1998
John Militzer 2 Oct - 20 Oct 1997 Peter Guest 21 April - 14 May 1998
Ed Andreas 2 Oct - 1 Nov 1997 Ed Andreas 12 May - 2 June 1998
Kerry Claffey 2 Oct - 1 Nov 1997 Dave Costa 12 May - 1 July 1998
Steve Semmer 16 Oct - 2 Nov 1997 Dom. Ruffieux 31 May - 1 July 1998
Gordon Maclean 16 Oct - 2 Nov 1997 Ola Persson 2 July - 11 Aug 1998
Chris Fairall 16 Oct - 25 Nov 1997 Kerry Claffey 3 July - 11 Aug 1998
Jeff Otten 16 Oct 1997 - 14 May 1998 Dave Costa 11 Aug - 9 Sept 1998
Janet Intrieri 26 Nov 1997 - 8 Jan 1998 Peter Guest 11 Aug - 9 Sept 1998
Steve Semmer 7 Jan - 9 Jan 1998 Scott Abbott 9 Sept - 11 Oct 1998
Ann Keane 7 Jan - 19 Feb 1998 Ed Andreas 9 Sept - 11 Oct 1998
Dan Wolfe 17 Feb - 1 April 1998 Tom Horst 29 Sept - 11 Oct 1998
Tony Delany 19 Feb - 11 Mar 1998 John Militzer 29 Sept - 11 Oct 1998
John Militzer 31 Mar - 23 April 1998
4.0 Flux-PAM Site Descriptions
Three of the Flux-PAM stations were deployed at distances of 1.5-2 miles from the ship, while Station 4 was deployed in the vicinity of the main ASFG tower for the purposes of data intercomparison and hardware testing. The ASFG Web site contains a useful collection of photos of the four Flux-PAM sites. The following site description are based on the cited logbook entries, as well as comments provided by Ed Andreas, Ola Persson, and other on-site personnel.
4.1 Station 1 (Atlanta)
Atlanta was deployed on October 11, 1997, approximately 1.5 miles N of the ship on smooth, multiyear ice with a good potential for drifting snow. Ola Persson describes this station in April, 1998, to be on the southern end of a small floe, with a small lead 4 m to the S of the station which had a low ridge along its edge. This lead never opened substantially, and the low ridge was barely noticeable by June. The area to the SE through SW contained numerous ridges about 1-3 m high at various distances, but the fetch to the E was fairly smooth, with no ridges. In late April, a major lead opened roughly 60 m to the NE of the station.
On May 21, 1998, Ed Andreas recorded that Atlanta was approximately 1.6 km from the ship on a bearing of 84° true. The local ice thickness was approximately 1.9 m and the snow depth was 30 cm. The ice to the N and NE was noted to be rough, starting with the refrozen lead 100 m to the N. Ola notes that this lead was partly filled with ice floes over time, but it was still distinctly noticeable with open water even in June and July. On July 6, the distance from the edge of the lead to the Flux-PAM tripod was 91 paces (meters?). The ice blocks marking the edge of this lead were 1-2 m high, and substantial blocks were also floating as icebergs in the lead.
In July-August, Ola noted that some melt ponds were present at distances of 20-40 m in all directions. Although these melt ponds did not appear to contribute significantly to the radiometer measurements, the ice appeared darker (wetter) than at Baltimore.
On September 16, 1998, Ed noted that the location of Atlanta relative to the ship had changed little. The site was characterized by ridged ice, refrozen leads, and melt ponds to the N and NE, with smoother ice and melt ponds to the SE, S, and W. The local ice thickness had decreased to approximately 0.9 m and the snow depth was 6 cm. Atlanta was decommissioned on September 30, 1998. (See logbook entries 31, 495, 713, and 717.)
Table 4.1 lists snow depth observations by the SHEBA Snow/Ice Group, sampled at roughly 5 m intervals along a 200 m line near the site of the Atlanta Flux-PAM station. Snow depths in this and following tables have been summarized by Ola Persson from data provided by Don Perovich.
Table 4.1 Atlanta Snow Depth Observations
(cm, negative depths are melt ponds)
Date Average Range Date Average Range
97 10 16 14.4 6 to 31 98 06 10 21.9 1 to 60
97 10 26 17.9 2 to 35 98 06 12 21.7 4 to 66
97 11 18 23.6 3 to 46 98 06 14 20.3 3 to 58
97 12 04 27.1 2 to 52 98 06 16 17.2 1 to 223
97 12 23 23.4 3 to 59 98 06 18 11.6 -7 to 55
98 01 15 23.1 4 to 55 98 06 20 9.8 -22 to 46
98 02 02 31.4 6 to 67 98 06 22 3.8 -23 to 32
98 02 22 31.1 6 to 61 98 06 24 5.0 -10 to 36
98 03 09 31.4 5 to 60 98 06 26 8.0 -12 to 35
98 03 25 35.3 2 to 82 98 06 28 5.9 -17 to 30
98 04 04 37.2 4 to 94 98 06 30 6.3 -20 to 31
98 04 22 41.9 -1 to 92 98 07 02 2.9 -19 to 23
98 05 01 42.4 4 to 88 98 07 10 1.1 -27 to 16
98 05 16 44.6 2 to 97 98 07 14 -0.4 -32 to 14
98 05 27 41.0 3 to 84 98 07 20 -6.5 -40 to 9
98 06 03 30.1 0 to 109 98 07 24 -7.3 -44 to 8
98 06 06 22.2 4 to 68 98 09 02 4.2 0 to 13
98 06 08 20.6 2 to 60 98 09 14 6.4 1 to 13
4.2 Station 2 (Cleveland)
Cleveland was deployed on October 12, on rough ice approximately 2 miles S of the ship. The local snow depth was 5 cm. Ed Andreas notes that "no one has probably ever intentionally placed meteorological equipment on such rough ice. This is a rubble field with broken ice in all directions." On February 6, 1998, Station 2 was trapped in an overriding ridge of ice, seriously mangled, and temporarily decommissioned. (See logbook entry 37.) Table 4.2 lists snow depths measured by the SHEBA Snow/Ice Group, along a 200 m line near the site of the Cleveland Flux-PAM station.
Table 4.2 Cleveland Snow Depth Observations
(cm, negative depths are melt ponds)
Date Average Range Date Average Range
97 10 22 18.1 6 to 47 97 12 13 21.6 5 to 46
97 11 07 17.4 5 to 46 98 01 05 20.9 4 to 45
97 11 19 21.7 6 to 55 98 01 17 17.4 2.5 to 43
Seattle
On April 3, Station 2 was resurrected adjacent to Florida, and over the next two weeks it was used for various tests, including a radiometer intercomparison. Then on April 16, Station 2 was moved to a new site, named Seattle and described by Ola Persson to be on a flat, refrozen-melt pond area of 50-60 m radius. Beyond this range, a major ice block rubble field extended from E to N to SSW, with an especially heavy concentration and long fetch (kilometers) of rubble towards the NE. Even the SSE direction had some ice block rubble. The ice blocks towards the S (towards the ship) were less extensive, but still present. Ed Andreas described the site "as if in a fortress since it is rimmed 100-200 m away in all directions with ridges." It was considered a dangerous site because of the cover provided for polar bears. The ASFG tower was at about 150° and about 600-700 m distant. The Snow/Ice Group had a thermistor string about 30 m away, and nearby snow-depth monitoring as well. The snow depth data are tabulated with the description of the Florida Flux-PAM site.
On May 16, the Seattle site was about 0.9 km from the ship on a bearing of 356° true and was characterized by rough, multiyear ice. There was an active lead 400 m to the N and many local cracks, centimeters to meters wide, exposing open water. The local ice thickness was approximately 1.9 m and the snow depth was 19 cm. In June, a NW-SE lead opened 10-20 m to the SW of the Flux-PAM station, cutting off access to the site and fueling fears of damage if the lead closed. (See logbook entries 258, 400, 495, and 517.)
Maui
On June 10, Station 2 was moved once more after the Seattle site deteriorated to a peninsula. The new site, named Maui, was on rough ice located about 3/4 mile NW of Atlanta and 1090 m from the ship on a bearing of 47°. There was a big lead about 50 m radius going from the N to the E of the site, and a pressure ridge 2.5 m high that followed a lead about 30 m from the site. The tripod was on a small hummock/old pressure ridge and there was also a 2m-high icy peak about 10 m W of the site. Dominique Ruffieux thought the site to be quite interesting even if the surroundings were not very rough. He noted a lead located about 100 m to the NE of Maui and a ridge at about 50m to the N and NE of the site. Dominque described the surface to be "quite hilly with some pointing at 1 m agl and others at 1-2 m agl." Dave Costa noted "a nice big lead about 200 yards NNW and a pressure ridge about 100 yards E of the site."
Ola Persson described the site on July 6 to be located on gently-hilly multi-year ice, with shallow melt ponds beginning to fill the "valleys". A significant ridge was located 100 m to the E of the site, and a smaller ridge was located several hundred meters to the W (towards the ship). On this visit, the snow was hard and crusty. Ola noted that the melt ponds grew rapidly during the summer, surrounding the site with water. The sled and the tripod were on separate ice islands or peninsulas. By early August, ice movement and melting had produced some holes of open ocean water just on the north side of the sled pedestal. Throughout, the radiometers had been over their own ice peninsula/island. On August 7, the radiometer boom was moved slightly to hang directly over a melt pond in order to observe more directly the changes in the melt ponds during freeze-up.
By September 2, Maui was a small island of ice in a very active region. During the morning the radiometers were over an area of brash ice. The immediate area (within 30 m) around Maui was about 50% open water. This dropped off to less than 5%, except in a region running approximately NW to SW which was active and about 30% open water. There was more ridging right under the sonic mast and around the edges to the left and right of the sonics. Rafting ice depressed the sonic side of the floe but ridging under the outer leg kept the tripod level. Then by the afternoon, the floe had rotated about 90° and there was much more open water in the immediate region, with the radiometers positioned over open water.
On September 16, Maui was roughly 1.1 km from the ship on a bearing of 56° true. The Flux-PAM station was on a small floe with broken ice all around and open and refrozen leads and dark melt ponds nearby. The radiometers were positioned over new ice. The local ice thickness was approximately 0.3 m and the snow depth was 5 cm. By September 20, the Maui ice floe had rotated 90° clockwise and a ridge had appeared under the radiometers. Since the sled and radiometer stand were sitting in sea water pooled on the ice, and the main tripod and mast were on a separate floe, the station was dismantled and returned to the ship. (See logbook entries 520, 666, 699, and 713.)
4.3 Station 3 (Baltimore)
Baltimore was deployed on October 12, 1997, approximately 2 miles E of the ship on smooth first-year ice surrounded by older, hummocky ice. It was roughly at the south end of a north-south refrozen polyana about 400 m long and 150 m wide. The local ice thickness was about 0.4 m and the snow depth was 2 cm. The Snow/Ice Group reports that a "substantial ridge" formed in January at the "edge of their snow line", which ran for 200 m NNW-SSE over the frozen polyana about 125 m to the NE of the Flux-PAM station. There are verbal reports of a 300-500 m wide lead in January 1998 about 2.5-3 km to the WNW of this site.
On May 15, Ed Andreas reported this station to be roughly 4.5 km from the ship on a bearing of 166°. The surrounding ice was fairly smooth with the exception of a refrozen lead and rougher ice to the SE. The local ice thickness was approximately 1.4 m and the snow depth was 50 cm. Ola Persson noted that the edge of the polyana on which Baltimore was located was marked by ice blocks, which were about 60 m from the site to the N, 150-200 m from the site to the E and S, and even further to the WSW. A particularly high "escarpment", used as a landmark to locate the site, was located about 100 m to the NNE of the mast. The tripod was buried in snow almost up to its crossbar. Table 4.3 lists observations by the SHEBA Snow/Ice Group sampled at roughly 5 m intervals along a nearby 200 m snow line. The average snow depth in April was 37-43 cm, which appears to be the maximum for the year (see Table 4.3).
Table 4.3 Baltimore Snow Depth Observations
(cm, negative depths are melt ponds)
Date Average Range Date Average Range
97 10 15 15.8 6 to 36 98 03 30 27.2 7 to 62
97 10 26 17.5 2 to 52 98 04 14 42.8 3 to 83
97 11 11 22.8 3 to 81 98 04 28 37.3 1 to 119
97 12 10 25.9 4 to 90 98 05 13 35.2 5 to 115
98 01 01 23.9 2 to 100 98 05 28 33.4 2 to 116
98 01 13 25.6 3 to 86 98 06 04 21.0 1 to 98
98 03 04 28.9 7 to 65 98 06 18 6.6 0 to 72
98 03 18 19.9 0 to 42 98 06 29 -1.0 -42 to 34
98 07 09 -4.9 -75 to 20
Ola Persson noted that in July there were extensive melt ponds in all directions from the site, with the exception of an area within 50-80 m of site. He observed 3 cm of crusty snow around the tripod on July 9 and a dusting of snow and thin ice on the melt ponds on July 30. By early August the melt ponds were closer, but the immediate area around the tripod was still free of melt ponds.
On September 20, Ed Andreas observed that Baltimore was roughly 10 km from the ship on a bearing of 115°. It was surrounded by ridged ice and refrozen leads, producing a very broken surface all around. The local ice thickness was approximately 0.3 m and the snow depth was 9 cm. Baltimore was dismantled the next day because of the thin, highly-active ice in the vicinity. (See logbook entries 33, 495, 703, and 713.)
4.4 Station 4 (Florida)
Florida became operational on October 22 and remained in the vicinity of the main ice camp throughout the project. At its initial location, the ship and main camp were 100-400 m to the SW. The local surface was smooth, multi-year ice with a snow depth of 10 cm. On April 1, Florida was moved to 40 m NW of the ASFG hut at about 280° from the ASFG tower. The new site was about 35 m W of the ASFG radiometers. From April 3-15, Station 2 was also set up nearby, prior to moving it to the Seattle site.
Florida was moved again on April 20 to a site on top of a hummock or ridge, about 250 m NW of the ASFG tower and roughly 200 m N of the previous location near the ASFG hut. Ola Persson noted that the thickness of the ice ridge was 8 m, and that it was aligned with a direction of 65°-75°. From this site, the floe was flat and open to the E and SE, while to the N and W there were some ice blocks. The "camp ridge" ran N-S about 200 m W of the site. The Snow/Ice Group had a thermistor string on the ridge about 75 m W of the site.
On May 16 Ed Andreas observed that Florida was roughly 0.5 km from the ship on a bearing of 9° true. There was a major ridge 200 m W of the site, a refrozen lead and ridging 200 m N, and very smooth ice to the E. In general there were few obstacles within 200 m of the station. The local ice thickness was approximately 3 m and the snow depth was 32 cm.
Ola Persson noted that in July and August the terrain nearest the Florida site was very hilly, crusty ice and snow, and was about 1-2 m higher than the rest of the floe. Consequently, there were no major melt ponds in its immediate vicinity. However, numerous sizeable melt ponds were located 50-100 m towards the SE through SW (towards the ASFG tower and camp). On August 4, the floe to the NW of Florida sheared off (taking the Snow/Ice Group's Quebec site with it), so that a large expanse of open water was then present 100-150 m to the W through N from the Florida site.
On September 20, Florida was 0.47 km from the ship on a bearing of 12°. There were melt ponds, leads, and broken ice to the N and W, other hummocks to the E, and the ship and main camp to the S. The local ice thickness was approximately 4 m and the snow depth was 6 cm. Florida was decommissioned on September 30, 1998. (See logbook entries 66, 348, 411, 495 713, and 718.)
Table 4.4 lists observations by the SHEBA Snow/Ice Group along a 500 m (150 m after August 3) line running from the vicinity of the Florida ridge site to the Seattle site.
Table 4.4 Mainline Snow Depth Observations
(cm, negative depths are melt ponds)
Date Average Range Date Average Range
97 10 11 11.6 6 to 35 98 05 26 34.7 1 to 117
97 10 17 12.2 6 to 38 98 06 01 27.0 1 to 100
97 10 19 13.2 5 to 68 98 06 04 19.0 0 to 103
97 10 21 16.3 5 to 74 98 06 06 21.3 1 to 91
97 10 26 15.4 5 to 69 98 06 08 19.0 1 to 92
97 10 29 14.2 1 to 62 98 06 10 19.9 1 to 90
97 11 03 15.3 1 to 57 98 06 12 19.4 0 to 91
97 11 10 16.2 3 to 77.5 98 06 14 16.8 1 to 96
97 11 16 21.6 3 to 77 98 06 16 15.5 1 to 85
97 11 22 24.4 6 to 78 98 06 18 10.9 -1 to 78
97 11 29 27.7 4 to 93 98 06 20 13.7 -1 to 74
97 12 09 23.8 4 to 75 98 06 22 12.8 -21 to 129
97 12 16 25.5 5 to 95 98 06 24 4.5 -29 to 63
97 12 23 26.6 4 to 84 98 06 26 6.4 -52 to 62
97 12 30 24.1 4 to 72 98 06 28 5.1 -31 to 53
98 01 09 22.4 2 to 95 98 06 30 3.7 -39 to 53
98 01 18 18.5 3 to 65 98 07 02 1.3 -36 to 43
98 02 14 20.5 0 to 100 98 07 04 1.5 -33 to 40
98 02 23 19.0 1 to 88 98 07 10 2.6 -28 to 26
98 03 03 26.8 4 to 97 98 07 14 -0.4 -73 to 26
98 03 10 29.3 2 to 80 98 07 22 -2.9 -40 to 7
98 03 17 25.2 2 to 107 98 07 26 -3.0 -38 to 10
98 03 26 24.8 2 to 67 98 07 30 -1.2 -57 to 11
98 04 03 29.6 1 to 111 98 08 03 -1.4 -42 to 11
98 04 11 31.5 2 to 113.5 98 08 09 -4.2 -44 to 9
98 04 19 34.4 -2 to 118 98 09 07 8.7 0 to 28
98 04 25 33.5 3 to 124 98 09 14 8.3 0 to 25
98 05 02 35.4 1 to 121 98 09 22 10.8 1 to 36
98 05 12 40.0 2 to 120 98 10 07 14.7 3 to 42
98 05 18 34.8 2 to 117
5.0 Barometers
Atmospheric pressure was measured with Vaisala PTB 220B digital barometers located inside the large insulated boxes containing
 |
| J. Militzer |
the thermoelectric generators and the station data system. The total accuracy of these sensors, including non-linearity, hysteresis, drift, calibration uncertainty etc., is specified by Vaisala to be ±0.3 mb. In order to minimize dynamic pressure errors, a Nishiyama-Bedard quad-disk pressure port (shown at left, coated with rime) was mounted on the upper surface or lid of the insulated box and connected to the barometer with a flexible hose. This port is expected to reduce dynamic pressure errors to less than 0.1 mb. No problems were encountered with the barometers during the SHEBA field program.
6.0 Hygrothermometers
Atmospheric temperature and relative humidity were measured with NCAR hygrothermometers (TRH) consisting of a Vaisala Humitter 50Y sensor interfaced to NCAR microprocessor electronics and enclosed in a mechanically-aspirated NCAR radiation shield. The Vaisala 50Y sensors employ a platinum-resistance temperature (PRT) transducer and an Intercap capacitive humidity transducer. Since the 50Y PRT has a lower limit of -40 °C, it was supplemented for the SHEBA project with a thermistor calibrated over the range -55 °C to 10 °C. The temperature and humidity sensors were calibrated prior to the SHEBA field project in the NCAR Sensor Calibration Laboratory and the derived calibration coefficients were entered into EPROM memory in the individual TRH electronics. The NCAR hygrothermometer outputs a serial message containing fully-calibrated temperature(s) and relative humidity (with respect to water) data.
The TRH electronics were also used to ingest data from the electronic magnetometer compass. Since the compass data are necessary for determination of wind direction, they are discussed in the section of the report devoted to the sonic anemometers.
Temperature and humidity calibrations were performed at NCAR both before and after the SHEBA field project. The post-project temperature calibrations were nominally within 0.1 °C of the pre-project calibrations for both the platinum resistance and thermistor transducers. During the post-project humidity calibrations, the outputs from four of the 50Y sensors were less than the pre-project calibrations by 2-4 %RH, while a fifth sensor (TRH006) was less by 4-8 %RH. The cause of the departure of TRH006 from the other NCAR 50Ys is not known. Additional post-project laboratory tests were performed to determine the performance of the 50Y sensors near the frost point at low temperatures. The results of those tests are found in Appendix A.
The sign of the humidity calibration shift is also somewhat surprising, because contamination of the capacitive transducers would be expected to increase rather than decrease the sensor output. However, a similar shift (relative to the manufacturer's original calibration) was found in the post-project calibration at NCAR of Vaisala HMP 35 sensors used on the ASFG 20-m tower. A smaller shift of only 1-2 %RH was found for an ASFG hand-held HMP 35 unit, which had much less exposure to the environment over the course of the project. The humidity sensors were calibrated at -15 °C in a Thunder Scientific 2-pressure humidity chamber, with a manufacturer-specified accuracy of ±1 %RH. More details on the calibration procedures and results are available on request from NCAR.
The hygrothermometer radiation shield is composed of two concentric cylinders made of thin-walled brass tubes,
 |
| E. Andreas, October 25, 1997 |
10.75 inches long and with diameters of 1.0 and 1.375 inches. The cylinders are oriented vertically, with the sensor located on their common axis and recessed 7.75 inches above the inlet. The exterior of the shield is painted white and the interior is aspirated with a Conair, 2 inch diameter, 12 VDC fan. After the start of the SHEBA project, we found that the aspiration rate of this shield decreases with increasing wind speed. Measurements are planned to quantify the resulting temperature measurement error as a function of wind speed and radiation load. This information will be included in the project report when it is available. (Following the SHEBA project, the inlet of the radiation shield was modified to alleviate the aspiration problem.) Another potential problem is that frost often covered the shield inlet. The effect of this on the measurements is unknown, but could be investigated by examining the data before and after cleaning of the inlet during station maintenance visits.
Table 6.1 lists the heights of the TRH radiation shield inlets measured relative to the local surface. (On August 24-26, the heights of the hygrothermometer booms were measured at stations 2-4, rather than the inlet heights, and the heights of the inlets were estimated by subtracting 43 cm from those measurements.) The heights of the sonic booms were measured more often than the heights of the hygrothermometer inlets and are also listed in Table 6.1 so that they can be used to estimate the inlet heights when the inlet heights were not measured directly. The variability of the difference of these two heights is perhaps caused by lack of spatial uniformity of the surface.
| Station 1 | Station 2 | |||||
|---|---|---|---|---|---|---|
| Date | TRH | Sonic | Date | TRH | Sonic | |
| 97 10 15 | 2.88m | 97 10 15 | 2.88m | |||
| 98 04 11 | 2.26m | 98 04 11 | 2.82m | |||
| 98 04 17 | 2.26m | 98 04 16 | 2.87m | |||
| 98 05 21 | 1.27m | 2.22m | 98 05 16 | 1.81m | 2.87m | |
| 98 06 12 | 1.43m | 2.39m | 98 06 12 | 2.04m | 3.02m | |
| 98 06 22 | 1.61m | 2.51m | 98 06 23 | 1.92m | 3.03m | |
| 98 07 06 | 2.77m | 98 07 07 | 3.12m | |||
| 98 07 21 | 2.87m | 98 07 23 | 3.24m | |||
| 98 08 03 | 2.92m | 98 07 30 | 3.23m | |||
| 98 08 29 | 1.87m | 2.97m | 98 08 26 | 2.18m | 3.28m | |
| 98 09 16 | 1.84m | 2.90m | 98 09 16 | 2.30m | 3.26m | |
| 98 09 30 | 1.69m | 2.73m | ||||
| Station 3 | Station 4 | |||||
|---|---|---|---|---|---|---|
| Date | TRH | Sonic | Date | TRH | Sonic | |
| 97 10 15 | 2.87m | 97 10 23 | 1.73m | 2.90m | ||
| 98 04 22 | 2.46m | 98 04 11 | 2.75m | |||
| 98 05 15 | 1.43m | 2.34m | 98 04 20 | 2.62m | ||
| 98 06 18 | 1.71m | 2.63m | 98 05 16 | 1.88m | 2.84m | |
| 98 06 29 | 1.80m | 2.68m | 98 06 08 | 1.87m | 2.89m | |
| 98 07 09 | 2.69m | 98 06 13 | 1.86m | 2.90m | ||
| 98 07 30 | 2.97m | 98 07 29 | 2.93m | |||
| 98 08 10 | 2.97m | 98 08 26 | 1.87m | 2.95m | ||
| 98 08 24 | 1.94m | 2.93m | 98 09 08 | 1.87m | 2.93m | |
| 98 09 20 | 1.90m | 2.92m | 98 09 20 | 1.96m | 2.92m | |
| 98 09 30 | 1.82m | 2.94m | ||||
Andreas and Claffey have provided 1 hour estimates of TRH and sonic height above snow, based on the above measurements and snowline data from Don Perovich's group. These estimates are documented in an appendix to this report.
Six NCAR hygrothermometers were used during SHEBA field operations. Table 6.2 lists the history of the TRH serial numbers for each station. Each row represents a change in the hygrothermometer at one of the stations. Also included in the table are the apparent reasons for the changes and a reference to the relevant logbook entry. Only one or two changes appear to be associated with failures of the temperature and humidity sensors. Many of the TRH changes were associated with upgrades or repairs that were implemented by successive swaps among the stations. These included an improvement to the radiation shield mount, installation of sonic heaters, and repair of a beacon. (The sonic heaters and beacon were controlled by the TRH microprocessor.) The TRH aspiration fan occasionally attracted the attention of a passing polar bear and thus two changes were needed to repair bear damage. Note that TRH001 saw limited use before failing and did not receive a post-project calibration.
| Date | GMT | 1 | 2 | 3 | 4 | Comment | Logbook # |
|---|---|---|---|---|---|---|---|
| 0003 | 0004 | 0005 | 0006 | installed | |||
| 97 10 28 | 18:50 | 0003 | 0004 | 0005 | 0007 | improve mount | 93 |
| 97 10 28 | 23:35 | 0003 | 0006 | 0005 | 0007 | improve mount | 93 |
| 97 10 29 | 19:20 | 0004 | 0006 | 0005 | 0007 | improve mount | 97 |
| 97 10 30 | 00:50 | 0004 | 0006 | 0003 | 0007 | improve mount | 98 |
| 97 12 24 | 21:55 | 0004 | 0006 | 0007 | suspicious RH? | 170 | |
| 97 12 27 | 20:30 | 0004 | 0005 | 0006 | 0007 | bear repair | 125,155,173 |
| 97 12 31 | 23:35 | 0004 | 0005 | 0006 | 0003 | test | 180 |
| 98 01 08 | 06:10 | 0004 | 0005 | 0006 | 0007 | sonic heaters | 195 |
| 98 01 13 | 20:35 | 0004 | 0005 | 0007 | sonic heaters | 213 | |
| 98 01 14 | 03:15 | 0004 | 0005 | 0007 | 0006 | sonic heaters | 212 |
| 98 01 15 | 19:55 | 0006 | 0005 | 0007 | sonic heaters | 217 | |
| 98 01 21 | 00:40 | 0006 | 0005 | 0007 | 0003 | sonic heaters | 225 |
| 98 02 03 | 22:15 | 0005 | 0007 | 0006 | repair beacon | 243 | |
| 98 02 09 | 00:40 | 0003 | 0007 | 0006 | repair beacon | 242 | |
| 98 02 26 | 01:15 | 0003 | 0007 | 0005 | test? | 280 | |
| 98 03 31 | 01:05 | 0003 | 0001 | 0005 | bear repair | 344 | |
| 98 04 06 | 22:35 | 0003 | 0006 | 0001 | 0005 | resurrected stn 2 | 362 |
| 98 05 11 | 22:45 | 0003 | 0006 | 0001 | 0007 | check spare | 461 |
| 98 05 25 | 22:20 | 0003 | 0006 | 0005 | 0007 | bad RH | 485 |
At the start of the project, there was spiking at a rate of roughly once per 2 hours on the data output by the NCAR hygrothermometer, including the data from the Vaisala 50Y, the supplementary thermistor, and the electronic compass. The cause was traced to a spurious character that intermittently occurred in the serial output message of the hygrothermometer, and this was fixed by modifying the EVE station software configuration to ignore the spurious character. The new configuration was downloaded at station 4 on October 23, at station 1 on October 24, and at stations 2 and 3 on October 26. These spikes were removed during post-project data processing by applying a 1-hour median filter to the hygrothermometer data during this period. Note that this filter also suppresses valid maxima or minima within the 1-hour window in the same manner as erroneous spikes, reducing the variance of the time series.
During SHEBA field operations, it was noted that the 50Y PRT was usually from 0 to 0.2 °C warmer than the thermistor, although the laboratory calibration of both transducers is accurate to better than 0.1 °C. The PRT is the standard Vaisala 50Y temperature sensor and is enclosed, along with the humidity sensor, in a porous shield designed to protect the humidity sensor from contamination. The thermistor was mounted external to the porous shield. We suspect that the PRT was not dissipating its self-heating as effectively as the thermistor sensor, because the porous shield restricts the heat exchange with the ambient air. This explanation is supported by a series of simple tests carried out in early March 1998: when the porous shield was removed, the temperature of the PRT was no longer higher than that of the thermistor, and when it was replaced, the PRT was again warmer than the thermistor. Thus the thermistor data might be expected to better represent the ambient air temperature, but the 50Y PRT data should be used (above -35 °C) to convert the 50Y relative humidity measurements to ambient mixing ratio. The hour-average air temperatures calculated during post-project processing of the data are the PRT temperature above -35 °C (as determined by the PRT) and the thermistor temperature below.
7.0 Radiometers
7.1 Instrumentation
Kipp and Zonen model CM21 pyranometers and Eppley model PIR pyrgeometers were used to monitor the incoming and outgoing, short-wave and long-wave radiation.
Rimed Radiometers
J. Militzer
The pyranometers deployed during SHEBA97 were the standard model produced by Kipp and Zonen. However, the pyrgeometers were specially modified to NCAR specifications by Eppley Laboratories. In order to reduce the reliance upon periodic servicing, the battery powering the temperature compensation circuit was replaced with a voltage standard circuit, mounted on an internal electronics board, fitted inside the radiometer cavity. Two additional thermistors were attached to the inside of the dome to ensure that a more representative dome temperature was monitored. These three dome thermistors were connected in series, and the dome temperature was derived using the total resistance. The values of the response of the thermopile (Rpile) and of the temperatures of both the case (Tcase) and the average temperature of the dome (Tdome) were all recorded separately.
Both types of radiometer were mounted in circular PVC ventilator housings fitted with Eppley radiation shields. Ventilation of the radiometers was provided by circulating air into the plenum of the housing and venting through the annular slot surrounding the radiometer dome. The four housings were attached to an adjustable platform fitted with an electronic electrolytic level to allow the horizontal aspect of all four, two upward- and two downward-viewing, radiometers to be established and monitored. The platform was affixed to the end of a four meter boom canter-levered out from the flux station tripod, two meters above the surface.
7.2 Data Processing
The raw voltage data from the radiometer array corresponding to:
pyranometer.up (thermopile)
pyranometer.down(thermopile)
pyrgeometer.up (thermopile, Tdome, Tcase)
pyrgeometer.down (thermopile,Tdome, Tcase)
was input to a Campbell CR10 data logger mounted on the flux station tripod. Calibration factors and coefficients loaded in the memory of the data logger enabled these voltages to be converted to engineering units. This data was sent in serial form to the Eve computer at a rate of 1 Hz. The values of four components of the surface radiation budget, Rsw.in, Rsw.out, Rlw.in and Rlw.out can be calculated from the measured parameters.
For the pyranometer, the calibrated response of the thermopile directly yields the measured visible radiation flux.
Rsw = cswVsw
where Rsw is the short-wave radiation flux, csw is a calibration constant and Vsw is the voltage output of the radiometer.
For the pyrgeometer, the situation is more complex because of the sensitivity of the long-wave radiation sensor to thermal effects beyond the simple response of the thermopile. The thermopile voltage Vlw responds to the long-wave radiation flux absorbed by the thermopile,
Rpile = clwVlw
where Rpile is the signal associated with the portion of the long-wave radiation flux absorbed by the thermopile and clw is a calibration constant
However, three corrections are required to this simple relation in order to obtain the long-wave radiation flux. The pyrgeometer thermopile response under-estimates the intercepted infrared radiation because the top surface of the pyrgeometer thermopile re-emits infrared radiation proportional to its absolute temperature. Hence an additional term Cc, dependent upon the temperature of the top surface of the thermopile, must be added to the output of the thermopile in order to obtain the true estimate of energy arriving at the pyrgeometer. For each pyrgeometer the temperature of the case housing the thermopile Tc is measured and Cc is calculated from the Stefan-Boltzman relation,
Cc = sigma Tc4
where sigma is the Stefan-Boltzman coefficient, 5.67 x 10⁻⁸, and the temperature Tc is in °K.
The pyrgeometer thermopile views the environment through the pyrgeometer dome. Because the dome is not completely transparent in the long-wave spectral region, the dome's own temperature contributes to the radiation received by the thermopile. A correction Cdc is calculated using the relationship,
Cdc = sigma Adc (Td4- Tc4)
where the value of the coefficient Adc is subject to uncertainty and values from 1.1 to 3.0 have been suggested. Here the dome temperature Td, again in °K, is determined from the average resistance of the three dome thermistors. This contribution, Cdc, must be subtracted from the thermopile output.
Finally, The pyrgeometer has a partial sensitivity to short-wave radiation due to the incomplete optical cut-off of the vacuum-deposited interference filter below 3 µm. This requires a correction.
Cv = Av Rsw
This correction, too, must be subtracted from the pyrgeometer output. Again, there is uncertainty as to the best value for the coefficient Av.
The correction terms applied to the pyrgeometer response yield the true value of the infrared radiation flux.
Rlw = Rpile + Cc - Cdc - Cv
Because all the individual sensor parameters involved are measured and archived, the four radiation components are calculated afresh each time that they are required. This procedure allows the values for the coefficients involved to be set according to preference during post-deployment analysis.
7.3 Calibration
Both pre- and post- deployment calibrations of the radiometers were carried out for all radiometers. To compensate for the variation of radiometer response throughout the duration of the program, simple linear interpolations between the pre- and the post calibration factors were used for the radiometers throughout the program. The differences between the pre-project and the post-project thermopile response were less than 1% for the pyranometers, but for the pyrgeometers the differences ranged from 0.091% to 5.54% with a mean of 2.19%. The changes in the thermistor calibrations were negligible. The internal precision of the group of eight pyrgeometers is estimated to be within 3 W/m², and the overall accuracy to be 5 W/m².
The pyranometer calibration was undertaken at the NOAA/CMDL Solar Radiation Facility (SRF), in Boulder, Colorado, under the supervision of Donald Nelson. The SHEBA pyranometers, together with SRF calibration-standard pyranometers, were exposed to daylight on the roof of the SRF building, for a period of two months, both before and after the SHEBA field program.
The pyrgeometer calibration involved both the black body radiation response of the sensor thermopile and the temperature calibration of the sensor thermistors. The black body radiative response for the pyrgeometers was carried out under the supervision of Ellsworth Dutton of ERL/NOAA in Boulder, Colorado following the procedure described in Dutton, 1993, (Dutton, E.G. 1993, "An extended comparison between LOWTRAN7 computed and observed broadband thermal irradiances: global extremes and surface conditions", J. Atmos. Ocean. Technol., 10, 326-336). This procedure provided both the calibration constant for the the thermopile, clw, and the coefficient used to make the dome-case temperature-difference correction, Adc.
The temperature calibration of the pyrgeometer thermistors was undertaken in the NCAR Sensor Calibration Laboratory. The pyrgeometers were calibrated in an associated Environmental Systems, Model SD 308 temperature calibration chamber. For each pair of pyrgeometers, a previously-calibrated platinum resistance thermometer was used as a reference and was attached to the top of the pyrgeometers near the domes. The instruments were then surrounded with a thin layer of insulation to ensure minimal temperature gradients. A temperature range of 10 °C to -40 °C was covered. From 10 °C to -30 °C, steps of 10 °C were imposed. Below -30 °C smaller steps were used. For the higher temperatures, a typical soak time of 2 hours was used to ensure stability and minimize any spatial gradients. For the lower temperatures, a 4 hour soak time at each point was used. The temperature accuracy is estimated to be ± 0.05 °C.
7.4 Radiometer Mounting
The radiometers were mounted in circular PVC ventilator housings. Different heights of the internal mounting bases ensured that the radiation-sensitive elements of the two dissimilar sensors, the Kipp and Zonen pyranometer CM21 and the Eppley pyrgeometers, were brought to the same level. Eppley radiation shields attached to these circular housings provided identical exposures, so that when mounted side-by-side neither radiometer impinged upon the other's field of view. Ventilation of the radiometers was provided by circulating air into the plenum of the housing and venting through the annular slot surrounding the radiometer's dome. A great deal of effort was expended, throughout the program, to improve the effectiveness of ventilation.
When the radiometer array was serviced, care was taken to avoid unnecessary disturbance of the snow surface in the field of view of the down-looking radiometers. Although some disturbance was caused, it was noted that the wind quickly restored the natural condition of the surface. The height of the radiometer array above the local surface varied throughout the program as snow built up or was eroded. Table 7.1 shows the heights of the downward-looking radiometers with dates, based on logbook entries. Note that some logbook entries referred to the height of the boom. These boom heights were adjusted to yield radiometer heights by subtracting 15 cm.
Table 7.4 Heights of Down-Looking Radiometers
Station 1 Station 2 Station 3 Station 4
Date Height Date Height Date Height Date Height
98 04 07 1.58 m 98 04 16 1.83 m 98 04 14 1.40 m 98 04 21 1.75 m
98 06 12 1.37 m 98 06 12 2.08 m 98 06 19 1.56 m 98 06 08 1.75 m
98 06 22 1.58 m 98 06 23 2.12 m 98 06 30 1.64 m 98 06 13 1.72 m
98 07 06 1.66 m 98 07 08 1.65 m 98 07 09 1.79 m 98 07 29 1.96 m
98 07 22 1.87 m 98 07 25 2.29 m 98 07 31 1.76 m 98 08 26 2.05 m
98 08 04 1.97 m 98 07 31 2.42 m 98 08 10 1.83 m 98 09 08 2.00 m
98 08 29 1.93 m 98 08 08 2.27 m 98 08 25 1.85 m 98 09 28 1.90 m
98 09 28 1.90 m 98 08 10 2.39 m 98 09 28 2.13 m 98 09 30 1.88 m
98 09 30 1.91 m 98 08 26 2.29 m
98 09 28 1.82 m
7.5 Radiometer Array Locations
Four SSSF radiometer arrays were deployed for the duration of SHEBA.
Radiation array #1 was located at Station 1, Atlanta, for the duration of the field program.
Radiation array #2 was located at Station 3, Baltimore, for the duration of the field program.
Radiation array #3 was originally installed at Station 2, Cleveland, but was moved to Station 4, Florida, on November 1, 1997. It subsequently remained at Florida for the duration of the field program.
Shortly after the set-up of the Cleveland station in late October, the dome temperature data from the radiometer array was often 15-25 °C too high. After several attempts to resolve the problem by adjusting the cabling, terminating open channels and changing the delay times for the multiplexer relay, it was surmised that the multiplexing function of the CR10 Campbell data-logger was at fault. A temporary replacement of the original data-logger with a spare data-logger, into which the appropriate coefficients had been loaded, did not solve the problem as the replacement also exhibited multiplexing difficulties. The other stations did not exhibit this problem and a decision was made to swap the Cleveland data logger, together with the associated radiometer array, with the equivalent system from Florida. The problem-prone system was then closer to the ship and easier to work on. This exchange took place on 1 November and the data loggers were reprogrammed with the appropriate coefficients. The two radiometers arrays remained in their new assignments throughout the duration of SHEBA. Further tests were carried out on the radiometer array/Campbell now at Florida. A light bulb heater was installed in the Campbell box to keep the multiplexer slightly warm. By 18 November the light bulb operating at full power was sufficient to maintain the operation of the multiplexer. New multiplexers for the Campbells were shipped the SHEBA ice camp in mid December and the malfunctioning unit was replaced. Thereafter, the problem did not reoccur.
Radiation array #4 was originally installed at Station 4, Florida, but was moved to Station 2, Cleveland, on November 1, 1997. It subsequently remained with Station 2 for the duration of the field program.
General descriptions of the four sites are given in Section 4. The down-looking radiometers at Atlanta and Baltimore viewed the local snow-covered sea ice throughout most of the duration of the field program. From late July/early August the situation became more complex as first localized, and then more wide-spread, surface melting occurred. Logbook entries after late August mention melt ponds surrounding the remote stations, sometimes covered in refrozen slush. A lead did open very near the Florida array in April, but the surface under the Florida array generally appears to have been subjected to less melt-water ponding and, even during the summer, the Florida down-looking radiometers viewed snow and ice.
Radiometers over water (P. Guest, August 22, 1998)
The Cleveland station was involved with a pressure ridge in early February and the array was damaged by the ice. In April, the radiometer array was reinstalled on a three-legged stand independent of the PAM tripod and mast supporting the other sensors. This enabled the radiation array to be positioned anywhere in the general vicinity of the station. On 3 April this system was erected near Florida, and was then moved to the Seattle site on 16 April. At Seattle in late April a lead opened within 15m of the array. Subsequently, other leads opened and on 6 June there was open water within 6m of the array.
The station was moved on 8 June and June was re-established at the Maui site on 10. By this time melt-water ponds began to appear in the vicinity. On 25 July it was noted that although the radiometers were above white ice, the surrounding melt-water ponds would be within their field of view. The tripod was repositioned on 8 August so that the radiometers viewed the open water. From this date until Maui was decommissioned, on the 20 September, the radiometer array remained over a pond. The pond sometimes was open and sometimes partially covered with ice, described variously as brash, finger-rafting, white and new grey ice.
7.6 Level Sensors
The vertical orientation of the radiometer array was monitored continuously with an orthogonal pair of electronic level sensors. These sensors were nominally oriented at 45° to the axis of the boom supporting the radiometer array, in order to be aligned with the level adjustment axes of the array.
During the initial deployment of the SHEBA Flux-PAM stations, it was apparent that a null output of the electronic levels at Baltimore did not correspond with a level orientation of the radiometer array, and the radiometers could only be properly oriented with a bubble level. However, it appears that the radiometer arrays at the other stations were initially leveled using the electronic level sensors as a reference. Then in March or April 1998, NCAR staff discovered that the electronic level manufacturer had not informed them about known offsets in the sensors. Subsequently, this was not always fully appreciated by the field staff and a degree of confusion prevailed throughout the project about the proper reference for leveling the radiometers.
Fortunately each of the SHEBA radiometer arrays was leveled periodically with a bubble level, and the electronic level data immediately following those leveling events appear to be sufficiently consistent throughout the project to warrant using them to correct the data. The following tables list the offsets measured during those leveling events that appear to be valid. After removing these offsets from the data, it appears that the radiometers were generally maintained within 1°-1.5° of level, were often level to better than 1°, and were occasionally out of level by at most 2°-2.5°.
Table 7.6.1 Radiometer Level Offsets
Station 1 Station 2
Date Time lev.x
(deg) lev.y
(deg) Date Time lev.x
(deg) lev.y
(deg)
GMT GMT
98 03 09 21:00 -0.98 0.12 98 04 08 22:45 0.24 0.42
98 03 31 23:00 -1.06 -0.06 98 04 18 04:30 0.04 0.52
98 04 08 00:30 -0.98 0.02 98 04 30 21:30 0.10 0.48
98 04 18 21:00 -1.12 -0.08 98 05 08 19:15 -0.08 0.24
98 04 21 20:00 -1.04 0.10 98 06 26 23:15 -0.10 0.88
98 05 08 00:30 -1.08 0.08 98 07 07 18:40 -0.02 0.44
98 07 06 18:20 -1.12 0.17 98 07 14 22:30 0.22
98 07 21 19:30 -1.01 -0.06 98 07 23 23:15 0.18
98 07 25 01:00 -0.86 0.10 98 07 30 22:15 0.22
98 07 28 23:00 -0.97 0.06 98 08 07 23:45 0.10
98 08 03 23:00 -0.92 -0.10 98 08 10 23:45 -0.08
98 09 06 22:50 -0.22
7.6.1 Station 1 (Atlanta)
The radiometer array at Atlanta was not leveled with a bubble until March 1998. However the offsets measured from March through August are internally consistent and are assumed to apply for the entire project. The median values of the observed offsets are -1.01° in x and 0.06° in y; the maximum deviation of the measured offsets from the median values is 0.16°.
With the exception of leveling events, the radiometer levels remained fairly steady until mid-March and then again from mid-August through September. From mid-March until mid-August, settling of the PAM tripod and radiometer legs caused changes of the radiometer level on the order of 0.5°-0.6°. In late March and April this settling is inferred to have been caused by nearby lead activity, and from June until August it was caused by melting of the snow and ice. Note that the radiometers were erroneously `leveled' using the electronic levels at 00:20 GMT on June 27, causing a leveling error of 1.1° in x, and were correctly leveled again at 18:40 GMT on July 6. The maximum deviations of the radiometers from horizontal from October 1997 until March 1998 are inferred to be 1.0° in x and 0.3° in y. The maximum deviations of the radiometers from horizontal from March to September 1998 were 1.1° in x and 0.6° in y.
7.6.2 Station 2 (Cleveland, Seattle, Maui)
Campbell data logger #3 and radiation array #3, originally installed at Cleveland, had a cold temperature problem with the data logger multiplexer. Consequently logger and radiation array #3 were swapped with units #4 from Florida on November 1. Radiation array #4 was not leveled with a bubble until April 8, after Station 2 was resurrected at the Seattle site. Station 2 was moved to the Maui site on June 10 and decommissioned on September 20. On July 8, the y axis of the radiometer levels failed. The levels were replaced on August 22, but the y axis data appear to remain defective. The level offsets are moderately consistent from April through August 22, after ignoring the data from a few anomalous leveling events. The medians of the offsets during this period are 0.1° in x and 0.46° in y; the maximum deviations of the measured offsets from the median values are 0.2° in x and 0.4° in y. These values are presumed to also apply during October 1997 at the Florida site and from November through February at the Cleveland site. The offset of the x axis of the levels installed on August 22 is assumed to be -0.22°, the only measurement available.
The radiometer levels remained fairly steady while Station 2 was at the Cleveland site (November through February) The maximum deviations of the radiometers from horizontal at the Cleveland site are inferred to be 0.2° in x and 0.6° in y. The radiometer levels were also fairly steady at the Seattle site until the end of May when surface melting and nearby active leads caused larger movements of the radiometers. The maximum deviations of the radiometers from horizontal in early June were 0.4° in x and 2.1° in y.
There was considerable movement of the radiometers from June through August 22, while station 2 was at the Maui site, associated with melting, cracking and ridging of the floes. The maximum deviations of the radiometers from horizontal during this period were 1.5° in x and, prior to July 8, 2.2° in y. The extreme in the y axis occurred following a spontaneous jump of 2° in the level output on June 22, and it is possible that this was an early symptom of the more obvious failure of the y axis on July 8.
Table 7.6.2 Radiometer Level Offsets
Station 3 Station 4
Date Time lev.x
(deg) lev.y
(deg) Date Time lev.x
(deg) lev.y
(deg)
GMT GMT
97 10 12 22:00 1.12 2.84 98 04 02 01:30 0.44 0.0
98 04 15 01:30 0.40 -0.28 98 04 09 05:15 0.48 0.10
98 05 02 22:00 0.42 -0.40 98 04 20 23:30 0.38 -0.02
98 05 12 21:30 0.42 -0.34 98 05 08 18:10 0.38 -0.06
98 06 29 18:30 0.24 -0.14 98 06 06 23:30 0.46 -0.24
98 07 09 18:00 0.38 -0.32 98 08 01 19:15 0.40 0.24
98 07 20 23:30 0.44 -0.56 98 08 03 00:00 0.40 0.00
98 07 30 18:30 0.58 -0.32 98 08 07 20:00 0.44 0.08
98 08 10 23:00 0.62 -0.64 98 08 11 22:00 0.28 0.00
7.6.3 Station 3 (Baltimore)
The radiation array at Baltimore was leveled with a bubble during the station installation in October 1997 and the offsets, 1.12° for x and 2.84° for y, are presumed to apply until March 18, when a new level sensor was installed at Baltimore. For March through September, the medians of the observed offsets are 0.42° in x and -0.33° in y; the maximum deviation of the measured offsets from the median values is 0.3°. On August 24, the radiometer level was obviously adjusted during a site visit, but the adjustment was not mentioned in the logbook and the implied y axis offet is not consistent with previous values. Then the logbook records a site visit on September 6 and notes that the radiometers were adjusted using a bubble level, but no adjustment is apparent in the data. These last two events have been ignored in estimating the level offsets.
From October through March, the radiometer levels at Baltimore were fairly steady; the maximum deviations of the radiometers from horizontal were 0.4° in x and 0.3° in y. From April through September, the maximum deviations of the radiometers from horizontal were 0.7° in x and 1.7° in y. These extremes occurred because of tripod settling during surface melting from mid-June through mid-August.
7.6.4 Station 4 (Florida)
The radiation array at Florida, #3, was originally installed at Cleveland, but those two arrays were swapped in early November because of the multiplexer problem at Cleveland. Radiation array #3 appears not to have been properly leveled until April 2, 1998, following a move of the station to a new location. The level offsets are moderately consistent from April through August, after ignoring the data from a few anomalous leveling events. The medians of the offsets during this period are 0.4° in x and 0.0° in y; the maximum deviations of the measured offsets from the median values are 0.1° in x and 0.24° in y. These offsets are presumed to also apply during October 1997 at the Cleveland site and from November through March at the Florida site.
With the exception of leveling events, Florida radiometer levels were fairly steady from October 1997 through the end of May. The deviations of the radiometers from horizontal at the end of October are inferred to be 0.4° in both x and y. The maximum deviations of the radiometers from horizontal from November through May are 0.9° in x and 0.6° in y. In early June, the radiometers were at times out of level by 5° or more due to rapid melting of the surface. This was fixed on June 5 and 6 by moving the tripod and installing plywood ablation shields; however surface melting and settling of the tripod continued until the end of August. The maximum deviations of the radiometers from horizontal after June 6 were 2.1° in x and 1.5° in y.
7.7 Riming/Ventilation
7.7.1 Introduction
Ventilation of the radiometer domes is an important consideration in the Arctic sea ice environment. When leads of open water are formed, warm sea-water is exposed to the cold atmosphere. Water evaporates and quickly condenses to yield a supercooled water fog, termed `smoke'. This supercooled water fog freezes on exposed surfaces to yield rime, a fluffy low-density deposit. In addition to the riming mechanism, there is also the possibility of the direct deposition of hoar from the vapor phase, when locally supersaturated air encounters the cold surfaces. Irrespective of the specific mechanism of production and whether the deposit was either rime or hoar, the effect of the growth of the low-density frost deposit was to degrade the response of the radiometers.
For the short-wave radiometer the effect can range from a partial reduction of light intensity due to obstruction when the dome is covered with frost, to an apparent enhancement of light intensity when low angle direct sunlight illuminates a partial frost covering and scatters light directly into the radiometer. For the long-wave radiometer the effect can be more subtle. A covering of frost results in the radiometer sensing infrared radiation associated with the frost itself, which is at the ambient air temperature, rather than the true incident radiation. The contribution of this component of the radiation depends on the extent of coverage. Any significant frost coverage of the radiometers renders the radiation data suspect. During the passage of supercooled fogs it would be very difficult to avoid the deposition of rime/hoar. However, there was the hope that, after the condition had abated, ventilation of the domes with under-saturated ambient air would result in the removal of the frost. Heating of the air, even by a fraction of a degree, would enhance this effect. A serious limitation which constrained the efficiency of the ventilation of the Flux-PAM radiometer array was the total amount of power available at the remote stations. Only 20-30 Watts was generated by the thermo-electric generators for the operation of all functions of the remote station. Of this, only ~8 Watts was available for ventilation and/or heating, ~2 Watts per radiometer.
7.7.2 Ventilation/Heating of Radiometers
A succession of different ventilation/heating systems were devised for the radiometer arrays over the first several months of the SHEBA deployment.
Single fan ventilator
E. Andreas, October 12, 1997
The original system, installed when the stations were initially deployed, employed a single 0.7 Watt, 4.5 cm square Comair Rotron muffin fan mounted in an enclosure with flexible ducts to deliver air to the four separate ventilator housings. This was ineffective and successive changes were made to attempt to improve the ability to remove frost. On October 22, resistance heaters were installed in the outlets of the fan enclosures at Cleveland and Florida, Baltimore was modified on November 11, and Atlanta was also modified in the latter time period. Although shipboard measurements definitely indicated that this modification increased the temperature of the outflow, in the arctic environment this heat appeared to be dissipated before it could affect the radiometers. Prior to their replacement by subsequent ventilator systems, the single-fan, four-duct configurations were modified in the field by restricting the ventilation to two ducts at Atlanta and only one at Baltimore. In no configuration was the system effective and, on December 13, a new design was introduced for testing at Florida. Cylindrical 3-cm-diameter, 0.4 Watt, Micronel ducted axial fans were fitted to each of the four radiometer ventilator housings in small insulated holders which contained 1 Watt resistance heaters. By December 17 it was observed that these new `turbo' ventilators were also not successful in keeping frost from the domes, but they were retained until February.
The next variant, tested at Florida during late February, removed the resistance heater from the axial fan holder and utilized six 0.2 Watt resistance heaters, installed in the ventilation plenum distributed around the ventilator slot. Again the ventilator/heater combination failed to prevent the accumulation of rime.
Juice can ventilator intakes
E. Andreas, May 17, 1998
A final configuration involved milling a rectangular hole in the side of the ventilator housings and mounting the original 0.7 Watt Comair Rotron fans within cowls fitted directly on each ventilator housing. These rectangular ventilators were first installed at Florida (4 March) and Atlanta (9 March), utilizing materials available from the ship. The cowls for these ventilators were fabricated from the brightly colored fruit juice containers shown here.
Machined ventilator intakes
E. Andreas, May 16, 1998
Later, custom-made cowls were manufactured at NCAR and shipped to the SHEBA ice camp. The Cleveland and Baltimore radiometer arrays were fitted with this form of ventilator on April 4 and 14, respectively. The air-flow produced by these individual, cowl-mounted external Comair Rotron fans was comparable to that for the line-powered ventilators of the ship-based NOAA Environmental Technology Laboratory (ETL) radiometer array and the NOAA Atmospheric Radiation Measurement group (ARM) radiometer array, but was not as efficient in defrosting the radiometers. The line-powered ventilators consumed ~20 Watts to produce the air-flow, and apparently the additional heating due to this greater power dissipation made the critical difference that kept the ETL and ARM radiometers generally rime-free.
In addition to the improvements in the ventilation to reduce the riming of all radiometers, the Kipp and Zonen incoming and outgoing short-wave radiometers were specifically modified using electrical resistance heater elements. Starting with the Florida radiometers on 10 April, 2.5 Watt, 30 ohm Minco heating elements were introduced into the short-wave radiometer inter-dome space. Addition of the Minco heating elements was subsequently carried out for Baltimore, Seattle, and Atlanta on April 14, 19 and 22, respectively.
7.7.3 Investigation of effects of removal of Kipp and Zonen outer dome.
When Station 2 was initially resurrected adjacent to Florida in April 1998, an experiment was undertaken to determine the effect of the removal of the pyranometer outer dome on both the calibration and the riming characteristics of the radiometer. This was motivated by the observation in the field that the double-dome pyranometers generally became rimed before the adjacent single-dome pyrgeometers. On April 4, the outer domes of the Station 2 pyranometers were removed, and for the following week the radiometers were operated with only the single inner dome. The result of the week-long study was that the riming of the Station 2 single-dome pyranometers was slightly less than that of the Florida double-dome pyranometers. However, inspection of the short-wave radiation flux data indicated that the flux measured by the Station 2 single-dome pyranometer was ~5-8% greater than the flux measured by the adjacent Florida array. With such a minimal improvement in the riming characteristics and a noticeable change in the response, it was decided to abandon the idea of removing the outer domes.
7.7.4 Manual cleaning
During the course of station visits, the radiometers were often manually cleaned to remove frost and ice deposits, although in some cases the record indicates that the deposits were resistant to these attempts. Tables 7.7.1-7.7.4 list the recorded manual cleaning incidents, including references to the corresponding logbook entries. It is certainly likely that additional manual cleaning events occurred which were not recorded.
7.7.1 Site 1, Atlanta
Date Time Event Log Date Time Event Log
GMT GMT
97 10 16 ? Ice on domes 41 98 03 20 12:00 Cleaned domes 328
97 10 25 21:00? Cleaned all sensors 97 98 03 31 22:00 Cleaned SW domes 346
97 12 23 20:00 Cleaned domes 167 98 04 06 23:00 Cleaned SW domes 365
97 12 23 20:30 Cleaned domes 187 98 04 11 23:30 Cleaned domes 384
98 01 15 20:00 Cleaned domes 217 98 04 18 20:00 Cleaned domes 404
98 02 0 2 08:00 Frost on domes 242 98 04 21 18:30 Cleaned domes 414
98 02 08 23:45 Could not clean domes 249 98 04 28 23:00 Cleaned domes 434
98 02 11 19:00 Cleaned domes 274 98 07 21 9:30 Cleaned domes 592
98 03 05 20:00 Removed array 299 98 08 03 15:00 Cleaned domes 614
98 03 09 20:00 Replaced array 308 98 08 14 20:00? Ice on domes 635
Table 7.7.2 Site 2, Cleveland/Seattle/Maui
Date Time Event Log Date Time Event Log
GMT GMT
97 10 12 19:00? Set-up 37 98 04 04 04:00 Restarted station 353
97 10 19 22:30 Cleaned domes 52 98 04 10 15:00 Reinstalled outer domes 375
97 10 22 22:00 Removed array 56 98 04 12 02:15 Cleaned domes 382
97 10 21 22:00 Replaced array 59 98 04 19 22:45 Cleaned SW 409
97 12 18 19:30 Cleaned domes 155 98 04 22 23:00 Replaced SW dome 418
97 12 27 20: 00? Cleaned domes 173 98 05 28 02:00? Ice on domes 489
98 01 05 20:00? Frost on domes 191 98 07 06 19:00 Cleaned SW domes 571
98 01 17 20:00 Cleaned domes 220 98 07 23 23:00 Cleaned domes 595
98 02 06 06:00 Cleveland damaged 258 98 08 10 23:30 Cleaned domes 625
Table 7.7.3 Site 3, Baltimore
Date Time Event Log Date Time Event Log
GMT GMT
97 10 12 21:00 Set-up 33 98 03 04 20:30 Cleaned domes 296
97 10 16 00:00? Ice on SW domes 42 98 03 18 20:00 Cleaned domes 324
97 12 24 20:30 Cleaned domes 170 98 03 31 01:00 Removed array 344
98 01 01 21:00 Cleaned domes 183 98 04 14 17:00 Replaced array 395
98 01 13 21:00 Cleaned domes 213 98 05 01 23:00 Cleaned SW domes 443
98 02 18 00:00? Cleaned domes 264 98 08 10 23:00 Cleaned domes 626
Table 7.7.4 Site 4, Florida
Date Time Event Log Date Time Event Log
GMT GMT
97 12 14 00:00 Removed/
reinstalled array 142 98 03 05 00:00 Replaced array 297
97 12 17 01:00 Cleaned domes 148 98 03 07 22:00 Cleaned domes 304
97 12 20 08:30 SW domes frosted 161 98 03 08 2000? Cleaned SW domes 306
97 12 23 23:00 Cleaned domes 168 98 03 13 20:00 Cleaned domes 315
97 12 29 22:45 Cleaned domes 175 98 03 16 18:30 Cleaned domes 320
98 01 08 20:00 Removed array 201 98 03 22 18:00 Cleaned domes 331
98 01 09 18:00 Replaced array 205 98 03 24 22:30 Cleaned domes 336
98 01 10 20:30 Cleaned domes 208 98 04 03 18:00 Cleaned domes 351
98 01 11 23:15 Frost on domes 209 98 04 05 18:00 Cleaned domes? 359
98 01 31 ??:?? Cleaned domes 239 98 04 09 00:00-
06:00 Removed/
reinstalled array 369
98 02 03 20:00? Frost on domes 243 98 04 21 19:15 Cleaned domes 413
98 02 21 22:00 Removed array 270 98 05 08 21:00 Cleaned domes 455
98 02 24 20:00 Replaced array 277 98 08 07 19:00 Cleaned domes 619
98 02 28 00:00 Removed/
reinstalled array 286 98 09 18 20:00? Cleaned domes 696
98 03 02 01:00 Removed array 290
7.7.5 Riming Index
It was observed in the field, that whenever any one radiometer of the array became rimed, then generally all the radiometers also became rimed. Advantage can be taken of this by examining the response of the up-looking pyrgeometer. Any significant riming of the dome of the up-looking pyrgeometer results in the pyrgeometer viewing this frost coating rather than the sky. As this frost coating is at the ambient near-surface temperature there is a significant difference in the apparent energy flux. Examination of pyrgeometer data, when manual cleaning removed the frost coating the dome, allowed the magnitude of this difference to be seen. Between January 18-25, 1998, the radiation array at Florida was cleaned six times, and each time the rime re-established itself. As can be seen from Figure 7.1, step changes of 30 - 40 W/m², corresponding to a temperature difference of ~12 °C, were observed each time the rime was removed and the radiometer viewed the sky.
Manual cleaning of frost from R<sub>lw.in</sub> Figure 7.1 Manual cleaning of frost from the up-looking pyrgeometer at the Florida station.
Although the ETL and ARM down-welling long-wave radiation data did show a systematic difference of a few W/m², examination of their year-long record indicated that both normally remained rime-free. Assuming a spatially-homogeneous sky cover, the differences between the down-welling long-wave radiation data from the remote stations and the comparable data from the well-maintained ETL and ARM radiometers can provide a clue as to the riming conditions. Whenever the difference exceeds some threshold, then riming can be suspected on the remote station radiation array.
The down-welling radiation differences for each Flux-PAM station, referenced to both the ETL and ARM radiometers, are included in the hourly SHEBA data as Rlwdiff.in.ETL and Rlwdiff.in.ARM. Individual plots for Stations 1, 2, 3, and 4 show the index based upon the ETL data. It is suggested that whenever the value exceeds ~20 W/m², the radiation data from the remote station should be regarded with suspicion, as riming is likely to be present. It may be seen that riming conditions persisted throughout November, December, January and February, and then diminished, occurring much less regularly in the months of March, April and May, and were practically absent later in the year.
8.0 Snow/Ice Temperature and Heat Flux Sensors
8.1 Sensors
The temperature of the surface layer of the snow overlaying the sea ice and the heat flux between the snow layer and the sea ice were investigated using standard soil temperature probes and soil heat flux plates. The output of the sensors, Radiation Energy Balance Systems (REBS) models STP-1 and HFT-3.1, were input to the station Campbell CR10 data loggers, where the previously loaded calibration coefficients were applied. This calibrated data was then transmitted to the EVE data system.
8.2 Calibration
The calibration of the temperature probes was undertaken in the NCAR Calibration Laboratory. The sensors, together with a reference Standard Platinum Resistance Thermometer (SPRT) traceable to NIST, were immersed to a depth of 25 cm in a Hart Scientific 7040 calibration oil bath. The SPRT was interfaced to a Hart Scientific Super Thermometer bridge and a Keithley 2100 DVM was used to measure the analog output signals. The data from the temperature probes, together with that from the SPRT reference, was archived on a laboratory PC. A temperature range of from 10 °C to -40 °C was covered. From 10 °C to -30 °C steps of 10 °C were imposed. Below -30 °C smaller steps were used. For each temperature a typical soak time of 2 hours was used to ensure stability and minimize any spatial gradients in the oil bath. The calibration accuracy for the temperature probes is ±0.05 °C.
Prior to resurrecting Station 2 on April 11, a new temperature probe was shipped from NCAR before a good laboratory calibration could be completed, so that the calibration coefficients in the Campbell data logger were only approximate. Then on August 11, the calibration coefficients in the Campbell data logger were changed to values thought to be more appropriate for that sensor. Thus, in order to correct the archived data to the post-project calibration of this sensor, linear corrections were made to the data as follows:
April 11 - August 11: Tnew = 0.9888 x Told - 2.42
August 11 - end: Tnew = 0.9964 x Told - 0.84
The calibration of the heat flux plates was undertaken by REBS, who state an accuracy of ±5%.
8.3 Installation
Ed installing ice sensors (J. Militzer)
The transient nature of the sea-ice surface resulted in a more complex situation than that of the equivalent situation in soil, for which the sensors were designed.
At the set-up of the stations, the sub-surface temperature probes and heat-flux plates were installed at the snow/ice interface, in the vicinity of one leg of the radiation stand. The temperature probes and heat-flux plates were inserted in a horizontal position, with the white dot on the heat-flux plate uppermost. The cabling was buried to the same depth for a length of 0.5 m or more. Although it was not always specifically mentioned, it may be assumed that the same procedure was followed whenever stations were repositioned. Atlanta and Baltimore were never repositioned, but Florida was moved on 1 April to a new location 35 m west of its original location and Station 2 was moved four times. The first relocation of Station 2 was when it was resurrected in the vicinity of Florida and the temperature probe and heat flux plate were installed on 10 April. On 16 April the station was moved to the Seattle site and on 10 June moved again to the Maui site. Finally, on 8 August, the Maui radiometer array was repositioned over a nearby melt pond.
In addition to the comprehensive disturbance of the sub-surface sensors upon station reestablishment, other situations conspired to modify the sensors integrity within the sub-surface. The continual occurrence of wind and snow affected the nature of the exposed surface. Thus, the effect of deposition, erosion and ablation, all occurring at different times, continually altered the burial depth of the sensors and sometimes resulted in the exposure of the sensors. The underlying sea ice was in constant stress and, at times, leads and pressure ridges formed which interfered with measurements. The opening of a lead in the immediate vicinity of the Florida array on 14 March and again on 22 March resulted in breaks in the sub-surface sensor wiring. Even the local animals were assertive. Polar bear activity was the cause of damage to the sensors at the Cleveland site on 18 December and at the Maui site on 11 September.
8.4 Migration
However, the most persistent cause of sub-surface sensor disturbance during the SHEBA deployment was the effect of short-wave radiation penetrating the snow and being absorbed by the black bodies of the temperature probes and heat flux plates, causing them to warm. This not only yielded spurious data, but also generated local melting, causing the sensors to migrate and change orientation. This effect became important as summer conditions prevailed. As the intensity of sunshine increased, the snow/ice warmed to near melting. When radiation heating-caused migration occurred, the sensors would be found to reside at the end of a groove in the ice. Other causes of migration or realignment also ocurred, such as ice fracture, ablation and melt-water flooding.
It was in early July that the problem of migration became apparent. On 4 July it was noted at Florida that the heat flux plate had melted into the ice 12-15 cm and had tilted to vertical. The temperature probe had melted a hole 6-8 cm deep, which was full of melt-water. It was realized that the same situation could prevail at the other sites. On 6 July the temperature probe at Atlanta was found to be 20 cm below the surface, but there was no evidence of radiation heating. However on 6 July at Maui and on 9 July at Baltimore, evidence of radiation heating was evident. All the temperature probes and the heat flux plates were eventually retrieved, wrapped in aluminum foil and reburied. At Florida both probe and plate were wrapped on 5 July. At Maui both probe and plate were wrapped on 9 July. The probes at Baltimore and Atlanta were wrapped on 8 July, but there is some uncertainty as to when the corresponding plates were wrapped and reburied. By the middle of July all sub-surface sensor appear to have been wrapped in aluminum foil and reinstalled in the proper orientation at the snow-ice interface. This measure reduced the effect of radiation heating but did not prevent movement and tilting of the sensors. Indeed, the data suggest that diurnal radiative effects were persistent throughout the summer. From mid-July until the end of the SHEBA deployment, two and a half months later, melting of the surface and interchange of surface melt water and sea water rendered the conditions very complex, and the depths and orientations of the sub-surface probes became more and more uncertain. As can be deduced from the following observations, the movement and tilting of the sub-surface sensors continued. It can only be assumed that in every instance when the sensors were noted to be awry, they were subsequently properly reinstalled.
On 22 July the sensors at Atlanta were noted to be in water-filled cavities under the snow in tilted orientations. The probe was repositioned at this time and then again on 15 August. When the sensors were finally extracted at tear-down, on 1 October, they were found to have migrated further into the ice and to be tilted.
The Maui sensors also moved. On 10 August their aluminum foil was replaced and the sensors were repositioned. Because of the precarious location of Maui in the last months and the relocation of the tripod the sub-surface sensors were subjected to additional trauma.
On 22 July the Baltimore sensors needed to be repositioned. They had worked their way 6-7 cm into the ice and tilted to 45°. By 10 August the heat flux plate had again tilted to 30° and was 9 cm into the ice in a water-filled crevice. The temperature probe was 6 cm deep in a dry crevice. They were both repositioned again. When the station was decommissioned on September 21, both sensors were frozen deep in the ice. Since the sensors were abandoned, their final orientation is unknown.
On 19 July the Florida temperature probe needed to be repositioned. When the Florida radiometer array was leveled on 29 July, the sub-surface sensors were reinstalled. On 8 August the sensors were dug out from 8 cm of ice and reinstalled near the surface. When the station was decommissioned on 1 October both sensors were at the bottom of grooves extending from the top of the ice. The heat flux plate was canted to 30°.
Figure 8.1 shows the indicated snow/ice temperature at the four remote sites. The general trend of the temperature shows a broad minimum in mid-winter, from December to February, with a gradual increase, starting in March. As early as April, for Station 2, but then becoming apparent for the other stations, a diurnal temperature pattern becomes apparent. This may be due, in part, to the diurnal warming of the snow/ice, but probably is also an instrumental affect, caused by radiative heating of the probes. Wrapping the probes in aluminum foil was not completely effective. By the end of June, the influence of melt-water tends to bring all daily minimum temperatures to 0°C. The sub-surface temperature readings that exceed 0°C may be partially due to radiative heating of the probes. During the last month of the deployment the snow/ice temperature begin to decrease and the effect of melt-water decreases.
Snow temperatures
Fig 8.1. The temperature of sub-surface snow at the four remote sites.
The heat fluxes measured in the subsurface snow are plotted individually for Stations 1, 2, 3, and 4. Beginning with Station 2 in April, but then becoming apparent for the other stations, the affect of diurnal radiative heating becomes apparent. The aluminum foil wrapping in early July may have diminished the effect but did not eliminate it. During the summer, the plates tilted to different orientations and the measured heat flux becomes difficult to interpret. In September the traces begin to stabilize as the snow/ice begin to freeze again.
9.0 Sonic Anemometers
9.1 Summary
NCAR Flux-PAM stations used two different types of sonic anemometers over the duration of the SHEBA project. In October 1997, the PAM stations were instrumented with Gill R2 Solent sonic anemometers. In order to mitigate riming problems, three of these were replaced with Applied Technologies (ATI) sonic anemometers, beginning at the end of February 1998. A second measure to reduce the riming was the addition of electrical heaters on the sonic transducers, beginning in early January 1998. The use of ATI sonic anemometers and transducer heaters, along with the onset of spring, significantly reduced the loss of turbulence data due to riming after February 1998.
9.2 Laboratory testing of R2 Solent sonic anemometers
During planning for the SHEBA project, recognition of the potential for riming of the sonic anemometers led to the choice of the Gill Instruments R2 Solent for use on the Flux-PAM stations. This choice was based on their low power requirements, favorable NCAR experience with their operation during rainfall, Gill Instrument's published specification that they would operate down to -40 °C and with a coating of ice up to 2-3 mm thick, and a report from Andy Black at the University of British Columbia of successful operation down to -35 °C ("except when the coating of hoar frost or snow got too thick").
Since NCAR has only one Gill sonic anemometer, five additional R2 Solents were borrowed from Chris Fairall at NOAA Environmental Technology Laboratory, Carl Friehe at the University of California at Irvine, and Jim Edson at Woods Hole Oceanographic Institute. During the summer of 1997 these sonics were tested in the NCAR Sensor Calibration Laboratory for low-temperature operation. Tests were conducted in a chamber that was just large enough for a single Solent to fit diagonally between opposite corners, with the measurement array within a few inches of two of the chamber walls and the top of the chamber. The chamber temperature was typically ramped from 25 °C to -45 °C in a 12-hour period, held at -45 °C for one hour or more, and then ramped back up to 25 °C over another 12 hours. The sonic data were sampled at 21 Hz, and statistics (means, variances, etc.) were calculated in 5-minute blocks.
The principle statistics used to quantify sonic performance were the 5-minute variances of the three orthogonal wind components and sonic temperature. A more detailed look at a limited subset of the data used 10-minute calculations of the power spectra and cospectra. The performance of four of the sonics was acceptable down to -35 °C and somewhat degraded at lower temperatures. The velocity variances gradually increased with decreasing temperature, as an example from 0.05-0.10 m²/s² at 25 °C to 0.05-0.13 m²/s² at -30 °C. Below -30 °C the variances increased more rapidly, typically to 0.08-0.2 m²/s² at -40 °C. Below -30 °C there was evident noise contamination of the power spectra in the inertial subrange, particularly for sonic temperature. The contamination generally increased with decreasing temperature. Two of the sonics were not acceptable below -30 °C to -35 °C. Below those temperatures the variances increased very rapidly to levels of 10-100 m²/s² or more.
There was a noticeable and repeatable modulation of the variance amplitudes through the tested temperature range, with a period of 6-7 °C. This corresponds to one period of the 180 kHz sonic pulse. Angus Raby of Gill Instruments suspects that this is caused by reflections of the pulses from the walls of the chamber. This modulation was present for all R2 Solents, but was not present for an R3 Solent or a Campbell CSAT3 sonic. However it was possible to locate the Campbell sonic more centrally in the chamber (further from the walls), and it operates at 400 kHz, which would cause more atmospheric attenuation of the reflected signals. Angus also suggested that the more sophisticated 32-bit signal processing of the R3 and Campbell sonics is better able to discriminate against reflected signals. At the suggestion of Angus, it was tried (unsuccessfully) to attenuate the reflections with a thin layer of felt lining in the chamber. Thus the modulation was not an artifact of the chamber ventilation system, but it was not shown conclusively that it was caused by reflections from the chamber walls.
One of the poor-performance R2 Solents was sent to Gill Instruments for testing and it appears that they were able to identify one cause of increased variance below -30 °C. An ultrasonic transducer continues to ring for a time after it has transmitted a pulse. Since a transducer serves alternately as transmitter and receiver, at low temperatures (below -30 °C) there is sometimes enough signal left from when the transducer last transmitted to prematurely trigger the next detection of a received pulse. Angus Raby was able to reduce these false triggers by decreasing the sensitivity of the receiver, but this is not the ideal solution for two reasons:
The reduced receive sensitivity means that some readings will be lost at high wind speeds. From tests at the Gill wind tunnel, no data was lost at wind speeds below 30 m/s and at an operating rate of 56 outputs/s, even with the vertical spars of the sonic array upwind. At 40 m/s approximately 10% of readings were lost at 56 outputs/s. At 21 outputs/s approximately 0.5% of readings were lost.
The residual ringing, added to the real receive signal, can still cause some increase in variance at low temperatures.
Nevertheless, this modification was implemented on all R2 Solent sonics used on the SHEBA Flux-PAM stations.
During testing, Angus Raby also discovered that transducer ringing got worse as they started to ice up. A layer of ice 0.5 mm thick was found to cause false triggering of the receiver at low temperatures when the true receive signal is reduced. This behavior is not consistent with Gill's published performance specifications of acceptable operation with a coating of 2-3 mm of ice.
9.3 Field performance of R2 Solent sonic anemometers
9.3.1 Riming
The field performance of the R2 Solent sonics during the fall and winter of 1997 was quite disappointing.
Rimed Gill sonic anemometer
E. Andreas, October 25, 1997
First, riming conditions occurred much more frequently than anticipated by SHEBA scientists, based on their previous experience. The humidity was almost continuously near saturation with respect to ice, which may have been associated with the water vapor sources from open leads throughout the SHEBA field site as well as open water to the south.
Second, the Solent sonic performance appeared to be very sensitive to riming, as suggested by Angus Raby's tests. When cleaning frost off the Solent sonics, it was often inadequate to simply brush off the feathery frost, and sometimes required tediously melting a thin residual base coat of ice to restore acceptable performance (often at the expense of cold fingers). In contrast, the ATI sonics used on the Atmospheric Surface Flux Group meteorological tower in the main camp were not nearly as sensitive to riming and could often be restored to operation simply by brushing off the feathery frost.
Riming of the Solent sonics was accompanied by a noticeable degradation of the quality of the wind and temperature data, characterized in particular by increasingly noisy data. The Solent outputs data at a rate of 21 Hz, and each datum is nominally the average over eight acoustic pulses. However, the Solent firmware performs an internal quality check on each of the pulses and averages only acceptable pulses into the output data, reporting an invalid wind value (-100 m/s) if an inadequate number of pulses is acceptable. (Note that because the Solent sonic array is non-orthogonal, unacceptable pulses on any one transducer path cause all of the outputs to be reported as invalid.) The valid wind samples are averaged by the EVE data system, which also calculates the percentage of valid samples in each 5 minute set of wind and turbulence statistics as the data variable samples.sonic. Riming of the Solent sonics is detectable as a decrease in samples.sonic below 100%, and this provides a somewhat objective measure of Solent data quality. There is not a precise threshold value of samples.sonic that unambiguously separates good data from bad, but it appears that a reasonable working value is on the order of 99%. If it is desired to err on the side of filtering out good data in the quest to maximize the elimination of erroneous data, then 99.9% is not too large a value for this threshold.
9.3.2 Path curvature correction
The R2 Solent sonic anemometer outputs three orthogonal wind components (u,v,w) plus the speed of sound, c. The EVE data system then calculates sonic virtual temperature tc from the speed of sound and wind component data, including a "path curvature" correction,
tc = a(c2 + vn2)
where vn is the velocity component normal to the sonic path used to measure the speed of sound and a = 2.48e-3 °K-s²/m². Prior to June 21, 1998, EVE incorrectly used the formula
vn2 = v2 + (u2 + w2)/2
whereas the proper formula is
vn2 = v2 + (u + w)2/2
where u,v,w are the velocity components in an orthogonal coordinate system aligned with the sonic measurement array. The corrections to the five-minute-averaged first and second moments of the Solent data output by EVE are
<tc> = <tE> + a(<u><w> + <u'w'>)
<u'tc'> = <u'tE'> + a(<u><u'w'> + <w><u'u'>)
<v'tc'> = <v'tE'> + a(<u><v'w'> + <w><u'v'>)
<w'tc'> = <w'tE'> + a(<u><w'w'> + <w><u'w'>)
<tc'2> = <tE'2> + 2a(<u><w'TE'> + <w><u'TE'>) +
a2(<u>2<w'w'> + 2<u><w><u'w'> + <w>2<u'u'>)
where <x> denotes a five-minute average of the variable x and tE is the sonic virtual temperature as incorrectly calculated by EVE. These corrections have been applied during data post-processing at NCAR.
9.4 Sonic heaters
During November and December, heaters were developed at NCAR that could be attached to the sonic transducers in order to melt the rime ice.
Gill sonic with heaters
E. Andreas, May 17, 1998
These were based on Minco Products Thermofoil thin film heaters (model HK5207R42.1L24D) that could be wrapped around the sonic transducers. Power to the heaters was controlled by the microprocessor in the NCAR hygrothermometer. The heaters were installed at Atlanta, Baltimore, and Florida over the period January 7-15, 1998, and on Station 2 when it was resurrected at Seattle in April 1998.
Initially, the microprocessor was programmed to turn on the heaters at regular intervals, for example 5 minutes per 2 hours. However, this proved to be difficult to sustain because regular use of the heaters drained the station batteries. A better solution was implemented on February 20 when software was installed on the shipboard base computer to turn on the heaters via the RF modems only when the station battery voltage exceeded 12 V and the sonic firmware reported a deterioration in sonic performance (less than 99.5% of the sonic samples acceptable). The data parameter heater, recorded for each station, corresponds to the fraction of time during each 5-minute data sample when a sonic heater is turned on.
9.5 Replacement of R2 Solents with ATI sonic anemometers
In 1997, Applied Technologies began producing a new version of their sonic anemometer that reduced the power requirement to less
ATI sonic anemometer
E. Andreas, May 15, 1998
than 2 W and was thus suitable for operation on the remote Flux-PAM stations. Based on the more robust performance during riming conditions of the (older version) ATI sonic anemometers on the Atmospheric Surface Flux Group tower, it was decided to upgrade three NCAR ATI sonic anemometers to the new version and use them to replace the R2 Solent sonics. The first ATI sonic was installed at Florida on February 26 and moved to Atlanta on March 20. The other two ATI sonics were installed at Baltimore and Seattle on April 15 and April 22, respectively. Since only three ATI sonics were available, Florida continued to use an R2 Solent sonic.
The ATI sonic outputs data at a rate of 10 Hz and each datum is nominally the average over 20 acoustic pulses. Unacceptable pulses are again detected by internal quality checks and excluded from the averages. In contrast to the Solent, however, the number of acceptable pulses along each transducer path is included in the ATI output data and archived in the 5-minute PAM data as usamples, vsamples and wsamples. Since the ATI array is orthogonal, a problem with one transducer path does not invalidate data from the other component paths. For the ATI, the variable samples.sonic was initially equivalent to wsamples, but around the end of April (April 25 for stations 1 and 2, May 1 for station 3) samples.sonic was changed to be calculated by summing the number of acceptable pulses along all three paths and dividing by the total number of pulses.
9.6 Sonic anemometer heights
The heights of the sonic anemometers were measured when the Flux-PAM stations were deployed in October 1997 and then during many service visits from April until September 1998. The Solent sonic arrays were nominally 58 cm above the boom and the ATI sonic arrays were at essentially the same height as the boom. The Solent sonics were on the order of 3.5 m above the surface, while the ATI sonic heights varied (due to surface ablation) between 2.25 m and 3.25 m. The detailed sonic height measurements are tabulated below, based on entries in the PAM logbook.
Table 9.6 Sonic anemometer heights
Station 1 Station 2 Station 3 Station 4
Date Ht(m) Date Ht(m) Date Ht(m) Date Ht(m)
97 10 15 3.46 97 10 15 3.46 97 10 15 3.45 97 10 23 3.48
98 04 11 2.26 98 04 11 2.82 98 04 22 2.46 98 04 11 3.33
98 04 17 2.26 98 04 16 3.45 98 05 15 2.34 98 04 20 3.20
98 05 21 2.22 98 05 16 2.87 98 06 18 2.63 98 05 16 3.42
98 06 12 2.39 98 06 12 3.02 98 06 29 2.68 98 06 08 3.47
98 06 22 2.51 98 06 23 3.03 98 07 09 2.69 98 06 13 3.48
98 07 06 2.77 98 07 07 3.12 98 07 30 2.97 98 07 29 3.51
98 07 21 2.87 98 07 23 3.24 98 08 10 2.97 98 08 26 3.53
98 08 03 2.92 98 07 30 3.23 98 08 24 2.93 98 09 08 3.51
98 08 29 3.57 98 08 26 3.28 98 09 20 2.92 98 09 20 3.50
98 09 16 3.48 98 09 16 3.26 98 09 30 3.52
98 09 30 3.31
9.7 Calculation of sonic azimuth
Determination of absolute wind directions from the sonic anemometer data requires knowing the horizontal orientation or azimuth of their u and v measurement axes. The wind direction relative to true North is calculated as atan(-u,-v) + Vazimuth, that is, a positive v wind component is blowing from the direction Vazimuth + 180°. The alignment of the v axis, Vazimuth, is calculated as
Vazimuth = compass + declination + orientation
Here compass is the data provided by an electronic magnetometer compass mounted on the PAM mast, declination is provided by the GPS receiver at each station, and orientation is the angle between the sonic positive v axis and the North axis of the electronic compass. The overall uncertainty of the compass data is estimated to be ±3°, and the uncertainty of the orientation correction is at times as large as perhaps ±5°, particularly for the Solent sonics. A check of long-term-average wind directions calculated for the four stations shows them generally to be equal within at least ±8° and often to agree within ±3° or less.
The electronic compass was mounted on top of the hygrothermometer and oriented with its North axis nominally 90° counterclockwise from the boom on which the sonic was mounted. Several problems occurred with the electronic compass data during the project. Prior to October 20, 1997, a software bug caused the compass data to be lost so that any absolute wind directions prior to that date use the compass reading on October 20. Initially, there was also a problem in the hygrothermometer which caused spiking on the compass data once every 3-10 hours. This was fixed at Florida on October 23, Atlanta on October 24, Baltimore on October 25, and at Cleveland on October 26. As noted in Section 6, these spikes were removed during data post-processing. Spiking was also caused by operation of the sonic heaters. These spikes have been flagged as missing data during data post-processing and replaced with interpolated data during calculation of Vazimuth. Swapping the hygrothermometer and/or the compass at a station often caused a step change of 1° to 3° in the compass reading, but the exact cause of this change or an objective correction procedure is not immediately obvious. Finally, operation of the beacon light reduced the compass readings at that station by 1°-4° while the beacon was turned on. The compass data have been nominally adjusted during post-project analysis for the offset caused by beacon operation.
The compass data at Florida are obviously in error for a 27-hour period on September 18-19, 1998. These data have been replaced with interpolated values. The compass data at Maui is questionable and often missing from roughly August 1 to September 4, 1998. Logbook entry 666 notes improving the operation of this compass on September 2 by draining water out of it! However, it is not immediately obvious which data are good and which are bad during most of this time period. The only corrective action for the Maui compass data has been to replace intermittent data from August 23 to September 2 with interpolated data. Hand-held compass readings were taken during station visits in the spring and summer. These were generally consistent with the electronic compass readings, but their accuracy was judged to be insufficient to eliminate residual uncertainties on the order of ±3° in the true orientation of the compass.
The declination is determined from an internal table in the GPS receiver as a function of the measured latitude and longitude. For most of the project, the declinations of the four Flux-PAM stations were within 0.1°-0.2° of each other; but in September 1998, Baltimore drifted further away from the other stations, and its declination approached a value 0.5° greater than the others. However, in order to provide a robust value of the declination for calculation of sonic azimuth and because the declinations of the four stations were equal to each other within the accuracy of the compass and orientation data, the median value of the declination values from all reporting stations is used to calculate sonic azimuth at each station.
The orientation is the angle between the orientations of the positive v axis of the sonic and the North axis of the electronic compass. For the ATI sonic, with its u axis parallel to the sonic boom and positive for winds blowing toward the mast, this angle is nominally equal to 180°. The R2 Solent sonics have a North arrow inscribed on the top, which is oriented 30° clockwise from the negative u axis of the data output by the anemometer. By convention, NCAR orients this North arrow to be pointed away from the tower and parallel to the boom on which the sonic is mounted, so that the orientation angle is nominally 150°. For the asymmetrical (R2A) Solent anemometer, this orients the least-obstructed portion of the sonic array in the direction directly away from the tower. On occasion, however, a Solent sonic was mounted for a period of time with the North arrow not pointing along the boom. To the best of our ability, this has been accounted for in the sonic orientation, based on field notes in the PAM electronic logbook. Again, the hand-held compass readings were judged insufficient to eliminate residual orientation uncertainties of ±5°.
9.8 Post-project calculation of sonic tilt
Tilt of a sonic anemometer from true vertical can introduce errors in the measured sensible heat and momentum fluxes. The tilt error in u* or in a scalar flux is on the order of 5% per degree of tilt in the vertical plane aligned with the mean wind direction. Consequently, it is often necessary to rotate the coordinates of three-dimensional sonic wind data to correct for this tilt. NCAR estimates the sonic tilt angles from the archived wind data using the planar fit technique described in Wilczak, Oncley, and Stage, 2001, `Sonic anemometer tilt correction algorithms', Boundary Layer Meteor., 99, pp. 127-150. Briefly, this technique assumes that the time-averaged wind field is confined to a plane surface, nominally parallel to the ground. It is assumed that the fluxes of interest are those normal to this wind-field plane and thus the vertical velocity axis is re-oriented normal to that plane. The orientation of the wind-field plane relative to the measurement axes of the sonic anemometer is determined by a least-squares fit of the wind data to the equation
w = a + bu + cv
where u, v, w are the 5-minute-averaged horizontal and vertical wind components measured by the sonic anemometer. The fitted coefficients correspond to
vertical velocity offset = a
sonic lean angle = atan((b2 + c2)½)
azimuth of sonic lean (relative to u axis) = atan(c/b)
Confidence in the fit to this model requires data with as wide a range of wind directions as possible; in practice, 90° or greater. Thus confidence can best be achieved with data extending over many hours or days. If the data are available, this requirement is acceptable because the sonic tilt angles are expected to be unchanged unless the sonic anemometer is moved (or the surrounding surface itself changes!). Thus the tilt angles are calculated for periods delimited by known physical changes in the sonic orientation, e.g. re-leveling the mast or swapping the sonic anemometer.
The wind data used to calculate the SHEBA tilt coefficients were edited using several criteria to increase the reliability of the least-squares fit. The analysis used data for each five minute period only when 99.9% of the samples were judged acceptable by the sonic firmware and when the transducer heaters were not operated during the period. Wind directions within ±45° of the mast were also eliminated from the analysis, as were wind speeds less than 1 m/s. Finally, the fraction of data acceptable to a spike-detection routine running on EVE was required to exceed 99% for each 5 minute period.
The vertical velocity offsets a derived from the least-squares planar fits were generally found to be higher for the R2 Solents than for the ATI sonics, 5-15 cm/sec versus 1-2 cm/sec. However, plots of w versus wind speed for each period suggest that the true w offset is quite small for both the Solent and ATI sonics. For low-noise data with a wide range of wind directions, these plots are a well-defined wedge which is symmetrical about the w=0 axis and points toward speed=0. For example, see Fig. 9.8.1a for a plot of the data from Station 3 beginning on April 22. Fig. 9.8.1b shows the corresponding plot of the planar fit for that period. (See below for a discussion of the planar fit plots.) For a period with a narrow range of wind directions there may only be data either above or below the w axis, Figs. 9.8.2a and 9.8.2b, and for the Solent sonics there is often a great deal of scatter in these plots, Figs. 9.8.3a and 9.8.3b. Nevertheless in almost every case, there appears to be no significant displacement of the line of symmetry from the w axis, as would be caused by a w offset. It is concluded that the large w offsets calculated by the least-squares fit to the Solent data are simply an artifact of noisy data associated with heavy riming, and the least-square planar fits were recomputed assuming a=0. (The only exception is the Atlanta sonic for the period beginning on July 6, 1998. For that period there is a definite offset of -10 cm/s.) The plots of w versus wind speed also provided an additional editing parameter for the planar fits, a maximum allowable vertical elevation angle which was individually specified for each analysis period.
The calculated values of the sonic lean angle and the lean azimuth are tabulated below for the four Flux-PAM stations. Each entry shows the date and time at the beginning of the period for which the entry is applicable, as well as the specific sonic used during the period. Also tabulated are the rms residuals from the least-squares fit. The tables are followed by brief discussions of the analysis.
The tilt fits to the ATI data are generally much better than the fits to the R2 Solent data. This is quantitatively reflected in the rms residuals, 2-4 cm/sec for the ATI data versus 10-20 cm/s for the Solents. Presumably this is because a greater sensitivity to riming causes the Solent data to be much noisier than the ATI data, even after the editing described above. However, an additional contributing factor might be that heavy riming of the support structure of the more-enclosed Solent sonic array (only the transducers are heated) may at times have significantly distorted the flow through the array. The lean angles are also generally higher for the Solents, 1°-4° versus 0.5°-2° for the ATIs. This could reflect the fact that the Solent array is more difficult to mount precisely vertical than the ATI, be caused by flow distortion within the array, or again simply be an artifact of the noisy Solent data.
The sonic wind data and the tilt fits can be displayed as plots of wind elevation angle, atan((w-a)/(u2+v2)½), versus wind direction (azimuth) relative to the sonic u axis. These plots can be accessed from the links in the first column of the tables. In this representation, the least-squares planar fit is a sinusoidal curve with a period equal to 360° of wind direction. The tables include a signal-to-noise ratio in this representation, equal to the the calculated lean angle divided by the rms deviations of the wind elevation angles from the fitted sinusoidal curve. Finally, the tables include a comment on the quality of the fit, based on a subjective assessment of these plots. Since some of the periods had data with a limited range of wind directions (sparse fit) or very noisy data (poor fit), the calculated tilt parameters were at time not used to reorient the sonic data. This subjective decision, based on the individual plots, is indicated in the last column of the tables. In general the acceptable fits have a S/N > 1 and the unacceptable fits have S/N < 1, but there are inevitably a few exceptions. Note that the ATIs at times had lean angles on the order of 0.5° accompanied by a small signal-to-noise ratio. Although the corresponding lean and azimuth angles have not been used to reorient the sonic data, the consequences are minimal because the lean angles are small.
Table 9.8.1 Station 1 (Atlanta) Tilt Angles
Date Time Sonic Lean Azimuth RMS S/N Comment Rotated
GMT (deg) (deg) cm/s
97 10 11 00:00 R2 0112 3.5 -179.8 4 3.9 sparse yes
97 10 15 22:00 R2 0112 1.4 167.8 19 0.8 poor no
98 01 15 20:00 R2A 0087 1.7 72.5 34 0.3 poor note 1
98 02 20 22:00 R2A 0087 2.3 87.8 13 1.5 fair yes
98 03 20 20:00 ATI 980202 1.1 -143.7 4 2.8 good yes
98 04 18 20:30 ATI 980202 0.5 -131.1 3 1.3 fair no
98 05 19 00:00 ATI 980202 0.5 139.0 3 1.0 fair no
98 06 11 00:00 ATI 980202 1.0 144.8 3 2.0 fair yes
98 07 06 20:00 ATI 980202 0.1 -104.6 3 0.1 fair no
98 07 27 00:00 ATI 980202 0.5 -68.1 4 0.6 fair no
98 08 24 21:00 R2A 0067 1.8 84.5 6 1.8 sparse no
98 08 27 00:30 R2A 0067 4.3 -150.1 12 1.7 sparse no
98 08 29 22:00 R2A 0067 1.2 168.1 14 0.5 fair no
Note 1: Used lean and azimuth angles from following period
Because of icing, good R2 0112 data are very scarce from October 1997 to January 15, but there is a fair distribution of wind directions. The data are split on October 15 when the sonic was reoriented in its mount by 90°. The data for Solent R2A 0087 with heaters are divided into two separate periods by the introduction of base-software heater control on February 20. Good data are again moderately scarce before February 20, because the heaters were used only sparingly to conserve battery power. The data after February 20 are moderately complete and have a good range of wind directions. However, because of the large data scatter, it is not clear whether the Solent data fit the model used to find the sonic orientation. There is no known cause for the change in parameters on February 20, except possibly flow distortion due to excessive riming prior to February 20. Thus we have used the lean and azimuth angles calculated for the period beginning on February 20 to rotate the R2A 0087 data for the preceding period.
As noted previously, the ATI data are significantly less noisy than the Solent data. The ATI 980202 data have been divided into six distinct periods. The first period ends on April 18 when the tripod was releveled. The data from April 18 to July 6 were divided into three periods in an attempt to capture the presumed change in level of the tripod during the melting season beginning in mid-May. (There was noticeable, systematic change in the radiometer electronic levels during this period.) Then in early July there was an unexplained (by the logbook) change in the character of the vertical velocity, in particular a change in the mean vertical velocity. There was a second, less prominent, change in character around July 27.
The Atlanta ATI v axis failed in mid-August and was replaced by Solent R2A 0067 on August 24. The Solent installation was modified on August 27 and 29. Again the Solent data have much more scatter than the ATI data, so the results should be judged less reliable.
Table 9.8.2 Station 2 (Cleveland, Seattle, Maui)
Date Time Sonic Lean Azimuth RMS S/N Comment Rotated
GMT (deg) (deg) cm/s
97 10 14 00:00 R2A 0067 1.1 125.5 12 1.0 fair no
98 04 06 19:00 ATI 980303 1.0 -132.8 2 3.3 sparse yes
98 04 18 04:00 R2A 0123 3.9 -117.9 10 3.3 sparse yes
98 04 22 18:15 ATI 980302 0.4 175.5 6 0.6 poor no
98 06 11 00:00 ATI 980302 1.7 -144.1 3 3.4 good yes
98 07 12 00:00 ATI 980302 1.8 -109.7 4 2.3 good yes
98 08 20 00:00 ATI 980302 1.9 -160.4 3 3.8 good yes
Because of icing, good data are very scarce for Cleveland from October 1997 to February 6, 1998, when Cleveland was damaged by a closing lead, but there is a fair distribution of wind directions.
Station 2 was used to test ATI 980303 from April 6-13, and data are quite sparse for this period. Station 2 was resurrected at the Seattle site on April 16, but the Solent sonic was only there for 5 days before being replaced by an ATI on April 22. The data for April 18-22 are very sparse. The data for ATI 980302 at Seattle (April 22 - June 10) have a notable signature for wind from the ENE, characterized by a full cycle of the elevation angle from 0° to +2° to 0° to -2° and back to 0° over a wind direction range of about 35°. This may well have been caused by a pressure ridge only about 50m to the north.
On June 11, station 2 was moved to the Maui site. It might be noted that the ENE wind elevation signature from Seattle does not appear at Maui, supporting the assumption that it was caused by the local topography. The succeeding data have been divided into three periods that appear to be internally consistent in the tilt parameters. The derived lean angle of almost 2° is not consistent with a logbook note on August 30 stating that the sonic was level within 0.5°.
Table 9.8.3 Station 3 (Baltimore) Tilt Angles
Date Time Sonic Lean Azimuth RMS S/N Comment Rotated
GMT (deg) (deg) cm/s
97 10 12 00:00 R2A 0087 1.3 -4.8 3 1.4 sparse no
97 10 15 19:00 R2A 0087 1.5 18.7 11 1.4 fair yes
98 01 13 20:30 R2A 0123 1.3 60.9 15 1.0 poor Note 1
98 02 20 22:00 R2A 0123 1.5 -97.5 14 0.8 fair yes
98 04 15 02:00 ATI 980303 1.5 168.2 3 3.8 good yes
98 04 22 03:00 ATI 980303 1.6 150.0 3 4.0 good yes
98 06 24 00:00 ATI 980303 0.9 144.0 3 1.5 good yes
98 07 03 00:00 ATI 980303 0.8 -8.1 3 1.3 fair yes
98 07 12 00:00 ATI 980303 2.2 10.1 2 4.4 good yes
98 07 21 00:00 ATI 980303 1.2 170.6 2 3.0 sparse yes
98 07 31 00:00 ATI 980303 0.4 44.4 3 1.0 good yes
Note 1: Used lean and azimuth angles from following period
Because of icing, good data are very scarce for Baltimore from October 1997 to January 13. The data are split on October 15 when the sonic was reoriented in its mount by 90°. The distribution of wind directions is very limited, so the derived tilt parameters are somewhat speculative. Even the addition of heaters did not improve the data recovery until the base heater control software was installed on February 20. Again, the lean and azimuth angles for February 20 - April 14 were used to rotate the R2A 0123 data for the January 13 - February 20 period. Although the February - April data are quite scattered, there is a good distribution of wind directions.
The data for ATI 980303 from April to September are divided into seven periods based on apparent changes in the tilt parameters. In particular, extensive melting of the surface and possible settling of the tripod appears to have occurred during the period from June 24 - July 31. The tripod was releveled on April 22, July 20 and July 30.
Table 9.8.4 Station 4 (Florida) Tilt Angles
Date Time Sonic Lean Azimuth RMS S/N Comment Rotated
GMT (deg) (deg) cm/s
97 10 23 00:00 R2A 0123 0.6 52.8 12 0.5 poor no
98 01 13 20:30 R2A 0087 11.7 83.6 7 7.3 sparse yes
98 01 18 04:45 R2 0112 4.1 121.4 16 1.8 fair yes
98 02 26 22:00 ATI 980202 0.8 155.3 3 1.3 good yes
98 03 20 20:00 R2A 0087 4.1 100.9 13 2.6 fair yes
98 04 02 00:00 R2A 0087 1.4 148.3 10 1.1 fair no
98 04 20 23:30 R2A 0087 1.4 86.3 12 0.9 fair no
98 06 05 23:30 R2A 0087 3.1 153.6 11 1.9 good yes
98 07 30 04:30 R2A 0087 1.5 -172.8 16 0.8 fair yes
There is a large amount of scatter in the wind data for the R2A 0123 sonic from October to early January, and consequently the tilt fit is poor. Fortunately, the indicated lean is only 0.6°. During January and February there were several changes of anemometers at Florida associated with implementation of the heaters and introduction of the first ATI sonic. R2A 0087 was used for only a few days in January, and consequently the data available for the tilt fit are quite sparse. Although the direction range is limited, the fit looks good, lending some plausibility to the large derived lean angle (11.7°). The data for R2 0112 again contain a large amount of scatter, but the wind direction range is good and the fit appears plausible. The fit for ATI 980202 is quite good.
The data for R2A 0087 from March 20 until October are divided into five periods by four moves of the Florida station during that time. There is a fair amount of scatter in the data, and consequently the fits are at times somewhat questionable. In particular, the period April 2-20 has sparse data and the period April 20 - June 5 also appears questionable. On the other hand, the fit for June 5 - July 30 is one of the best achieved with an R2 Solent sonic during SHEBA.
10.0 Data Processing and Data Archives
Gordon writing `just-in-time' software on the Des Gros (T. Uttal)
Updated dataset released on Jan 17, 2003
See download links for more information.
10.1 Five-Minute Data
The SHEBA Flux-PAM data are available at two time resolutions, five-minute averages and one-hour averages.
The basic data archived during field operations are five-minute averages calculated at each Flux-PAM site by the EVE data systems. The five-minute data were stored on removable media on the local station data systems and also transmitted by RF modem to the base computer on the Des Grosseiliers. These two overlapping data sets have been merged during post-project processing to fill in non-coincident data gaps present in both sets. Table 10.1 lists the five-minute data variables measured directly by the Flux-PAM stations, as well as the one-hour-averaged variables.
Various corrections have been applied to the five-minute data during post-project processing. Most of these have been discussed in the sections of the report that correspond to individual sensors. They include
interpolating between pre- and post-project radiometer calibrations,
correction to the compass reading for offsets generated when the beacon was on,
use of a 1-hour median filter to remove known spikes in the compass and hygrothermometer data in October 1997,
subtracting offsets from the radiometer level data,
calibration correction to the Tsoil/ice sensor at Station 2 after April 11,
correction to Solent virtual temperature data prior to June 21,
where possible, the wind measurements from the sonic anemometer have been rotated into a coordinate system with its vertical axis normal to a plane defined by the local mean wind field.
Missing or obviously erroneous compass data have not been replaced in the 5-minute data record (with the exception noted above), but obviously erroneous data have been flagged as missing, including compass data collected during operation of the sonic heaters. For most of the project, the orientation of the stations, and thus the compass data, varied rather slowly. Thus it was thought to be generally acceptable to fill in the missing data by interpolation (and extraplotion) during the calculation of derived variables such as Vazimuth, dir, or boom.
Table 10.1 Flux-PAM Data Variables
Name Variable, units Limits 5-min 1-hour
P pressure, mb 970, 1050 x x
T.plat PRT temperature, °C x
T.therm thermistor temperature, °C x
T air temperature, °C -45, 5 x
RH relative humidity wrt water, %RH x
RHice relative humidity wrt ice, %RH 60, 115 x
Rsw.in incoming shortwave radiation, W/m³2 -15, 900 x x
Rsw.out outgoing shortwave radiation, W/m³2 -15, 900 x x
Rpile.in,out pyrgeometer thermopile, W/m³2 x
Tcase.in,out pyrgeometer case temperature, °C x
Tdome.in,out pyrgeometer dome temperature, °C x
Rlw.in incoming longwave radiation, W/m³2 100, 350 x
Rlw.out outgoing longwave radiation, W/m³2 150, 350 x
lev.rad.x,y rad. array two-axis levels, degrees x
Rlwdiff.in.ARM,
ETL incoming longwave radiation differences,
NCAR - ARM(ETL), W/m³2 x
Tsoil, Tice** ice temperature, °C -25, 5 x x
Gsoil, Gice** ice heat flux, W/m³2 -125, 100 x x
u,v horizontal velocities, m/s 0, 17 x
spd wind speed, m/s 0, 17 x
dir wind direction wrt true N, m/s 0, 360 x
w vertical velocity, m/s 0, 0.5 x
tc sonic virtual temperature, °C x
u'u' turbulent variance, m²/s² 0, 4* x x*
u'v' turbulent covariance, m²/s² ± 0.5* x x*
u'w' turbulent covariance, m²/s² ± 0.6* x x*
u'tc' turbulent covariance, °C-m/s ± 0.3* x x*
v'v' turbulent variance, m²/s² 0, 2.5* x x*
v'w' turbulent covariance, m²/s² ± 0.3* x x*
v'tc' turbulent covariance, °C-m/s ± 0.1* x x*
w'w' turbulent variance, m²/s² 0, 0.8 x x
w'tc' turbulent covariance, °C-m/s ± 0.08 x x
tc'tc' turbulent variance, °C² 0, 0.1 x x
uflux momentum flux, Nt/m² x
H heat flux, W/m² x
freq.sonic sonic pulses/second per path x
u,v,wsamples sonic pulses per sample, n x
samples.sonic percentage of good data, % 0, 100 x
u,v,w,tcflag software-detected data outliers, n x
Vazimuth azimuth of sonic v axis wrt N, ° 0, 360 x
boom azimuth of sonic boom wrt N, ° 0, 360 x x
heater fraction of time heater is turned on x
latitude latitude, decimal degrees 74, 81 x
longitude longitude, decimal degrees -169, -142 x
lat,long.deg latitude, longitude degrees x
lat,long.min latitude, longitude minutes x
lat,long.sec latitude, longitude seconds x
compass compass reading, decimal degrees x
beacon fraction of time beacon is turned on x
Tbox.eve electronics internal temperature, °C x
vdc.batt battery voltage, V x
vdcmax,min.batt max, minimum battery voltage, V x
vdc.teg system voltage, V x
vdcmax,min.teg max, minimum system voltage, V x
i.charge battery charging current, amps x
imax.charge max charging current, amps x
i.load system load current, amps x
Z.TRH.meas TRH sensor height above snow, interpolated from direct measurements, meters x***
Z.TRH.snowline TRH sensor height above snow, interpolated using snow-line data, meters x***
Z.sonic.meas sonic anemometer height above snow, interpolated from direct measurements, meters x***
Z.sonic.snowline sonic anemometer height above snow, interpolated using snow-line data, meters x***
* streamwise coordinates
** hour averages
*** provided by Ed Andreas, Keran Claffey (see appendix)
10.2 One-Hour Data
Hourly averages of most data parameters, centered on the half-hour, have been calculated during post-project processing. The hour-average parameters generally, but not always, correspond to the five-minute parameters. For example, the pyrgeometer thermopile and temperature measurements have been combined to calculate the long-wave radiation flux, the PRT and thermistor data have been combined into a single value for the air temperature, and the PRT and RH (with respect to water) data have been combined to calculate the relative humidity with respect to ice.
Prior to calculating hour averages, two editing steps were applied to the data to minimize the contribution of occasional erroneous spikes. First absolute range limits, listed in Table 10.1, were imposed on the data. Observations exceeding these limits were flagged as missing. Second, a running 3-point (15 minute) median filter was applied to the five-minute time series, which replaced the central data point with the median of the data within the 15-minute window. If the data within the 15-minute window are monotonically increasing or decreasing (or constant), they are unaffected by the median filter. However, valid maxima or minima within the window are suppressed in the same manner as erroneous spikes, reducing the variance of the five-minute time series. Reduction of the five-minute variance is not expected to have a significant effect on the hour average.
10.3 Processing of Sonic Anemometer Data
Most parameters have been sampled by the EVE data system at a rate of 1 Hz, while the sonic anemometer data have been ingested at a rate of 20.83 Hz for the R2 Solents and 10 Hz for the ATIs. In order to determine turbulent variances and fluxes from the high-rate sonic data, EVE calculated and archived a complete set of centered 5-minute covariances:
<u'u'>
<u'v'> <v'v'>
<u'w'> <v'w'> <v'w'>
<u'tc'> <v'tc'> <w'tc'> <tc'tc'>
During data post-processing, these covariances were rotated into a coordinate system with its vertical (w) axis normal to the plane of the mean flow. However the (five-minute) data in the horizontal plane determined by that rotation remain in a coordinate system nominally aligned with the sonic measurement array. The data may be rotated about the vertical axis into a geographic coordinate system aligned with true North using the variable Vazimuth.
The hour-averaged sonic data were calculated with the following steps:
Five-minute mean and covariance data are flagged as missing if samples.sonic is less than 99.5% or heater is non-zero (sonic heaters on during the period)
Compute one-hour vector-mean wind speed and direction
Rotate five-minute means and covariances to one-hour streamwise coordinates
Apply range limits and median filter to five-minute covariances
Compute 15-minute covariances, including covariance of 5-minute means (see below)
Average four 15-minute covariances to obtain hour averages
Thus the hour-average covariances are high-pass filtered at an effective period of 15 minutes. The 15-minute covariances account for all fluctuations at shorter periods by including the covariance of the 5-minute means in Step 5 as, e.g.
<u'w'>15 = M15(<u'w'>) + M15(<u><w>) - M15(<u>)M15(<w>)
where <u'w'>15 is the 15-minute covariance, <u> and <w> are 5-minute means, <u'w'> is a 5-minute covariance, and M15(x) is the average of three 5-minute values of x.
The hour-averaged data also include the calculation of momentum and heat fluxes,
uflux = rho M60(<u'w'>15)
H = rho CP M60(<w'tc'>15)
where M60(x15) is the average of four 15-minute values of x. Daily average values of air density rho and the specific heat of air CP were used in these calculations, in order to assure that they were immune to the possiblity of errors in the individual 5-minute values of temperature, pressure and humidity. Note also that the heat flux is calculated using the sonic virtual temperature rather than true air temperature.
Note that the sonic data have not been edited for possible flow distortion when the mast is upwind of the sonic. The mast is upwind of the sonic when dir = boom ± 180°. This is particularly an issue for the ATI sonics, which were mounted at the same height as the sonic boom and thus below the top of the vertical mast. However it also may be an issue for the asymmetric R2A Solents. Although the Solents where mounted above the boom and above the top of the vertical mast, the three vertical struts supporting the R2A sonic array are clustered within a 120° sector which was usually oriented toward the mast.
Appendix A: Laboratory Tests of RH Measurement by Capacitance Sensors at the Frost Point
A.1 Introduction
Based on the SHEBA data set, Ed Andreas has concluded that the near-surface water vapor over Polar sea ice is always near ice saturation. Observational evidence and a theoretical model supporting this hypothesis are presented in a manuscript submitted for publication in JGR appropriately titled, "Near-Surface Water Vapor Over Polar Sea Ice is Always near Ice Saturation". The authors are Ed Andreas, Peter Guest, Ola Persson, Chris Fairall, Tom Horst, Steve Semmer, and Dick Moritz.
The observational evidence includes RH measurements by the PAM and SPO Vaisala 50Y hygrometers used at the PAM and SPO stations and the Vaisala 235C hygrometers used on the ASFG tower. One troublesome aspect of the data is that the 50Y sensors indicate increasing sub-saturation wrt ice below -20 C, down to 90% RH.ice at -40 C, while the 235C sensors indicate increasing super-saturation below -20 C, up to 106% at -40 C. Below -20 C, the range of RH.ice at any given temperature is quite narrow for any individual sensor, on the order of 2-4% RH.ice, so that none of the sensors recorded a significant occurence of 100% RH.ice below -25 C.
A.2 Laboratory Tests
In an attempt to understand the sensor behavior, a number of laboratory tests were run in the NCAR Sensor Calibration Laboratory. The basic tests pumped air at 20 C and 40% RH into a controlled temperature chamber. The supply air was provided by the exhaust stream from the Thunder Scientific humidity calibration chamber, located across the room. As the temperature chamber was cooled, it was assumed that the external air stream, confined to a small diameter tube, would become saturated with respect to ice. Within the temperature chamber, the air was piped to a small cylindrical manifold into which four capacitance RH sensors could be inserted in series. The air was then piped to a slightly larger diameter cylindrical chamber containing the sensing element of a dew point hygrometer, and finally the air was exhausted to the room. The dew point hygrometer has its own ventilator to draw air across its sensing mirror. The electronic control unit of the dew point hygrometer was located external to the temperature chamber.
It took several attempts to obtain satisfactory results in the frost point tests. One major problem was the elimination of leaks that diluted the saturated air piped to the manifold with the drier air within the temperature chamber. The first satisfactory frost point test occurred on 12-15-00.
Supporting tests were made in both a Thunder Scientific humidity calibration chamber and in an oil bath temperature calibration system. The Thunder Scientific chamber was used to check the calibration of the capacitance and dew point hygrometers up to about 90% RH.ice and at temperatures down to -15 C and -20 C respectively, the limits of the capability of that chamber. The oil bath was used to test the calibration of the mirror temperature sensor down to -40 C, again the lower limit for that device.
A.3 Sensors
The Vaisala capacitance hygrometers tested were one NCAR 50Y sensor and three ETL 235C sensors. The history of these sensors subsequent to the SHEBA field experiment is unknown and in fact the specific NCAR 50Y sensor may not have been used during SHEBA. The 235C sensors were
Vaisala SN S2720014, ETL#4, NCAR data channel 997
Vaisala SN S2720022, ETL#5, NCAR data channel 999
Vaisala SN T0810017, ETL spare, NCAR data channel 998
The 235C sensors have a sintered metal cap that protects the transducer from liquid moisture but allows water vapor to pass through to the transducer. The cap on the ETL spare was broken and missing its end, directly exposing the transducer to the ambient air.
The NCAR 50Y was calibrated around June 2000 over a range of 10% RH to 90% RH at temperatures of 20, 26, 32, and 38 C. We find that over a normal range of operation, e.g. -10 C to 30 C, the Intercap humidity transducers are insensitive to temperature. Thus the calibration data are used to fit a second order polynomial in the sensor output voltage to measured RH, with no variation as a function of temperature. During operation, this polynomial is applied to the sensor output by an NCAR microprocessor. The 50Y employs a fiber GoreTex-like filter to protect the transducer from liquid water. These filters were used during SHEBA but was not used for the frost point laboratory tests.
The third hygrometer used during these tests was a Meteolabor TP3-ST miniaturized dew point hygrometer. The sensor assembly is physically separate from the control circuitry. Only the sensor assembly, containing the mirror and a ventilator, was placed in the temperature chamber. The mirror temperature is measured by a thermocouple relative to a metal block in the control unit. The absolute temperature of the mirror is thus the absolute temperature of the block, measured by an independent sensor, plus the temperature of the mirror relative to the metal block.
A.4 Frost Point Test, 12-15-00
This was our first satisfactory frost point test, with measured RH very close to saturation between 0 C and -30 C. Apparently we were still not achieving saturation in previous runs, but now the data from the capacitance sensors meet our expectations (a hazardous situation!). Below -30 C the divergence between the 235C and 50Y sensors even mimics that seen in the SHEBA field data. The only change from the 12-14-00 run was to replace a copper cooling coil inside the temperature chamber with a much shorter length of larger i.d. plastic tubing. This line carries the moist outside air to the small manifold holding the test sensors in the temperature chamber. We replaced the copper coil because we were concerned about possible freezing of liquid water in the long length of small i.d. copper tubing.
The dew point hygrometer does not output air temperature, so the temperature of the Vaisala sensors which are in the manifold upstream of the dew point hygrometer were used to calculate RH. Note that using the temperature of the Vaisala sensors adds additional uncertainty to the RH values calculated from the dew point hygrometer. The 50Y does not measure temperature below -40 C, so the median of the 235C temperatures was also used to calculate saturation vapor pressures at those temperatures.
The dew point hygrometer RH is in fair agreement with the 235C's. Between 0 and -20 C it appears that supercooled dew may be forming on the mirror rather than frost. Below -25 C, the dew point hygrometer indicates super-saturation.
A.5 Thunder Scientific Calibration of Dew Point Hygrometer, 12-18-00
We calibrated the Meteolabor TP3-ST dew point hygrometer in our Thunder Scientific humidity chamber. The Thunder Scientific calibration apparatus saturates air at one temperature and pressure and then pumps the air into the measurement chamber at another temperature and pressure to achieve the desired calibration atmosphere. Thus the calibration depends on measurements of temperature and pressure, not a direct measurement of humidity. The stated accuracy of the chamber is 1% RH.
A plot of the data shows RH.ice as measured by the chamber and by the dew point hygrometer, assuming that the mirror is covered by either dew or frost. I conclude two things from this test. First, this appears to confirm that the dew point hygrometer is measuring a dew point rather than a frost point between 0 C and -20 C. (There is one contradictory data point at -5 C.) Second, the dew point hygrometer reads high by about 2% RH from 0 C to 20 C and by about 3-4% RH between 0 C and -20C. These measurements support the conclusion that the frost point tests of the capacitance RH sensors are quite close to saturation wrt ice down to -20 C.
I'm still unsure about the data below -30 C. I looked briefly at that data and found that the 235C RH readings are still decreasing even after an hour soak at those low temperatures. Our protocol is to run for an hour at each temperature point and then collect the last 5 minutes of data before decreasing the temperature for the next data point.
A.6 Trends during the 12-15-00 Frost Point Test
Following are the time-rates of change of temperature and RH.ice for the 12-15-00 frost point tests. These were calculated as the slope of a linear fit to the time series data for the last 10 minutes of each 1-hour set point of the chamber temperature. The ETL data were collected at 0.2 Hz and the 50Y data were collected at 1 Hz.
The rates of temperature change are generally independent of temperature and sensor, suggesting that these may be real changes in the chamber environment. The rates of RH change are temperature-dependent and vary between sensors, indicating that at least a part of the RH rate-of-change may be caused by slow sensor response.
The magnitude of dRH/dt increases with decreasing temperature below -30 C. Does this imply increasing dis-equilibrium related to a slowed rate of condensation and thus a potential for super-saturation? If so, is a similar mechanism responsible for the field data?
Note that the time constant of capacitance RH sensors increases exponentially with decreasing temperature. For the 50Y we find
tau(T) = tau(20C)*10(293.15 - T(degK))/40
and tau(20C) is about 1 second without a filter covering the transducer. Thus tau(-40C) ~ 30 seconds.
ETL #5
T(degC) ndat dT/dt(degC/s) dRH/dt(%RH/s)
20.4 120 0.0e+00 -1.2e-04
11.1 117 -2.1e-04 1.2e-03
6.0 118 -1.1e-04 1.2e-03
1.3 118 -1.1e-04 6.8e-04
-3.5 116 -7.4e-05 3.6e-04
-8.3 118 -1.7e-04 -3.5e-04
-13.6 117 -1.1e-04 -8.7e-04
-18.3 118 -1.4e-04 -3.2e-05
-23.2 120 -1.7e-04 7.4e-05
-27.1 118 -1.6e-04 -5.3e-05
-32.3 113 -1.8e-04 -2.3e-04
-37.1 116 -1.7e-04 -4.3e-04
-41.5 117 -1.6e-04 -7.3e-04
-47.9 120 -1.6e-04 -8.3e-04
-53.2 120 -1.4e-04 -8.7e-04
ETL spare
T(degC) ndat dT/dt(degC/s) dRH/dt(%RH/s)
20.4 119 2.2e-05 -1.0e-04
11.2 119 -4.4e-04 2.2e-03
6.2 120 -2.4e-04 1.8e-03
1.3 120 -2.1e-04 1.0e-03
-3.6 120 -1.4e-04 8.8e-04
-8.7 120 -2.5e-04 -5.8e-04
-13.7 120 -1.9e-04 -3.8e-04
-18.5 120 -2.4e-04 2.1e-05
-23.6 120 -2.3e-04 -1.9e-04
-28.3 119 -2.4e-04 -3.1e-04
-33.0 118 -1.7e-04 -5.0e-04
-38.5 120 -1.8e-04 -8.0e-04
-42.7 119 -2.5e-04 -1.2e-03
-48.0 120 -2.2e-04 -2.0e-03
-52.5 119 -1.9e-04 -1.5e-03
ETL #4
T(degC) ndat dT/dt(degC/s) dRH/dt(%RH/s)
20.5 120 3.3e-09 -1.3e-04
11.3 120 -3.6e-04 1.8e-03
6.2 120 -1.7e-04 1.6e-03
1.4 120 -1.7e-04 9.0e-04
-3.6 120 -1.4e-04 6.7e-04
-8.6 120 -2.0e-04 1.2e-04
-13.7 120 -1.8e-04 5.8e-05
-18.7 120 -1.8e-04 5.2e-04
-23.6 120 -1.9e-04 2.5e-05
-28.5 120 -1.7e-04 -3.8e-04
-33.5 120 -1.8e-04 -7.4e-04
-38.4 120 -1.8e-04 -9.3e-04
-43.3 120 -1.6e-04 -8.6e-04
-47.9 120 -1.7e-04 -9.6e-04
-53.3 120 -1.4e-04 -9.3e-04
NCAR 50Y
T(degC) ndat dT/dt(degC/s) dRH/dt(%RH/s)
20.4 600 1.8e-09 -0.00012
11.2 600 -3.6e-04 0.00160
6.2 600 -1.8e-04 0.00130
1.3 599 -1.8e-04 0.00073
-3.6 600 -1.5e-04 0.00078
-8.7 600 -2.0e-04 -0.00170
-13.7 600 -1.7e-04 0.00094
-18.7 600 -1.7e-04 0.00096
-23.6 600 -1.8e-04 0.00050
-28.5 600 -1.6e-04 0.00013
-33.5 600 -1.7e-04 -0.00014
-38.4 600 -1.7e-04 -0.00024
-39.8 600 NA -0.00046
-39.8 600 NA -0.00052
-39.8 600 NA -0.00057
A.7 Thunder Scientific Calibration of Capacitance Hygrometers, 12-19-00
On 12-19-00 we calibrated the Vaisala capacitance hygrometers in the Thunder Scientific RH chamber. The calibrations were done at -15, -5 and +5 deg C and, at each temperature, data were collected at 4-5 humidities. The data are plotted as RH.ice versus temperature. The result is a somewhat odd looking plot, but it is not too hard to identify the related groups of data points.
The 50Y data are in best agreement with the chamber, possibly because this sensor was previously calibrated in this chamber. The 235C's read a little lower than the 50 Y and this is consistent with the results of the 12-15-00 frost point tests.
One aspect that I cannot explain is that the order of the data from the three 235C sensors appears to be opposite that of the frost point tests. Steve has looked again at the cabling and thinks that we are correctly associating each sensor with its data file. The sensors were placed in series in a manifold for the saturation tests but were exposed directly to the chamber atmosphere for the RH calibrations. Otherwise there were no changes, in particular to the wiring, between the two types of test.
A.8 Frost Point Test, 12-21-00
For this latest frost point test, the soak times below -30 C have been increased from 1 hour to 3 hours to see if there are any significant changes in the results. Plots of the data from this test are:
Decreasing temperature steps, 1-hour soak time below -25C
Decreasing temperature steps, 3-hour soak time below -25C
Increasing temperature steps, 1-hour soak time below -25C
Increasing temperature steps, 3-hour soak time below -25C
Some observations are as follows:
For decreasing temperature steps, the 1-hour soak time data look similar to the 12-15-00 frost point test, with the ETL "spare" 235C matching ETL #4 and #5 better than in the previous test. The 3-hour soak time below -25 produced slightly lower RH readings for the 235C and 50Y sensors, slightly higher RH readings for the dew point hygrometer.
For increasing temperature steps, the dew point hygrometer indicates ~105% RH.ice at temperatures below -10C, the same as for decreasing temperature steps. However, now the mirror appears to stay at the frost point all the way up to 0 degC. RH.ice measured by the capacitance sensors is lower than for the decreasing temperature step data. This is particularly pronounced above -25C. RH.ice decreases with increasing temperature from -25C to -5C. This same trend is found in the decreasing temperature step data, but only above -10C. The differences between 1-hour soak times and 3-hour soak times are minor.
The difference between the downward-stepping and upward-stepping results is troubling. Note that the dew point hygrometer readings are generally consistent while the Vaisala sensors are not.
A.9 Oil Bath Calibration of Dew Point Mirror Temperature, 1-03-01
In order to confirm (or not) the dew point hygrometer data, the sensor unit (but not the control unit) was calibrated in a temperature-controlled oil bath. The results are plotted as the temperature difference between the mirror and the bath (or the temperature error of the mirror) versus the bath temperature. The mirror temperature is increasingly overestimated with decreasing temperature, which would cause an overestimation of the water vapor pressure and of the relative humidity. This is qualitatively consistent with both the Thunder Scientific calibrations of the dew point hygrometer and with the assumption that the frost point test environment is saturated wrt ice.
There is an anomolous data point at -40 C that appears to be a 'glitch' in the dew point hygrometer reference temperature. If the reference temperature at -35 C is used to calculate the mirror temperature at -40 C, then the data point at -40 C follows the trend of the data at lower temperatures. Unfortunately, there is no known rationale for following this procedure other than making the data look better.
The temperature data have been converted to RH.ice by assuming that the oil bath temperature corresponds to the ambient air temperature,
RHice = 100*satvp.ice(T mirror)/satvp.ice(T bath)
where satvp.ice is the saturation vapor pressure wrt ice. A plot of RH.ice versus oil bath temperature shows that the errors in the mirror temperature produce errors in RH.ice at the frost point that are commensurate with the Thunder Scientific calibration of the dew point hygrometer, an overestimation of RH.ice by 2-3% RH above freezing and an overestimation of 3-4% RH down to -20 C. However, the inferred errors in RH.ice below -20 C are perhaps twice the magnitude of the super-saturated values of RH.ice measured in the frost point tests. It should be noted that the results of this test could only be used to quantitatively correct the dew point hygrometer data from other tests if the dew point reference temperature were the same in both cases.
A.10 Frost Point Test, 1-05-01
One caveat to the previous frost point tests is that the Vaisala sensors are in a common manifold, but the dew point hygrometer is in a separate enclosure immediately downstream of the manifold. Another caveat is that the Vaisala temperature readings in the manifold are used to convert the dew/frost point measurements to RH. It is certainly possible that the temperature and/or vapor pressure might be different in these two chambers, but a mechanism for causing that is not clear.
Another frost point test was run on 1-05-01 with the ETL 235C #5 collocated with the dew point hygrometer. For these tests the soak times below -20 C were 2 hours. Plots have been made for both the decreasing and increasing temperature steps. These results are generally quite similar to the results of the 12-21-00 frost point tests. In particular, these results confirm that the temperature and relative humidity in the dew point hygrometer chamber are very similar to the environmental conditions in the upstream manifold.
A.11 Frost Point Test, 1-10-01
The frost point test data have been changing from 12-15-00 to 1-05-01. One possible explanation would be contamination of the capacitance sensors and the dew point hygrometer mirror. Thus all sensors were cleaned with distilled water and another frost point test was run. The test started with a 1 hour soak at 50 C with the intent of additionally cleaning the sensors. This test returned to the original 1-hour soak times, but included both decreasing and increasing temperature steps. Note that the dew point hygrometer data was bad during the decreasing temperature steps at -20, 5 and 10 C.
In order to compare the data from the four frost point tests, the same plot format has been used, but segregated by hygrometer rather than by test. The following observations can be made regarding the changes of the data for each instrument from test to test:
Down to -40 C, the dew point hygrometer data for 1-10-01 are more similar to the 12-15-00 results than to following tests. These are generally the lowest RH.ice readings for all four tests.
Between -20 and -40 C, the 50Y hygrometer data for 1-10-01 are the lowest of all four tests, but are very similar to previous tests above -20 C.
The ETL #4 data are very closely clustered for the last three tests. The 12-15-00 data are noticeably higher, particularly below -20 C.
The ETL #5 data for 1-10-01 are generally the lowest of all four tests, particularly below -15 C. The 12-15-00 data are the highest, particularly below -25 C.
The ETL spare data are tightly clustered above -25 C for all four tests. Below -25 C, the ETL spare data for 1-10-01 are the second highest of all four tests, exceeded only by the 12-15-00 test.
A.12 Frost Point Test, 1-12-01
Following a meeting with Chris Fairall and Ola Persson to discuss the laboratory tests, Chris suggested that the data may indicate that the water vapor content of the air supplied to the temperature chamber for the frost point tests may be too high to avoid super-saturation at temperatures below -30 C. All previous test have used air at 20 C and 40% RH. For the following test, this was reduced to 0 C and 40% RH, which was selected in order to reach saturation wrt ice at -20 C. In addition, the length of the tubing within the temperature chamber upstream of the capacitance sensor manifold was increased from about 3 ft to about 15 ft in order to provide additional time and surface area for the air to reach equilibrium wrt ice.
The data from this latest test have been plotted for both decreasing and increasing temperature steps. The 235C capacitance sensors now read sub-saturation wrt ice, as Chris speculated. Unfortunately the dew point hygrometer appears to have a problem in this test. Above 0 C it read 120% RH and then recorded even higher super-saturations below 0 C.
The data from this test have been added to the summary plots for the individual sensors referenced in the preceding discussion of the 1-10-01 test. My conclusion is that we apparently need a reliable water vapor standard for these tests and cannot just assume 100% saturation wrt ice.
Appendix B: PAM Instrument Heights
Ed Andreas and Keran Claffey. have provided 1 hour estimates of TRH and sonic anemometer heights above snow.
The sensor height data values have been added to the 1 hour SHEBA PAM dataset with the following variable names:
Variable Description
Z.TRH.meas TRH sensor height above snow, interpolated from direct measurements, meters
Z.TRH.snowline TRH sensor height above snow, interpolated using snow-line data, meters
Z.sonic.meas sonic anemometer height above snow, interpolated from direct measurements, meters
Z.sonic.snowline sonic anemometer height above snow, interpolated using snow-line data, meters
The following documentation on the sensor height estimates was provided by Keran and Ed.
A Note on Time:
date/time
Year
Month
Day
Hour
Minutes
Calc
1997
10
14
0
30
10/14/1997 0:30
1997
10
14
1
30
10/14/1997 1:30
1997
10
14
2
30
10/14/1997 2:30
1997
10
14
3
30
10/14/1997 3:30
1997
10
14
4
30
10/14/1997 4:30
1997
10
14
5
30
10/14/1997 5:30
1997
10
14
6
30
10/14/1997 6:30
1997
10
14
7
30
10/14/1997 7:30
1997
10
14
8
30
10/14/1997 8:30
The original PAM data files included Year, Month, Day, Hour, minute columns as above. From these columns we made a date/time (Calc) column that reflected these given parameters. This date/time calc column is the only time column that appears in our data file.
According to the PAM project report, hourly averages are centered on the half hour; in other words, hourly averages are centered around the given time. 10/14/1997 2:30 means the averages are from data collected from 1:00 to 2:00 on 10/14/1997.
For all of the concern of exact times above, the times of the PAM instrument height measurements are not given in the PAM project report and the times of the snow line/stake measurements are not readily available. In figuring the interpolations, I used the time of 13:00 for when these measurements were made.
Instrument Heights above Snow
Atlanta:
There are two columns for TRH height and Sonic height. The first column (measured) contains actual measurements of height and the interpolation between these measurements. During periods of placement that only one measurement was made, this measurement was reported throughout the whole period of placement. (i.e., the sonic height was measured during the initial deployment of Atlanta, and not measured again until after an ATI sonic had replaced the Gill sonic. Since the ATI sonic was installed at a different height, no interpolation was attempted while the Gill sonic was in place. The initial measured height was reported in the measured column for the entire period of the Gill sonic placement.)
The PAM log contains Snow Line information from the Atlanta site. In comparing both Baltimore and Atlanta snow line data with the measured TRH/Sonic heights, we found that the TRH/Sonic heights decreased at about ½ of the snow line data depth increase. At Baltimore we found that this 1 to 2 correspondence effect ended after November. However, at Atlanta we found that this effect continued into April. During the melt season, at both Baltimore and Atlanta, there was a close 1 to 1 correspondence between the snow line data and the measured TRH/Sonic height data. We suspect that the initial one (TRH/Sonic) to two (Snow line) is caused because the snow is filling in the valleys (or voids) in the uneven ice surface until the snow surface is level. After the snow surface is leveled, the snow increases and decreases at the same rate on the snow line as under the TRH/Sonic data.
SONIC:
We only have the initial reading for the installation of the Gill Sonic height until this was changed to an ATI Sonic in April. We used the Snow line during this period to determine the changing height. We lined up the Snow/Sonic height at the 4/11/98 reading (when the ATI was installed) and again used the snow line (because of the many more snow readings then measured height readings) to determine changes in Sonic height until 6/22/98. These heights lined up well with the measured Sonic heights. After 6/22/98 the measured Sonic height and height based on the snow line diverged too much to continue using the snow line depths as an indicator to determine Sonic height, so we used the measured Sonic height. This divergence after 6/22/98 is not surprising as the snow line begins to include many melt ponds.
TRH Sensor:
Because of the many more snow line measurements then TRH height measurements, we used the snow line to determine the TRH height. These heights compared well until 6/22/98, the beginning of the melt season. After 6/22/98 there were no measurements of TRH height made until 8/29/98. The difference between the change in height of the TRH and the Sonic differ substantially between 6/22/98 and 8/28/98. It was felt that the TRH might have been measured above a surface modified by the effects of the placing ablation shielding under the Atlanta Tripod. Because of this, we based the TRH heights made after 6/22/98 on the measured Sonic heights.
Cleveland:
The Cleveland snow line showed a steady snow depth (less then a 4.4 cm change) while the PAM station was deployed. Therefore we used the initial measurements of instrument height for the whole period that Cleveland was deployed.
Seattle:
We are using the Sonic/TRH height measurements made at the site. There was only one measurement made for TRH height during this period. When first installed, on 4/16/98, a Gill Sonic was used and was measured as being 3.45m above the snow surface. On 4/22/98 an ATI Sonic was installed at 2.90m above the snow surface. The second measurement made on 5/16 was 2.87m, a change of only 0.03. These measurements were used in determining the height of the Sonic above the snow surface for the duration of Seattle.
The mainline snow line did run near Seattle; however, the main line was 300 m long, meaning that most of the line was far away from Seattle. If better 'instrument above snow' measurements are needed, it would be possible to take the section of the main line closest to Seattle and use these snow measurements to better estimate the instrument heights.
Maui:
There are no snow measurements other then the instrument height measurements taken near Maui, therefore we can only use interpolation between the actual height measurements.
Baltimore:
There are two columns for TRH height and Sonic height. The first column (measured) contains actual measurements of height and the interpolation between these measurements. During periods of placement that only one measurement was made, this measurement was reported throughout the whole period of placement. (i.e., the sonic height was measured during the initial deployment of Baltimore, and not measured again until after an ATI sonic had replaced the Gill sonic. Since the ATI sonic was installed at a different height, no interpolation was attempted while the Gill sonic was in place. The initial measured height was reported in the measured column for the entire period of the Gill sonic placement.)
The second column is modification of the heights measurements based on nearby snow depth measurements made on the Baltimore Snow Line.
The PAM log contains Snow Line information from the Baltimore site. In comparing both Baltimore and Atlanta snow line data with the measured TRH/Sonic heights, we found that the TRH/Sonic heights decreased at about ½ of the snow line data depth increase. At Baltimore we found that this 1 to 2 correspondence (during increasing snow depth) ended after November. During the melt season, at both Baltimore and Atlanta, there was a close 1 to 1 correspondence between the snow line data and the measured TRH/Sonic height data. We suspect that the initial one (TRH/Sonic) to two (Snow line) is caused because the snow is filling in the valleys (or voids) in the uneven ice surface until the snow surface appears flat. After the snow surface flattens out, the snow increases and decreases at the same rate on the snow line as under the TRH/Sonic data.
SONIC:
We only have the initial reading for the installation of the Gill Sonic height until this was changed to an ATI Sonic in April. We used the Snow line during this period to determine the changing height. We lined up the Snow/Sonic height at the 5/15/98 reading and again used the snow line (because of the many more snow readings then measured height readings) to determine changes in Sonic height. These heights lined up well with the measured Sonic heights. The last snow depth was measured on 7/9/98. After this date we used the measured sonic heights.
TRH Sensor:
Because of the many more snow line measurements then TRH height measurements, we used the snow line to determine the TRH height. There was only one place where the snow measurements did not line up well with the measured TRH height. The 5/15/98 measured TRH height was significantly below the snow line height. Because of this, we chose to use the measured TRH height on 5/15/98 then continued to use the Snow line based height after this date. The last snow depth was measured on 7/9/98. After this date we used the measured TRH heights.
Florida:
There are two columns for TRH height and Sonic height. The first column (measured) contains actual measurements of height and the interpolation between these measurements. During periods of placement that only one measurement was made, this measurement was reported throughout the whole period of placement. (i.e., during the period of placement of Florida at the original site, from 10/22/1997 to 04/01/1998, the instrument heights were measured only once, on 10/25/1997. This height was then reported in the measured column for the entire period of this placement.)
The second column is modification of the heights measurements based on nearby snow depth measurements. The closest measured snow to Florida is the Pittsburgh mass balance stakes.
We used the increase/decrease in average snow depth at Pittsburgh to determine the change in height through April 1st, when Florida was moved. Between April 1st and April 20th (Florida was moved to its summer location on April 20th) there were no measurements taken of the TRH height, therefore we have cannot determine the height the TRH sensor was between these two moves. There was one measurement made of Sonic height during this time period. We used this measurement along with the changing snow depth at Pittsburgh to estimate the height of the Sonic during this period.
After being moved to its summer home on April 20th, the measured heights of both the TRH sensor and the Sonic sensor do not change at the same rates as the snow depth at Pittsburgh. We suspect that this is because Florida was placed near (on) a ridge (high point) with only a small amount of snow underneath it. Therefore, from April 20th on, we depend solely upon the interpolation between the measured heights of these instruments. (It is worth noting that there were many more measurements of instrument height made after April 20th then before.)


