Introduction
T-REX Links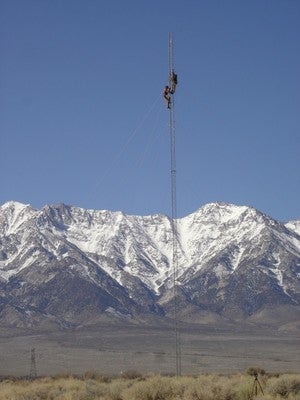
- T-REX IOP list
- Site Project Book (PDF)
- ISS TREX web page
- ISFF Sensor layout (Oct 2005)
- The ISFF site survey (Aug 2005)
- Info from Ralph Burton Re: U. Leeds permits (see next)
- Info from Vanda Re: building permits
- DRI station data
- Sierra Rotors site survey (by Mike Susedik)
Field Logbook
A computer-readable field logbook of comments by NCAR and other personnel is available in read-only html form.
Schedule
- February 6th, 2006 - begin setup
- February 23rd, 2006 - setup hot-wire tower and equipment
- March 1st, 2006 - begin operations
- April 30th, 2006 - end operations
- May 10th, 2006 - teardown over
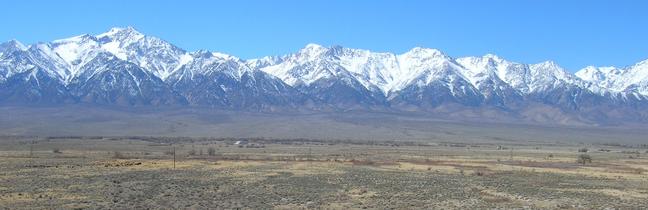
Measurement Sites
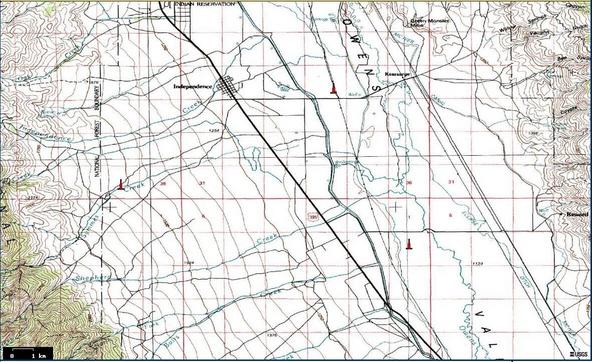
Map of all ISFF sites
Table of Sites
| Station # | Name | Latitude (deg N) | Longitude (deg W) | Elevation (m, GPS) |
|---|---|---|---|---|
| 1 | Central [approx} | 36° 48.091' | 118° 09.601' | 1155 |
| 2 | South | 36° 44.015' | 118° 07.376' | 1141 |
| 3 | West | 36° 45.595' | 118° 14.842' | 1529 |
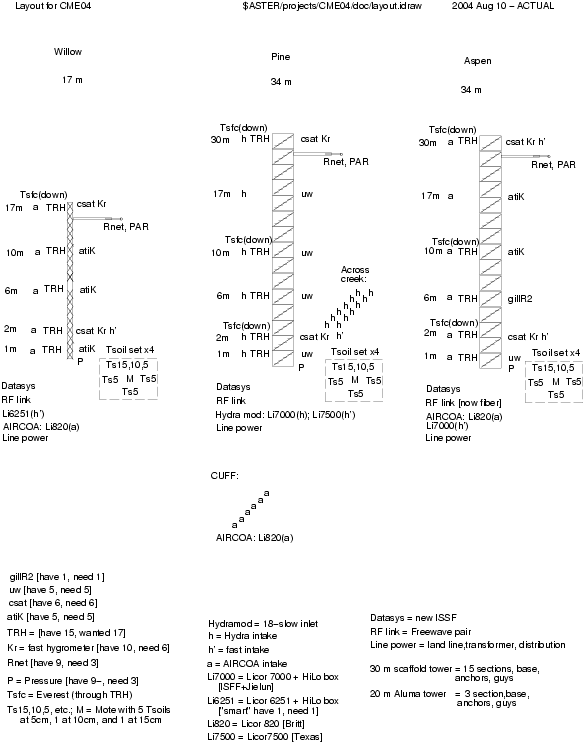
Instrumentation
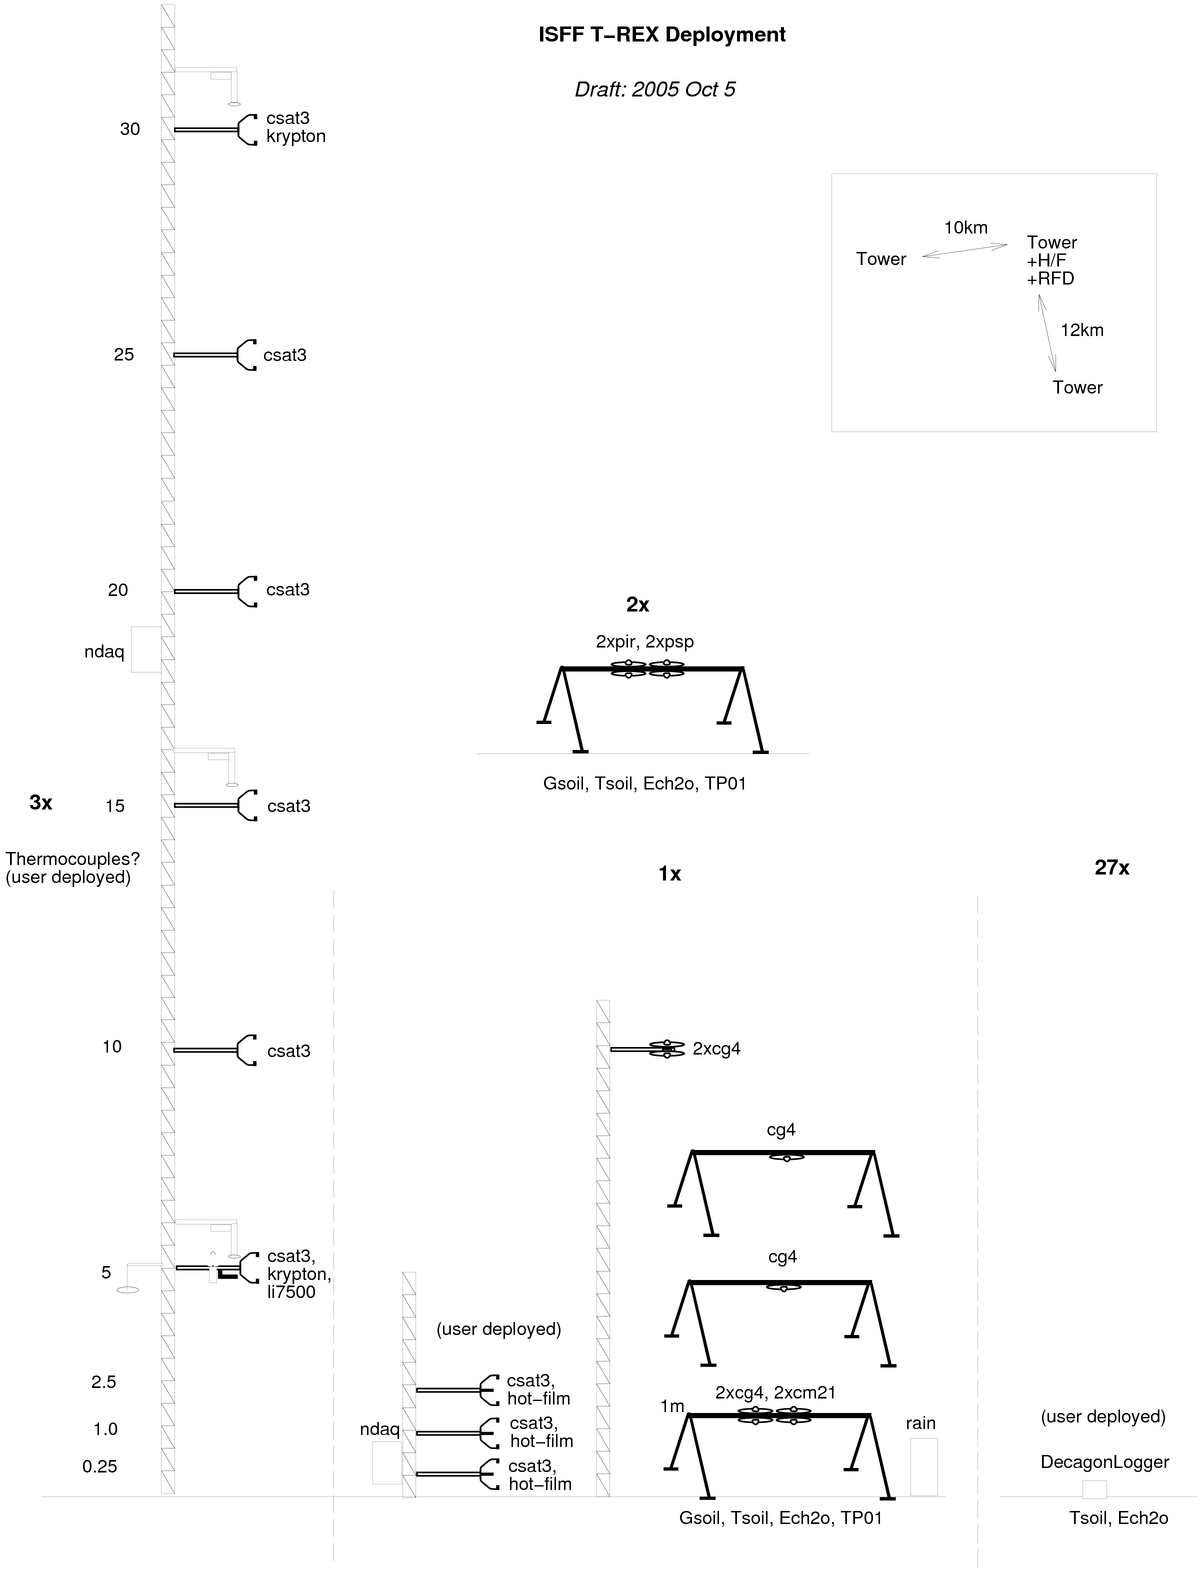
Layout of all sensors on the 3 towers in PNG format.
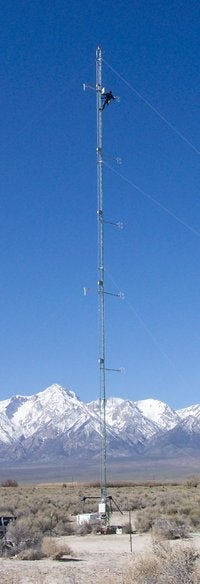
Each of the tower sites had a 110 ft (34 m) tower with instrumentation every 5 meters. These are:
- Sonic anemometers (all Campbell CSAT3) at 5, 10, 15, 20, 25, and 30 m (mean winds, momentum and sensible heat fluxes, and possibly mean temperature)
- Campbell KH2O Krypton hygrometers at 5 and 30 m (water vapor fluxes), located ~25 cm behind each of the CSAT3s
- T/RH sensors at 5, 15, and 30 m (mean humidity)
- Vaisala PTB220B, barometer at 1 m, with a single-disk static pressure port at 5 m
Each site also had a "darkhorse" radiometer stand with 4-component radiometers (Kipp & Zonen CM21 and CG4 at the the Central site and Epply PSP and PIR at the South and West sites). Located near this stand also is a set of soil sensors: heat flux (5 cm), soil temperature (1-4 cm), soil moisture (5 cm), and soil properties (5 cm).
In addition, the Central site had:
- Li7500 (CO2 fluxes) 5 m on the main tower [request from Mariah Carbone]
- 3 levels of 3-component hot-film anemometers (Disa miniCTA) on a separate 5 m(?) tower at 0.25, 1.5, and 2.5 m [planned]
- Campbell CSAT3 sonic anemometers colocated with each of the hot-film anemometers
- An additional pair of CG4s upward and downward-looking at a height of 10 m on a separate 11 m tower
- Two more downward-looking CG4s on separate radiometer stands to obtain a better spatial average. (These extra radiometers are to support a study of longwave radiative flux divergence)
Finally, the West site had a MetOne Model 9012 6-channel particle counter at 5 m for comparison to the REAL lidar backscatter.
Data Collection Notes
This was the first use of the Viper-based PC104 data systems, running the new data acquisition code for primary data acquisition. Prometheus-based PC104 systems running old ADAM code were used for all sensors on the hot-film tower at the Central site. MaxStream wireless links were used to connect the CR10x data loggers to the Viper system. A WLAN using a T-POP at the West site and Etherant IIIs at the other sites was used to transmit the data. The Etherant III locations were:
- "PAM" base trailer at the Independence airport
- Central site Viper
- Central site Prometheus
- South site [7 mile range]
- Independence Unified School [initial access to internet; later DSL at base was used]
- REAL trailer [internet access]
- DLR LIDAR trailer [internet access]
- ASU LIDAR trailer [internet access]
We had lots of network issues in the first part of the experiment. The biggest issue was a weak link to the school's outside link, presumably due to trees surrounding the school (limitations of routers were also an issue). For the most part, local data storage (USB disks) at each site prevented much data from being lost, though some were lost from South, before the USB disk was installed.
Sensor Notes
Sonic anemometer
CSAT3s were used at all sites. No problems were noted with these during the experiment. Data glitches that were caught by the sensor despiking algorithm appear always to be related to recent rain. The archived data appear to be good.
The 15 m sonic at central usually didn't restart itself when power went out. On occasions that this happened (usually due to batteries draining overnight), it was manually restarted when staff arrived in the morning. Thus, there are some outages of 2-4 hours on some mornings.
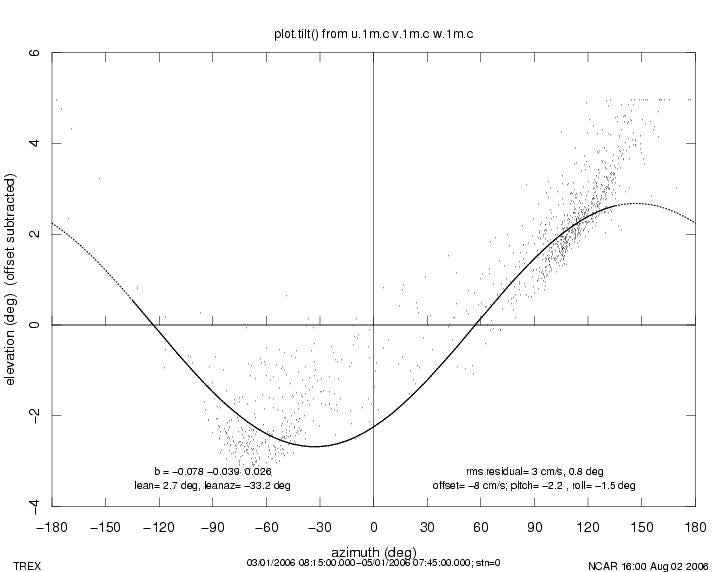
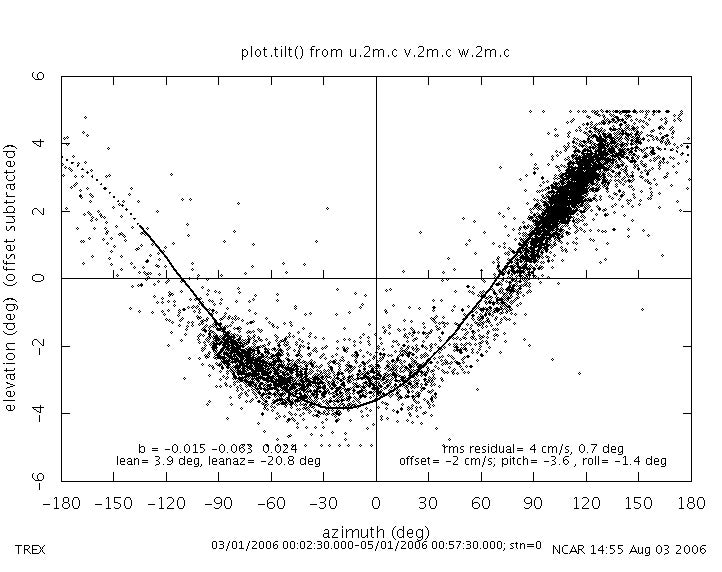
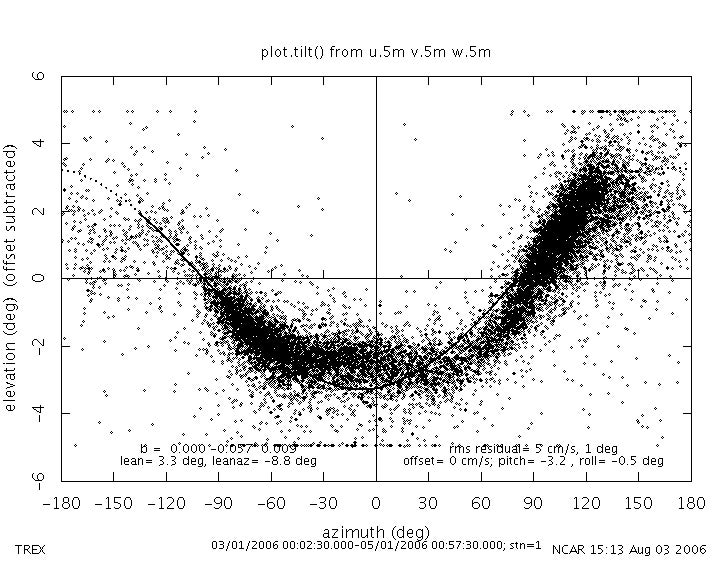
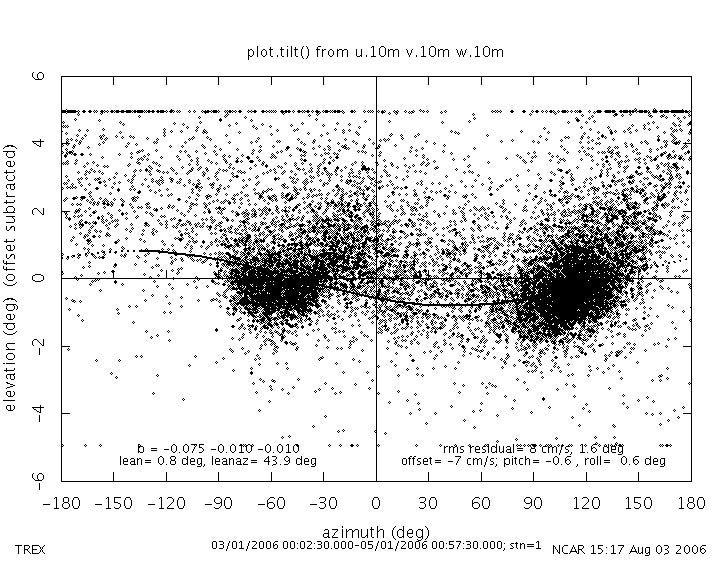
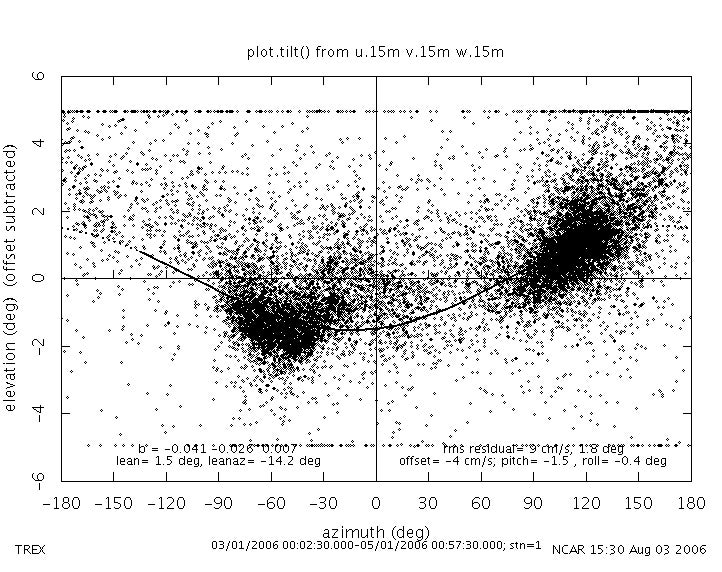
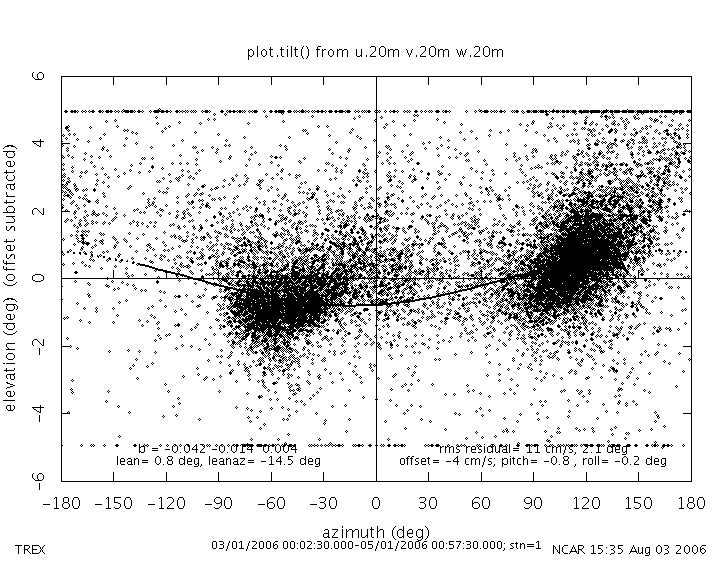
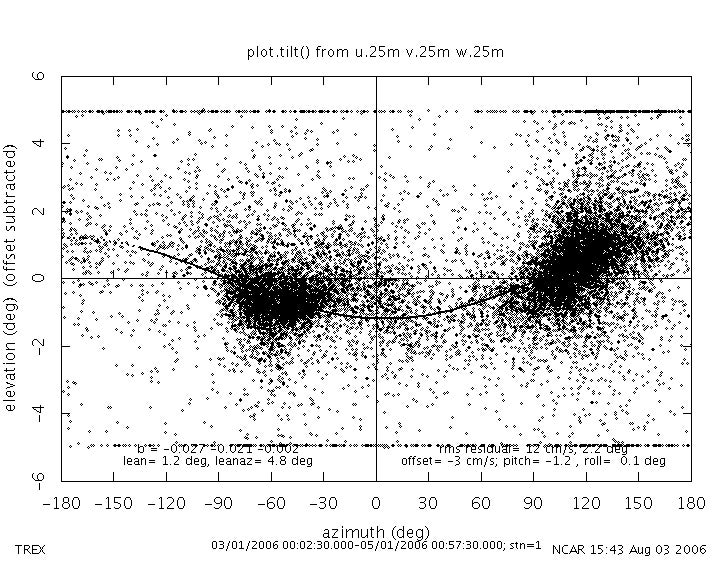
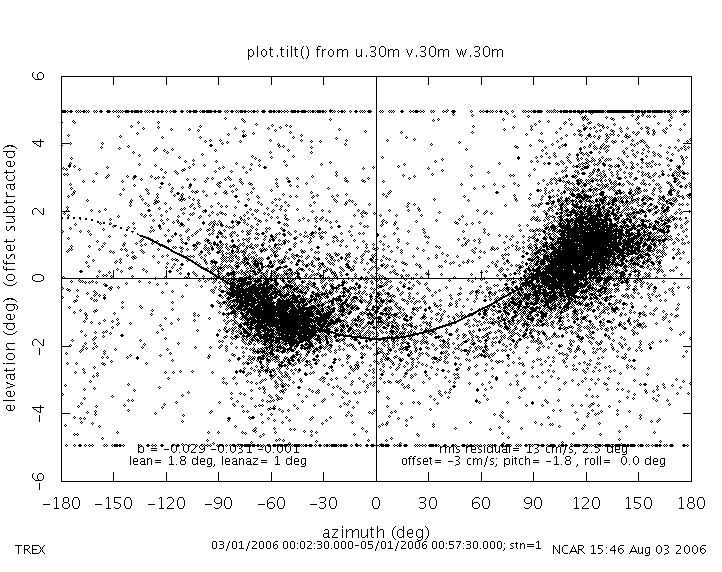
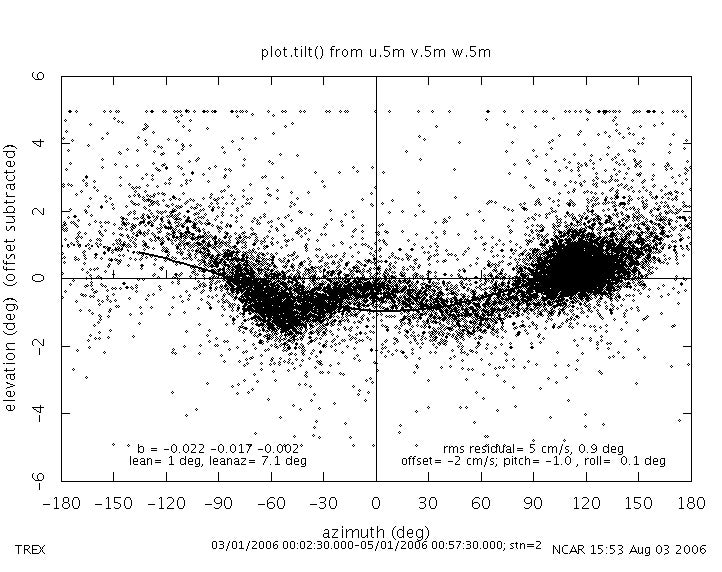
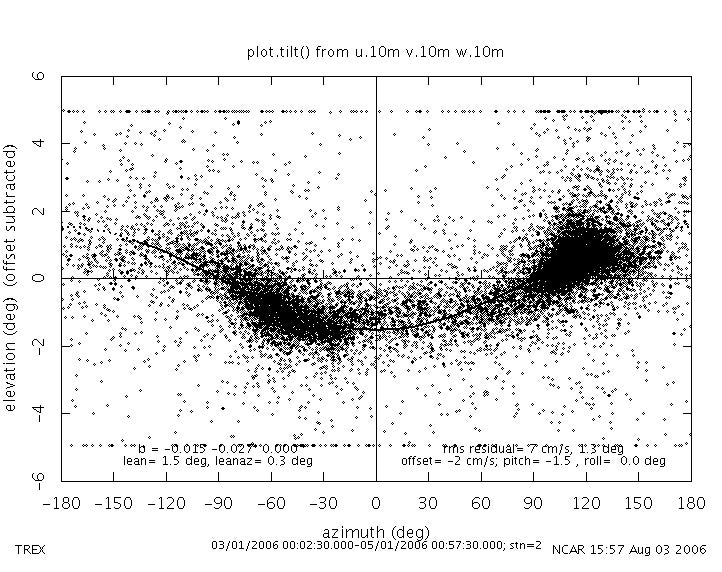
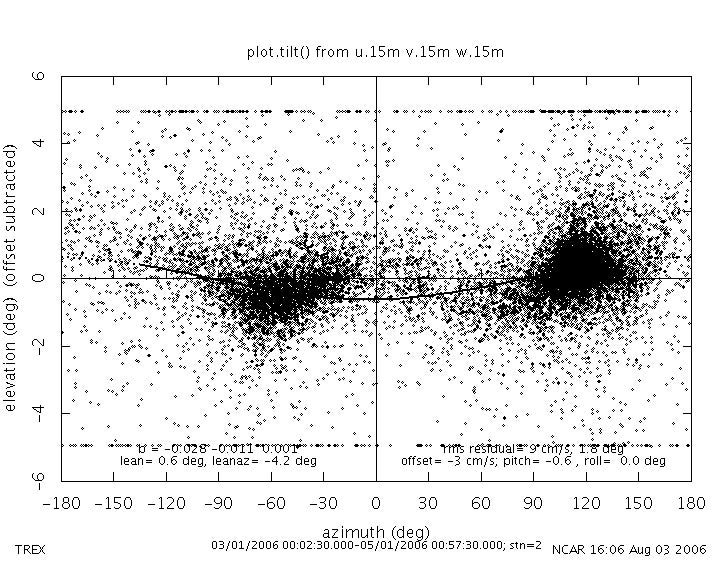
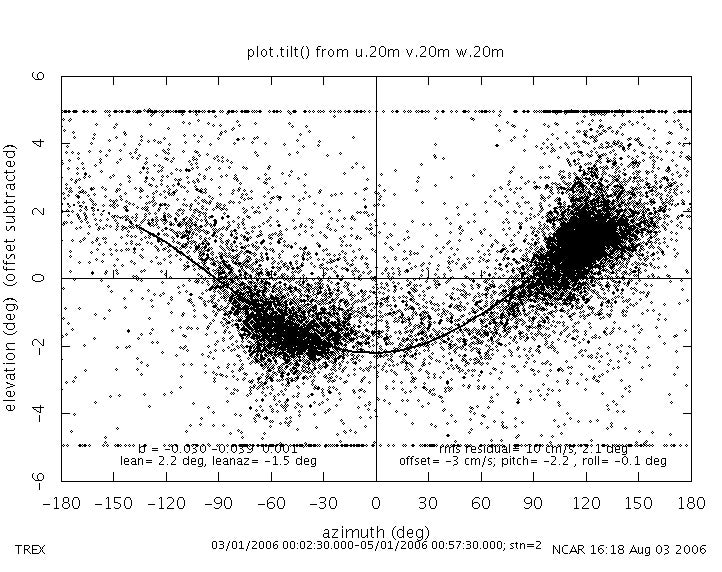
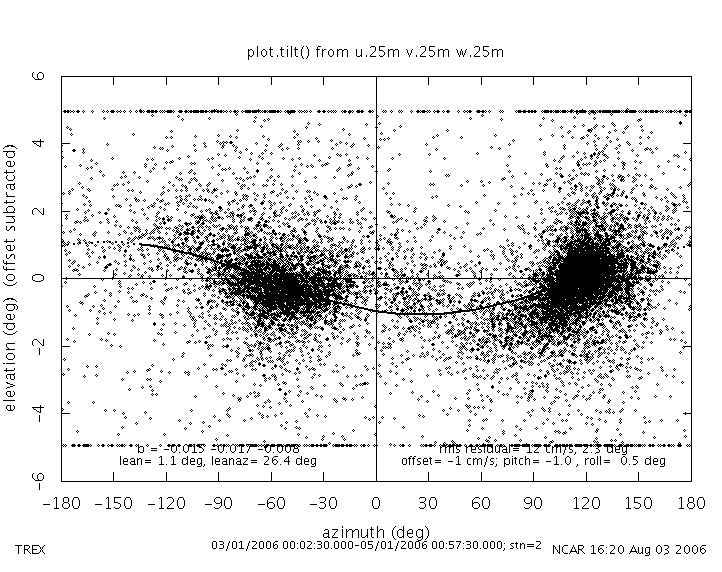
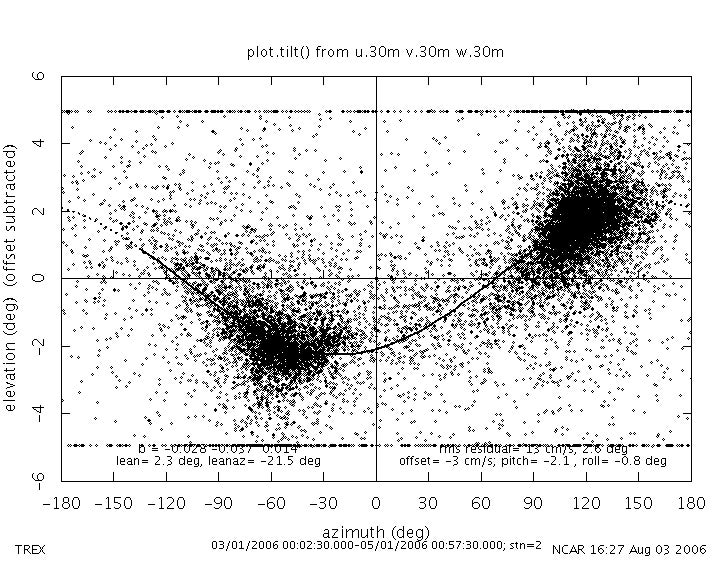
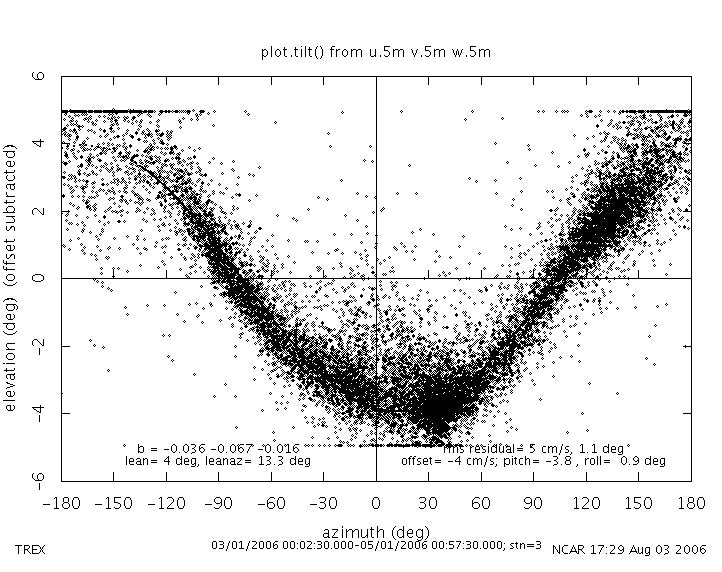
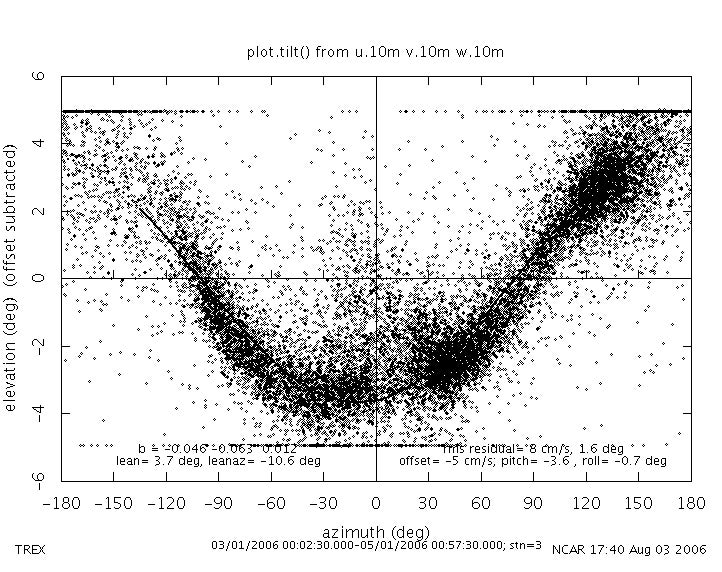
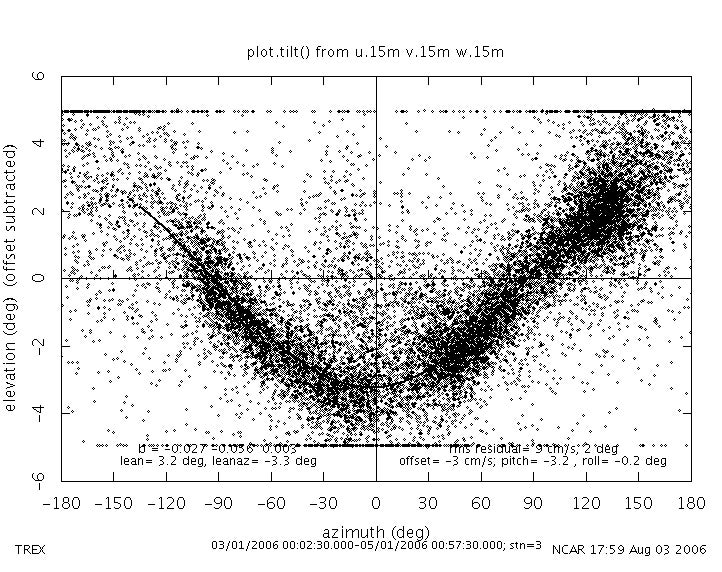
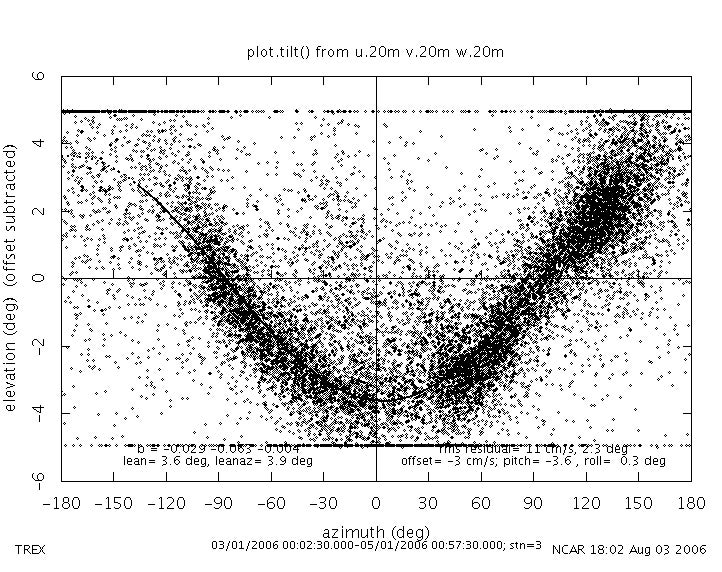
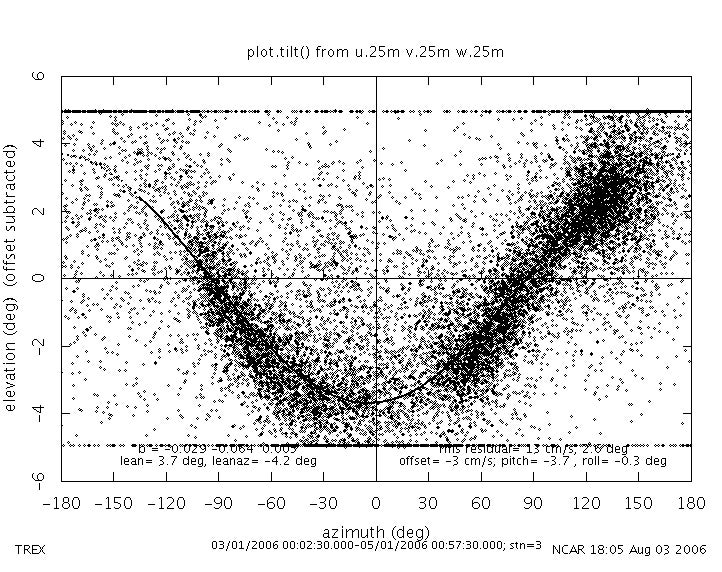
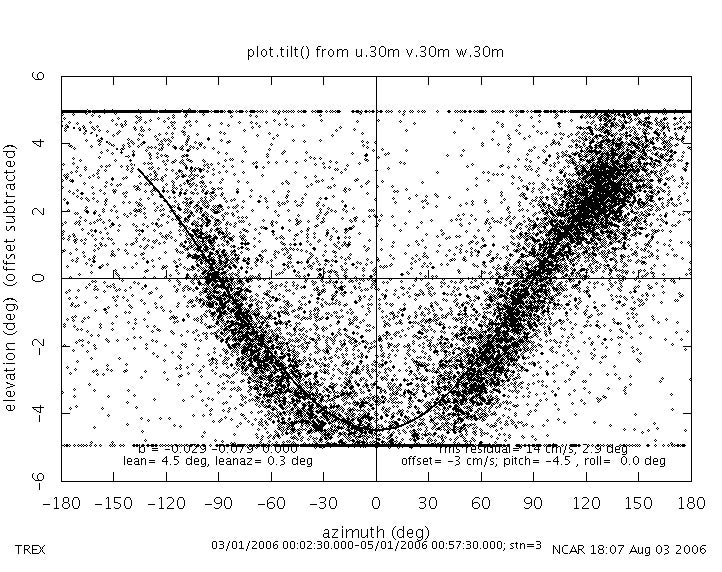
Please follow the link under "Height.site" to view a tilt plot of the sonic anemometers.
| Height.Site | Boom Angle (deg rel N) | Lean (deg) | Lean Azimuth (deg) |
|---|---|---|---|
| 1m.c | 88 | 2.7 | -33.2 |
| 2m.c | 87 | 3.9 | -20.8 |
| 3m.c | 88 | 4.4 | -20.0 |
| 5m.c (located on hot-film tower) | 85 | 3.3 | -8.8 |
| 10m.c | 92 | 0.8 | 43.9 |
| 15m.c | 92 | 1.5 | -14.2 |
| 20m.c | 93 | 0.8 | -14.5 |
| 25m.c | 92 | 1.2 | 4.8 |
| 30m.c | 93 | 1.8 | 1.0 |
| 5m.s | 91 | 1.0 | 7.1 |
| 10m.s | 90 | 1.5 | 0.3 |
| 15m.s | 91 | 0.6 | -4.2 |
| 20m.s | 91 | 2.2 | -1.5 |
| 25m.s | 91 | 1.1 | 26.4 |
| 30m.s | 91 | 2.3 | -21.5 |
| 5m.w | 92 | 4.0 | 14.3 |
| 10m.w | 91 | 3.7 | -10.6 |
| 15m.w | 90 | 3.2 | -3.3 |
| 20m.w | 91 | 3.6 | 3.9 |
| 25m.w | 90 | 3.7 | -4.2 |
| 30m.w | 91 | 4.5 | 0.3 |
All sonics reported at 60 sps.
The boom angles have been applied to the data, so winds are now in geographic coordinates (+u = wind blowing to East; +v = wind blowing to North; +w = upward). The tilt corrections have not been applied, to keep data from all towers in a similar reference frame (gravitational vertical). Note that fluxes from West (with tilt angles of ~4 degrees) will require some thought to interpret.
Krypton hygrometer
The kryptons generally worked fine. Spikes in the data due to manual sensor cleaning during the project will be removed from the NetCDF files. Unusually low krypton signals (presumably due to rain on the optics) also have been removed. There also were strange negative values from 7th to the 15th of March at 5m.c that will be investigated further.
The krypton at central.5m output the lowest signal levels. Thus, this was deliberately sited where the Li7500 also was reporting humidity fluctuations. However, this sensor reported values that were higher than those seen during pre-experiment laboratory calibrations (and post-experiment calibrations were not done for this sensor). Therefore, we have chosen to adjust the V0 value for this sensor to an arbitrary value higher than that usually seen in the field. This choice only affects the offset of the calibrated value, so fluxes will not be affected.
Values of sensible and latent heat flux derived from the measured sonic w, virtual temperature, and krypton hygrometer have been added to the NetCDF files where kryptons were installed.
Li7500
The Licor-7500 generally worked fine. All unrealistic spikes in carbon dioxide measurements appear to be related to recent rain events. Those unrealistic data have been removed from the NetCDF files. There are also a few outliers (~5 points) in various spots throughout the data that were removed. The calculated fluxes also have the Webb correction applied. This drastically changed the fluxes from looking like there was respiration/update to a tiny amount of respiration (except for a bit of uptake during tear-down in early May). This is more realistic given the scenescent greasewood.
T/RH
Three of the T/RHs failed, giving readings that were offscale (we suspect the A/D on these sensors got "stuck" somehow). These were serial numbers 006, 703, and 704. The sites affected were:
- South, 15 m: 3/6, 10:30 - 3/13, 18:15
- South, 15 m: 3/15, 10:15 - 3/16, 11:15
- West, 30 m: 4/26, 12:00 - 4/27, 10:00
This problem was fixed either by power-cycling the sensor, sending them a reset command, or replacement. Data during these periods have been removed from the NetCDF files.
Barometer
Operated normally.
Rain Gauge
There are no data before April 6th, 2006, due to the rain gauge cable being connected to the wrong channel on the datalogger. Presumed rain dates judged from zero voltage readings from the krypton hygrometer as water moisture readings are as follows:
March 20th, 2006: ~17:00-00:00 (intermittent rain occured at all sites)
April 3rd, 2006, ~13:00 - April 4th, 2006, ~11:00 (intermittent rain occured only at west site only)
April 4th, 2006, ~15:00 - April 5th, 2006, ~1:00 (intermittent rain occured at all sites)
Radiometers
NOAA performed precals on all sensors during Dec 2005/Jan 2006. Since we expect PIR calibrations to be relatively stable, and only 2 of the 6 CG4s had ever been used (and the 2 only once during RICO), we decided to perform only post cals on Tcase and Tdome. The CR10s for all K & Zs reported resistance values, so we expect to be able to apply post-cals in post-processing. Dailyplots will implement the calibration polynomials.
Longwave radiation values calculated from the measured Rpile, Tcase, and Tdome values have been added to the NetCDF files (note that the K & Z pyrgeometers do not have Tdome sensors).
A data logger programming error caused us to not record Tcase values from the main 4-component stand pyrgeometers at central. This was corrected on March 14th. Tcase data before then have been removed. Note that Rlw will also be missing during this period. We advise users who need 4-component radiation values (e.g. to compute the surface energy balance) to use Rlw values from the 10 m sensors instead during this period.
The radiation sensors were routinely cleaned, which at times may have caused some spikes in the data. Those bad data caused by interference were removed from the NetCDF files. There was one other unusual spike in the Rlw data during a 30-minute period on the west tower that was removed.
The wind speed correction recommended by Campbell Scientific for the net radiometers has been implemented, using winds measured at 5 m and using an assumed displacement height (d, 2/3 of an estimated canopy height, H) and a roughness length (z0) calculated from the 100 hours of near neutral cases [|z/L|<0.01] ) to reduce them to the radiometer height of about 1.7 m.
| Site | H (cm) | d (cm) | z0 (cm) |
| central | 80 | 53 | 16 |
| south | 80 | 53 | 12 |
| west | 10 | 7 | 6 |
Soil sensors
Qsoil
Salinity of the soil appears to have affected the calibration of the Ech2o probes, especially at the central site. Therefore, we have tried to use information from field gravimetric samples and two sets of laboratory post-calibrations using soil samples from each site. The first set of laboratory measurements was done using the entire retrieved sample -- approximately 3 kg of soil -- in a tub ~40 cm x 25 cm, with the soil ~8 cm deep. The soil was stirred, the Ech2o probes used at each site were inserted in the middle of the sample, and the soil wetted to field capacity. Gravimetric samples using a small (~1.2 cm diameter x 5 cm long) tube were taken manually daily while the sample dried in room air.
The second lab tests used a digital scale whose readout was recorded continously. This was done to avoid sampling errors, since the entire sample was weighed. However, the scale was limited to samples less than 1 kg, so a smaller volume 28 cm x 10 cm x 4cm was used. The sample was prepared the same way as above.
The results from these reference measurements are shown here along with the reference calibration from the Ech2o manual. The results are not consistent. West's values are reasonably consistent, with agreement between the manual gravimetric measurements both in the lab and in the field, and the same zero moisture value for all measurements. Values at high moisture levels (near field capacity) seemed inconsistent with the other values and were rejected from the fit; especially since the field measurements were at low moisture levels. The automatic laboratory measurements were always lower than the manual measurements for West.
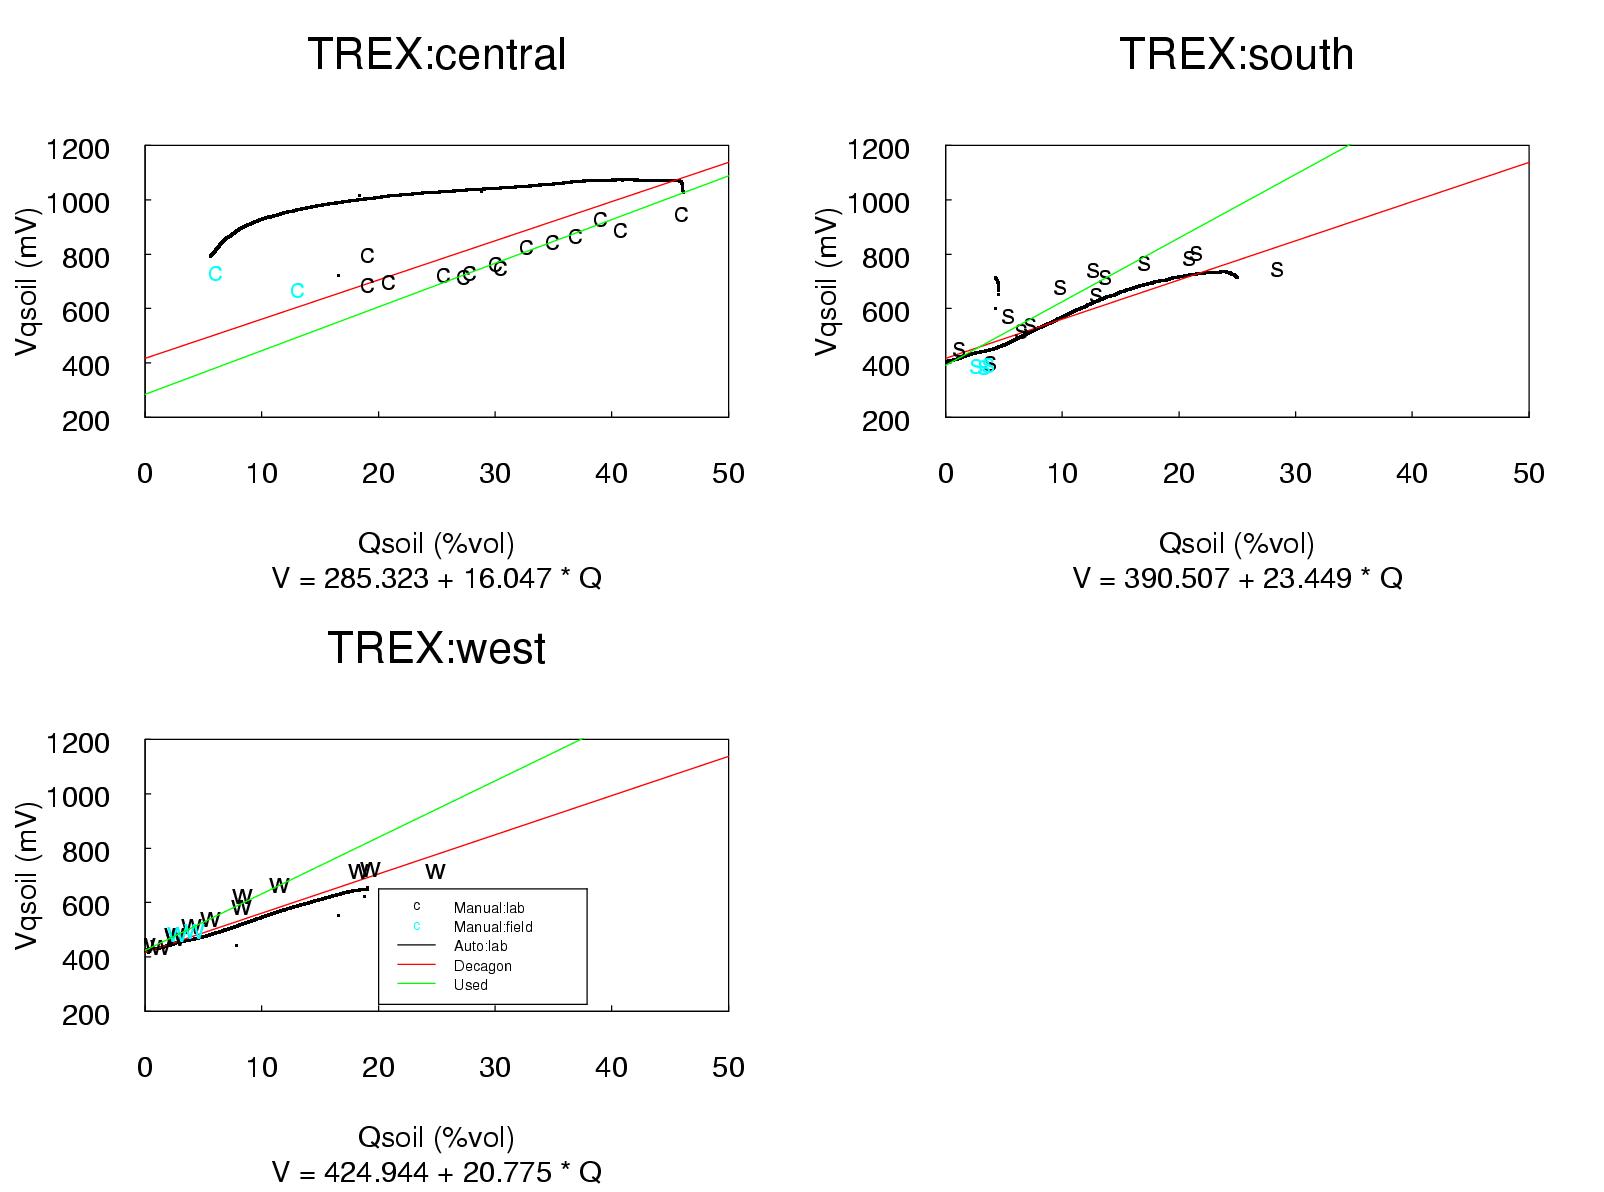
For South, the automatic measurements again were lower than those taken manually, except for one manual measurement at 4% moisture that was taken after the probe was inserted, but before the water was added. This reading is below the manufacturer zero intercept value, but is similar to that measured in the field. We conclude that the probe needed to be "wet-seated" into the soil type present at South and, in the dry conditions that occurred during TREX, the probe never had proper contact with the soil (this is the reason that values observed in the field using the Decagon calibration were always negative). We have included these data in the final data set to show the slight drying trend, but obviously they should not be used quantitatively! As the field gravimetric measurements showed Qsoil values of 2-3%, and significant rain did not appear to occur at this site, we would advise using a constant value of 2.5% for the experiment.
At Central, the automatic measurements clearly do not make sense. We conclude that the volume used was insufficient to perform a calibration (and thus are suspicious of the automatic measurements for West and South, as well). The soil appeared to have a much larger clay contact than at the other sites which held moisture even though the surface skin often cracked. This sample was dried much longer than the others (even in an oven at 45 degC) and never got much below 20%. In this case, we are also suspicious that the field gravimetric samples might not have been given sufficient time to dry (our standard field procedure is to dry for 24 hours at 100 degC).
Thus, we conclude that the only measurements useful for calibration are the manual lab measurements, and even these excluding the range near field capacity. The fits derived from this subset of the calibrations have been used in the final processing of these data.
Data from the logger used at the main 4-component radiation stand at central were intermittently corrupted by the radio link that was used. Various soil values (mostly Qsoil) were affected by this problem. An attempt to implement a generic correction was not successful. Thus, the data have been despiked and values with large jumps removed. This resulted in the loss of about 14% of the samples, which should not have a noticable impact on the data from these slow-response sensors.
Rain was logged at the base trailer on the night of February 27th. The data at Central appear to be reasonable through this rain, though not much change is seen. The data at West clearly change a lot, so the data prior to the rain have been assumed to indicate that the probe was not well seated into the soil and have been removed. Raw data from South prior to the rain were not recorded.
Tsoil
Tsoil values were noted by field staff to be significantly different between the 3 sites. Calibration coefficients in the logger were checked and found to be correct. During tear-down, readings from these sensors were manually checked in an ice and "armpit" bath and found to be reasonable (I think we ran these through a post-cal in the lab as well). Thus, we now believe the measured values (and thus large site-to-site differences) were real.
Gsoil
Soil heat flux probes (REBS) were installed at 5 cm depth at each site. No issues were noted with these sensors. The archive has values from these probes (Gsoil) as well as values for the heat flux at the surface including the heat storage measured by the Tsoil (dT/dt) and TP01 (Cv) sensors.
TP01
The same RF communication problems at Central noted with Qsoil affected the recorded TP01 values. The data in the archive have been recomputed using the edited dataset.
Values for the soil heat capacity, thermal diffusivity, and thermal conductivity derived from the TP01 readings have been added to the NetCDF files.
There were two separate wiring problems that occurred at West, causing at least 2 weeks of data outages in both March and April. These data cannot be recovered and any spurious values have been removed.
At both West and South, the TP01 readings changed abruptly, presumably associated with rain on April 6th. Since it is unlikely that this was due to a true change in properties, it probably reflects better contact of the probe with the soil after wetting (though Qsoil didn't change much). We have decided not to remove these data from the archive, but the latter values probably are correct.
Gravimetric
Manual measurements of soil moisture and soil bulk density were made several times during the program. These used a standard coring tool and wet and dry weights separated into two depth ranges were made in the lab. Some bulk density measurements were unobtainable due to soil spillage from the corer. Later in the program, volumetric readings using a TRIME-FM probe were made, generally averaging from 0-7cm. Note that the TRIME is also susceptible to the salinity problems noted above with the Ech2o sensors (especially at central). These are all tabulated below:
| Station | Date & Time (PDT) | TRIME (%) | Depth (cm) | Gravimetric (%) | Density (g/cm^3) |
|---|---|---|---|---|---|
| central | 3/18; 1215 | 0-3 | 19.4 | 0.67 | |
| central | 3/18; 1215 | 3-6 | 26.2 | 1.18 | |
| central | 3/30; 1440 | 0-3 | 12.4 | - | |
| central | 3/30; 1440 | 3-6 | 22.9 | - | |
| central | 4/7; 1650 | 0-3 | 14.8 | 0.41 | |
| central | 4/7; 1650 | 3-6 | 25.3 | 1.55 | |
| central | 4/19; 1320 | 37 | 0-3 | 9.43 | 0.70 |
| central | 4/19; 1320 | 3-6 | 28.8 | 1.32 | |
| central | 4/24; 1430 | 39 | 0-3 | 28.5 | 1.19 |
| central | 4/24; 1430 | 3-6 | 35.7 | 1.44 | |
| central | 4/29; 1430 | 41.5 | 0-3 | 10.9 | 1.11 |
| central | 4/29; 1430 | 3-6 | 20.5 | 1.63 | |
| south | 3/16; 1130 | 0-3 | 2.41 | 1.49 | |
| south | 3/16; 1130 | 3-6 | 4.52 | 1.68 | |
| south | 3/30; 1145 | 0-3 | 1.60 | 1.63 | |
| south | 3/30; 1145 | 3-6 | 3.72 | 1.54 | |
| south | 4/9; 1120 | 0-3 | 1.96 | 1.67 | |
| south | 4/9; 1120 | 3-6 | 3.63 | 1.53 | |
| south | 4/20; 1900 | 6.9 | 0-3 | 0.77 | 1.28 |
| south | 4/20; 1900 | 3-6 | 2.14 | 1.73 | |
| south | 4/25; 1320 | 3.0 | 0-3 | 0.96 | 1.58 |
| south | 4/25; 1320 | 3-6 | 3.85 | 1.69 | |
| south | 4/29; 1550 | 2.8 | 0-3 | 0.50 | 1.75 |
| south | 4/29; 1550 | 3-6 | 0.90 | 1.37 | |
| west | 3/16; 1345 | 0-3 | 1.61 | 1.71 | |
| west | 3/16; 1345 | 3-6 | 4.74 | 1.39 | |
| west | 3/30; 1540 | 0-3 | 2.60 | - | |
| west | 3/30; 1540 | 3-6 | 4.99 | - | |
| west | 4/6; 1600 | 0-3 | 2.68 | 1.56 | |
| west | 4/6; 1600 | 3-6 | 6.86 | 1.75 | |
| west | 4/18; 1723 | 9.6 | 0-3 | 1.42 | 1.86 |
| west | 4/18; 1723 | 3-6 | 3.14 | 1.67 | |
| west | 4/24; 1145 | 5.4 | 0-3 | 1.27 | 1.49 |
| west | 4/24; 1145 | 3-6 | 3.43 | 1.63 | |
| west | 4/29; 1640 | 2.8 | 0-3 | - | 1.87 |
| west | 4/29; 1640 | 3-6 | 1.58 | 1.10 |
From this table, the median bulk density at central is 0.70 g/cm^3, south is 1.60 g/cm^3, and west is 1.71 g/cm^3.
Hot-film sensors
These will be discussed in a separate page by the PI [Poulos].
Photographs
- First Site Survey (Aug 2005)
- Second Site Survey (Jan 2006)
- Central Site
- South Site
- West Site
- Other Photos
- Brian Shield's Photos
- Brian Pereira's Setup Photos
Data Tables and Plots
Click on the above link to view tables and plots.
The tables display mean, deviation, number of missing values, and number of clipped values for each variable, from 0:00-6:00, 6-12:00, 12-18:00 and 18-24:00 each day.
The 5 minute statistics for most variables are shown on time-series plots.