The CABL deployments supported educational outreach for a range of ages including high school (Erie High School), undergraduate (CU), graduate (CU), and middle school middle school (Watershed School). This section is organized by institution, with discussion regarding specific instrument platforms within each institution’s section.
Erie High School
MGAUS
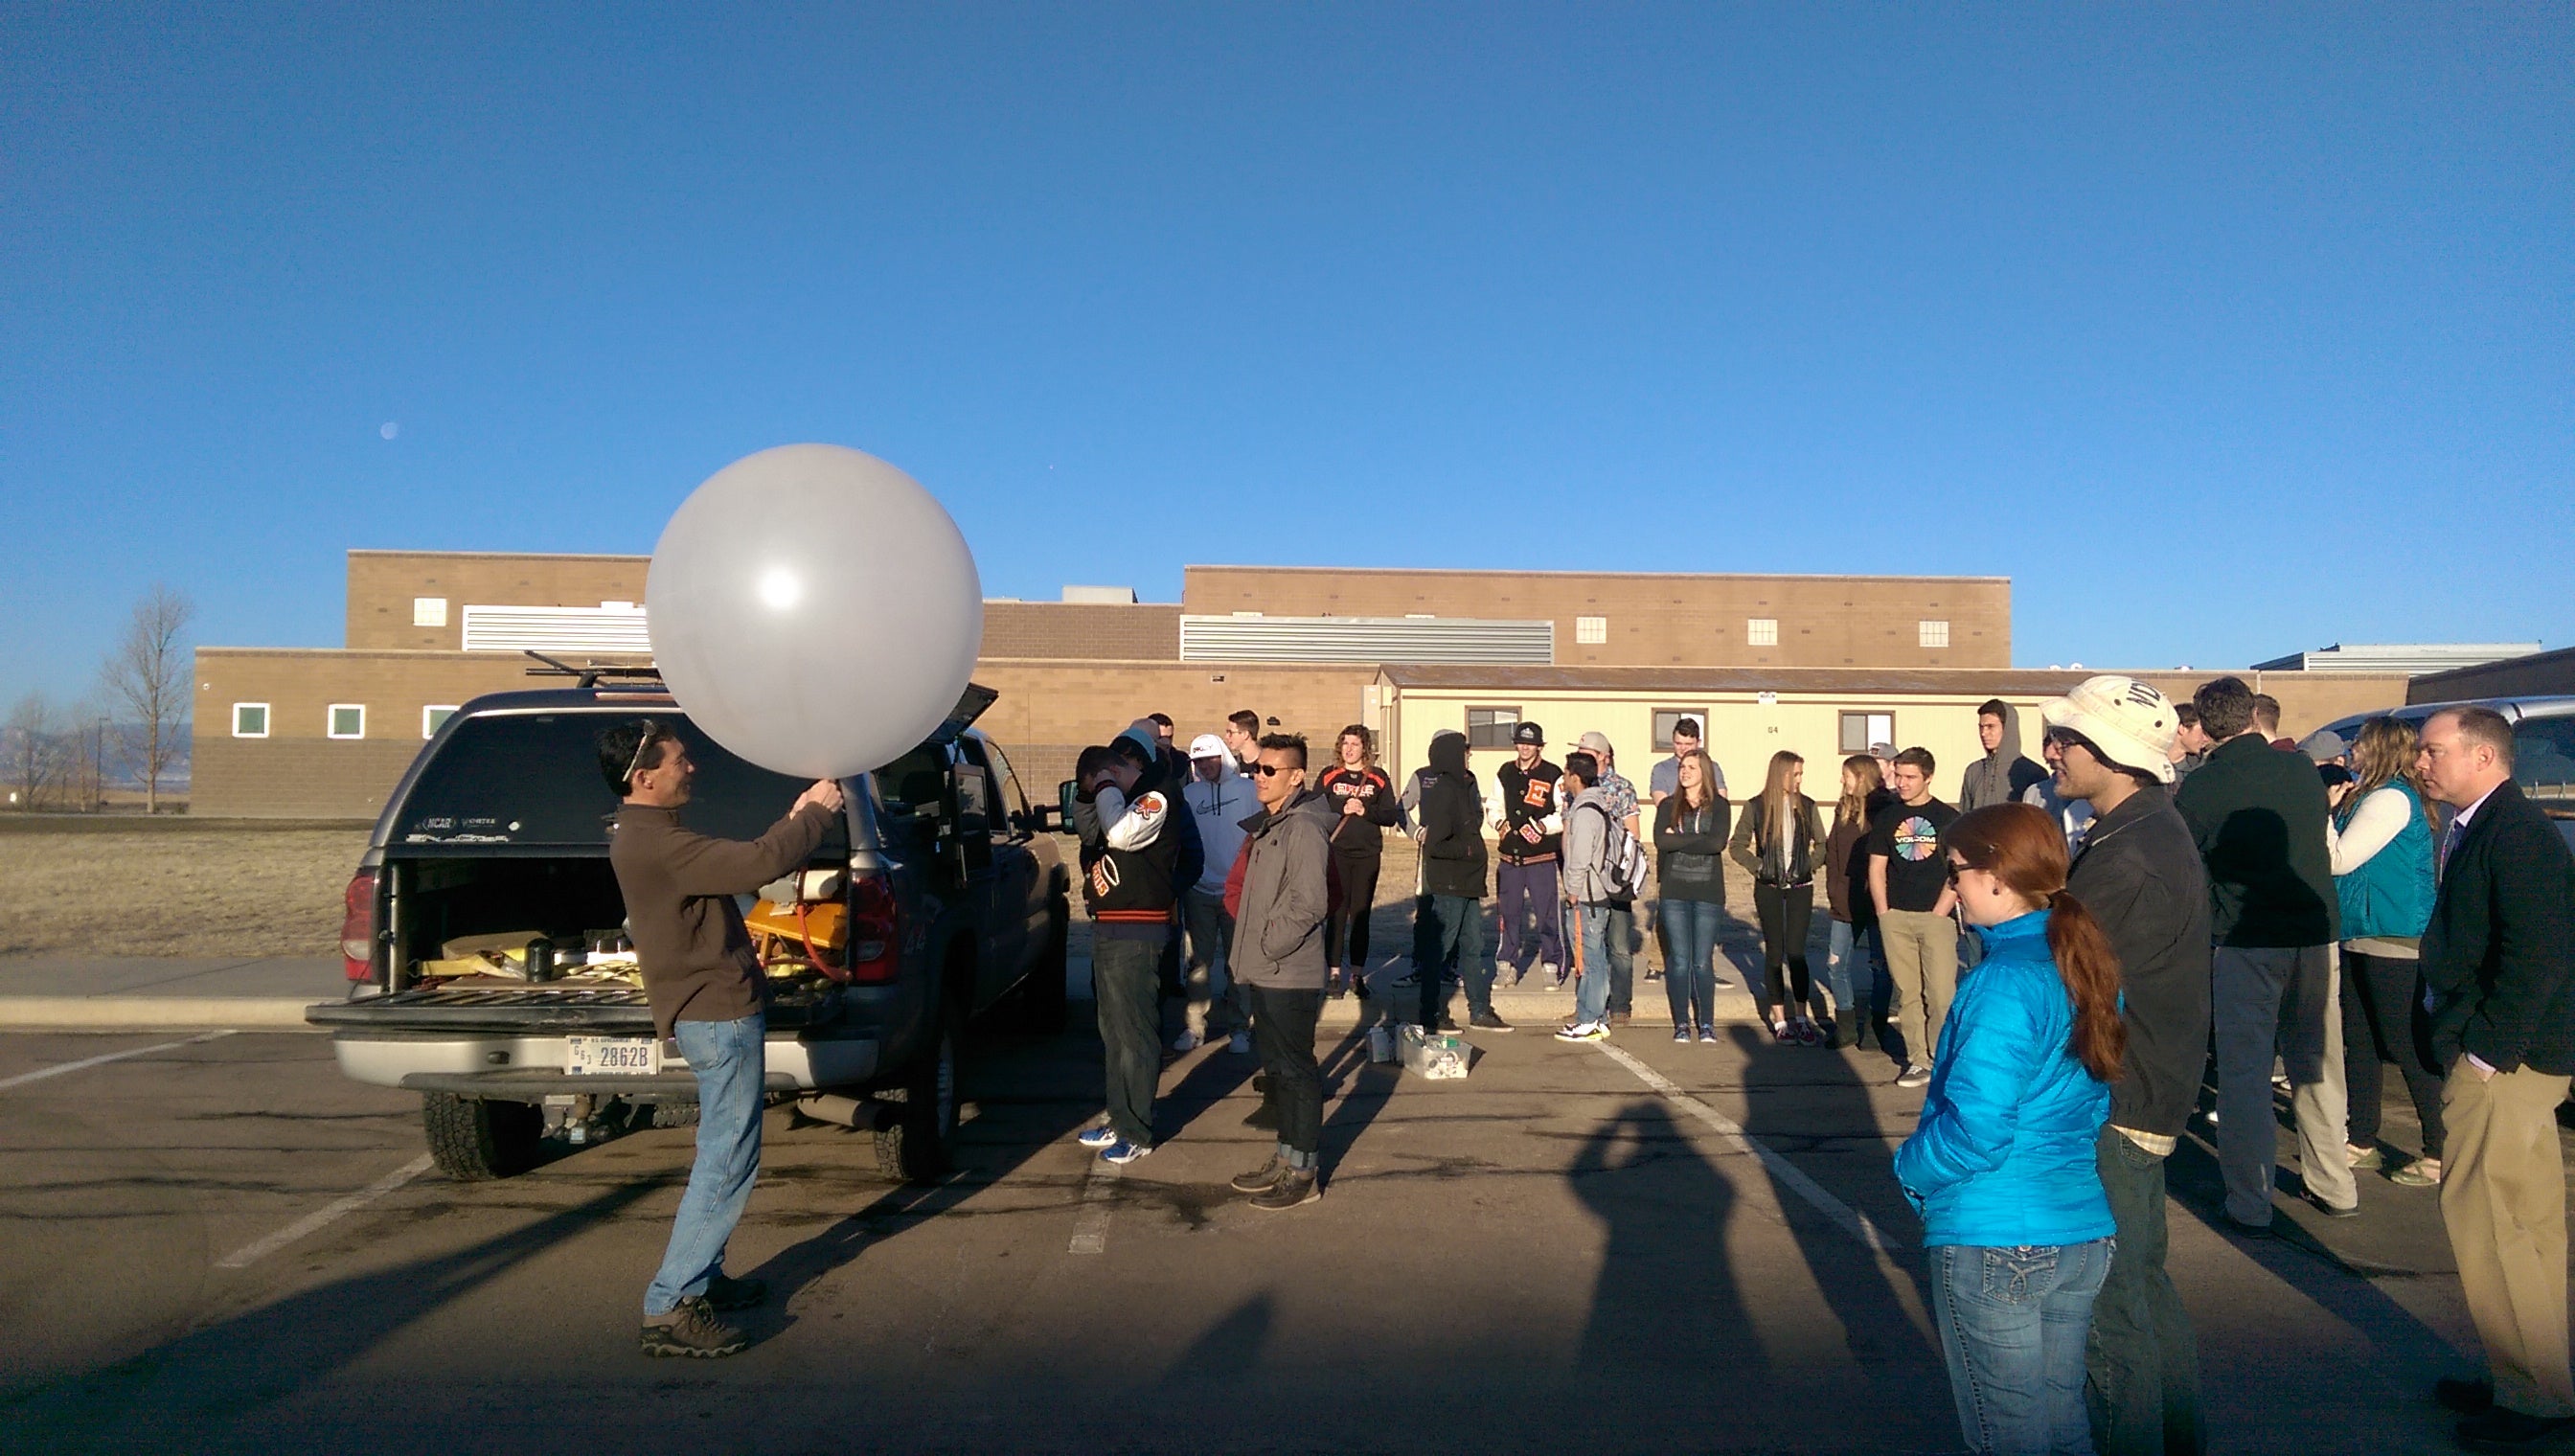
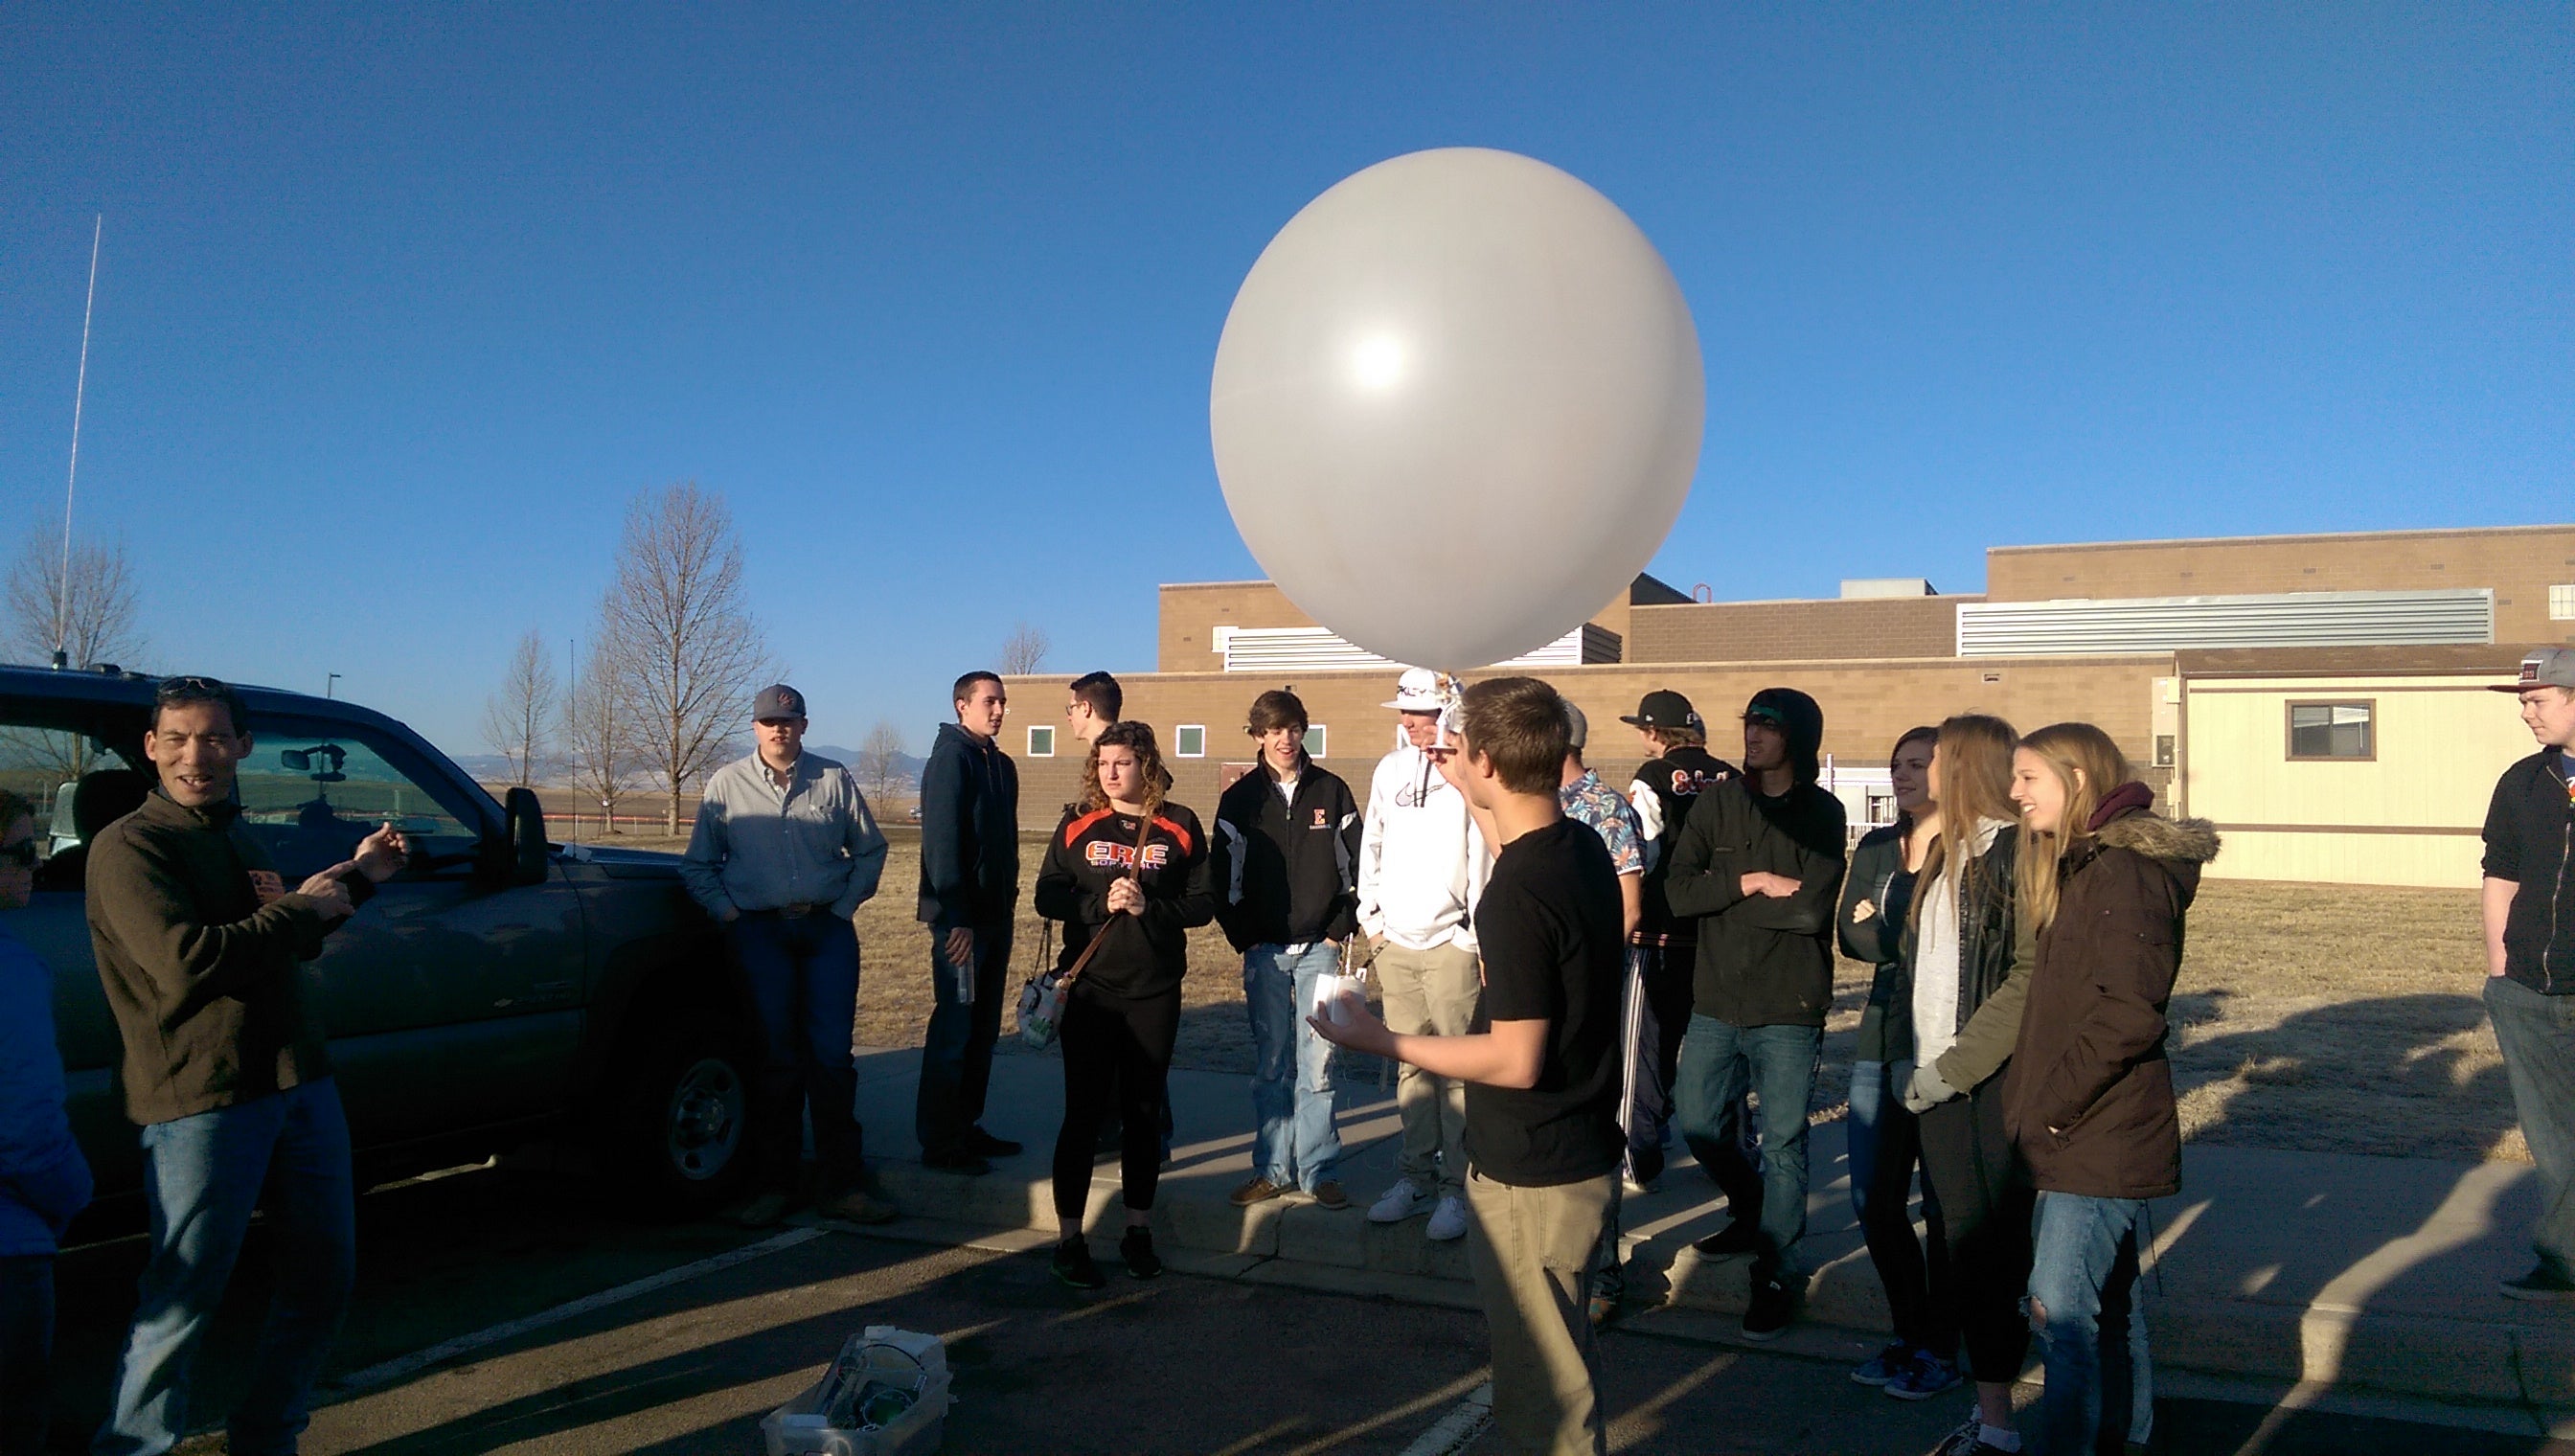
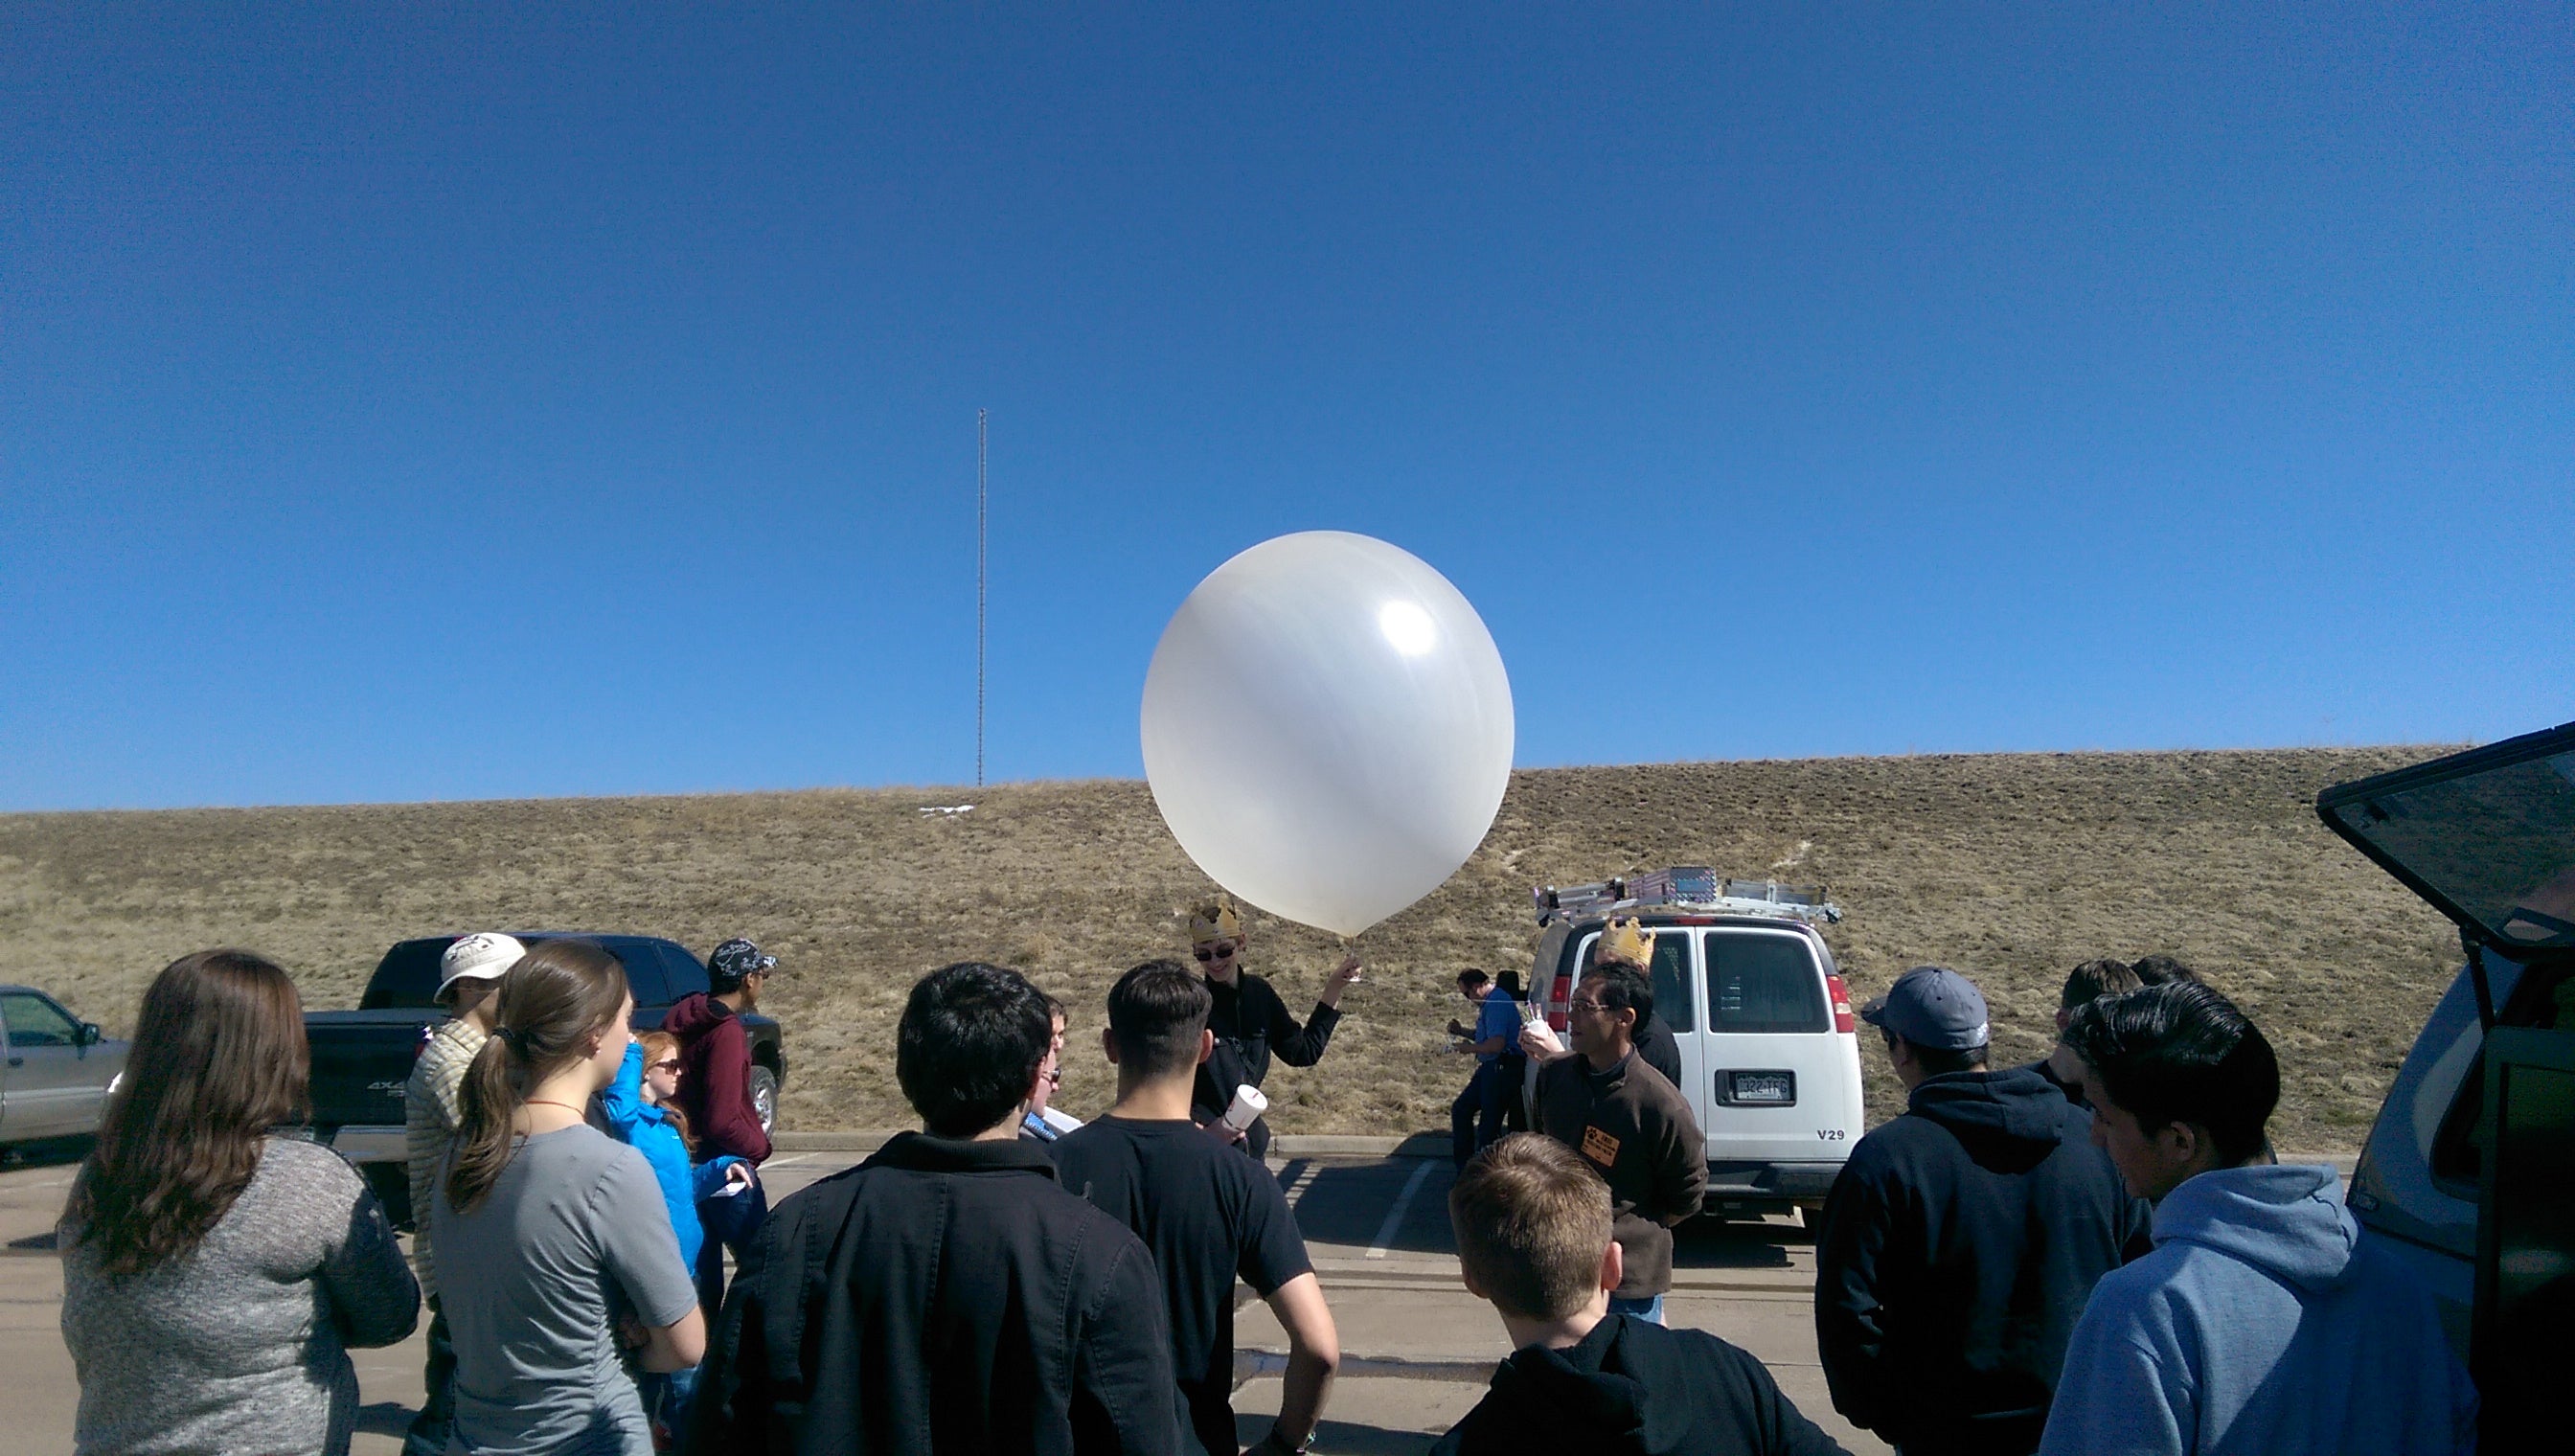
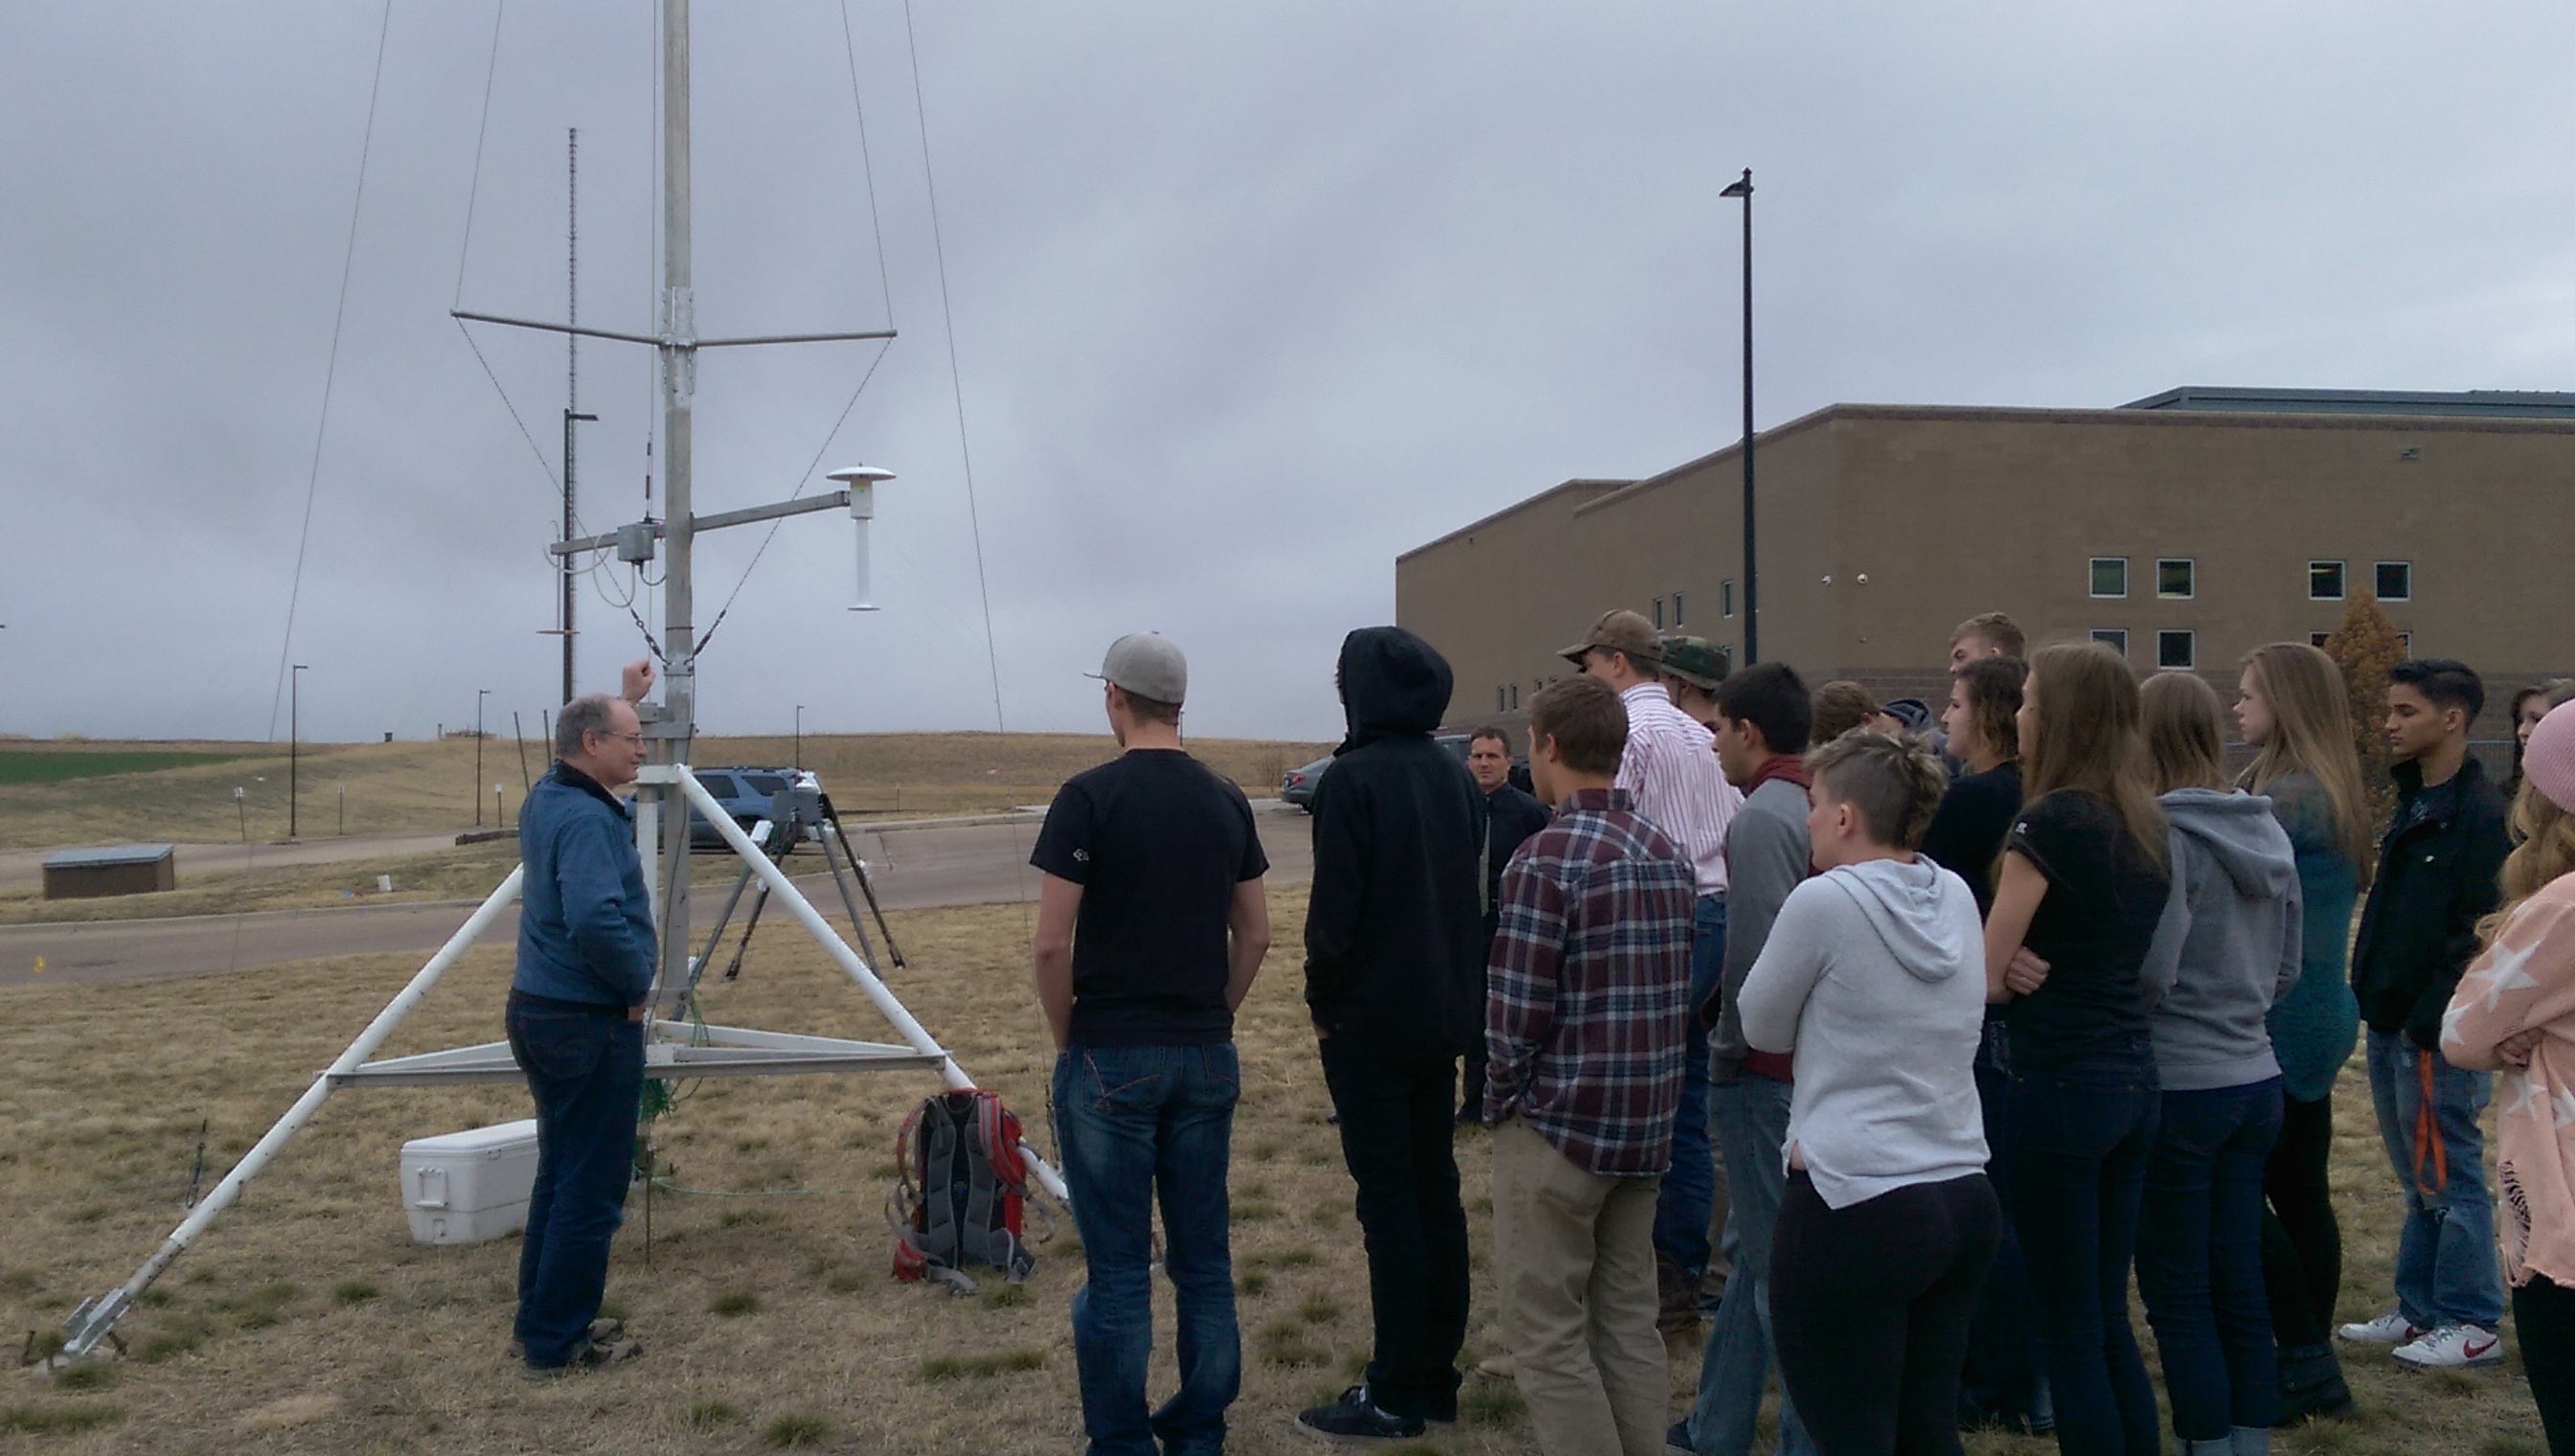
As we expected, launching radiosondes from Erie High School (EHS) inspired much enthusiasm and interest on the part of students (and staff and administrators) at the school. The CABL MGAUS truck visited EHS to launch two soundings. In the morning of 9 March, Prof. Lundquist, Mr. Tim Lim of NCAR, and several CU Boulder graduate students joined Mrs. Julie Mitchell’s 7:30 am Meteorology class for a sonde launch (Figure 1, Figure 2). We also joined Mrs. Holly Marcus’ afternoon environment Science class that afternoon (Figure 3); St. Vrain school district staff also joined that launch, bringing a quadcoptor with a video camera to record the launch. Approximately 50 students total interacted with CABL team members. As recommended by NCAR staff, Prof. Lundquist provided a short introduction to weather observations and the XPIA experiment before moving the class outside for the launch. Data from the launch were archived for use in subsequent class visits. Meteorological topics covered in the discussion included:
- inversions and why the morning inversion was much lower than the afternoon inversion, and
- similarities and differences between the wind profiles measured by the sounding and by the lidar systems and why those differences occur.
 |
 |
|
Figure 1: Tim Lim (NCAR) explaining the components of a radiosonde at EHS, 9 March 2015 (early morning launch).
|
Figure 2: EHS Meteorology student preparing to release morning sounding, 9 March 2015.
|
 |
||
|
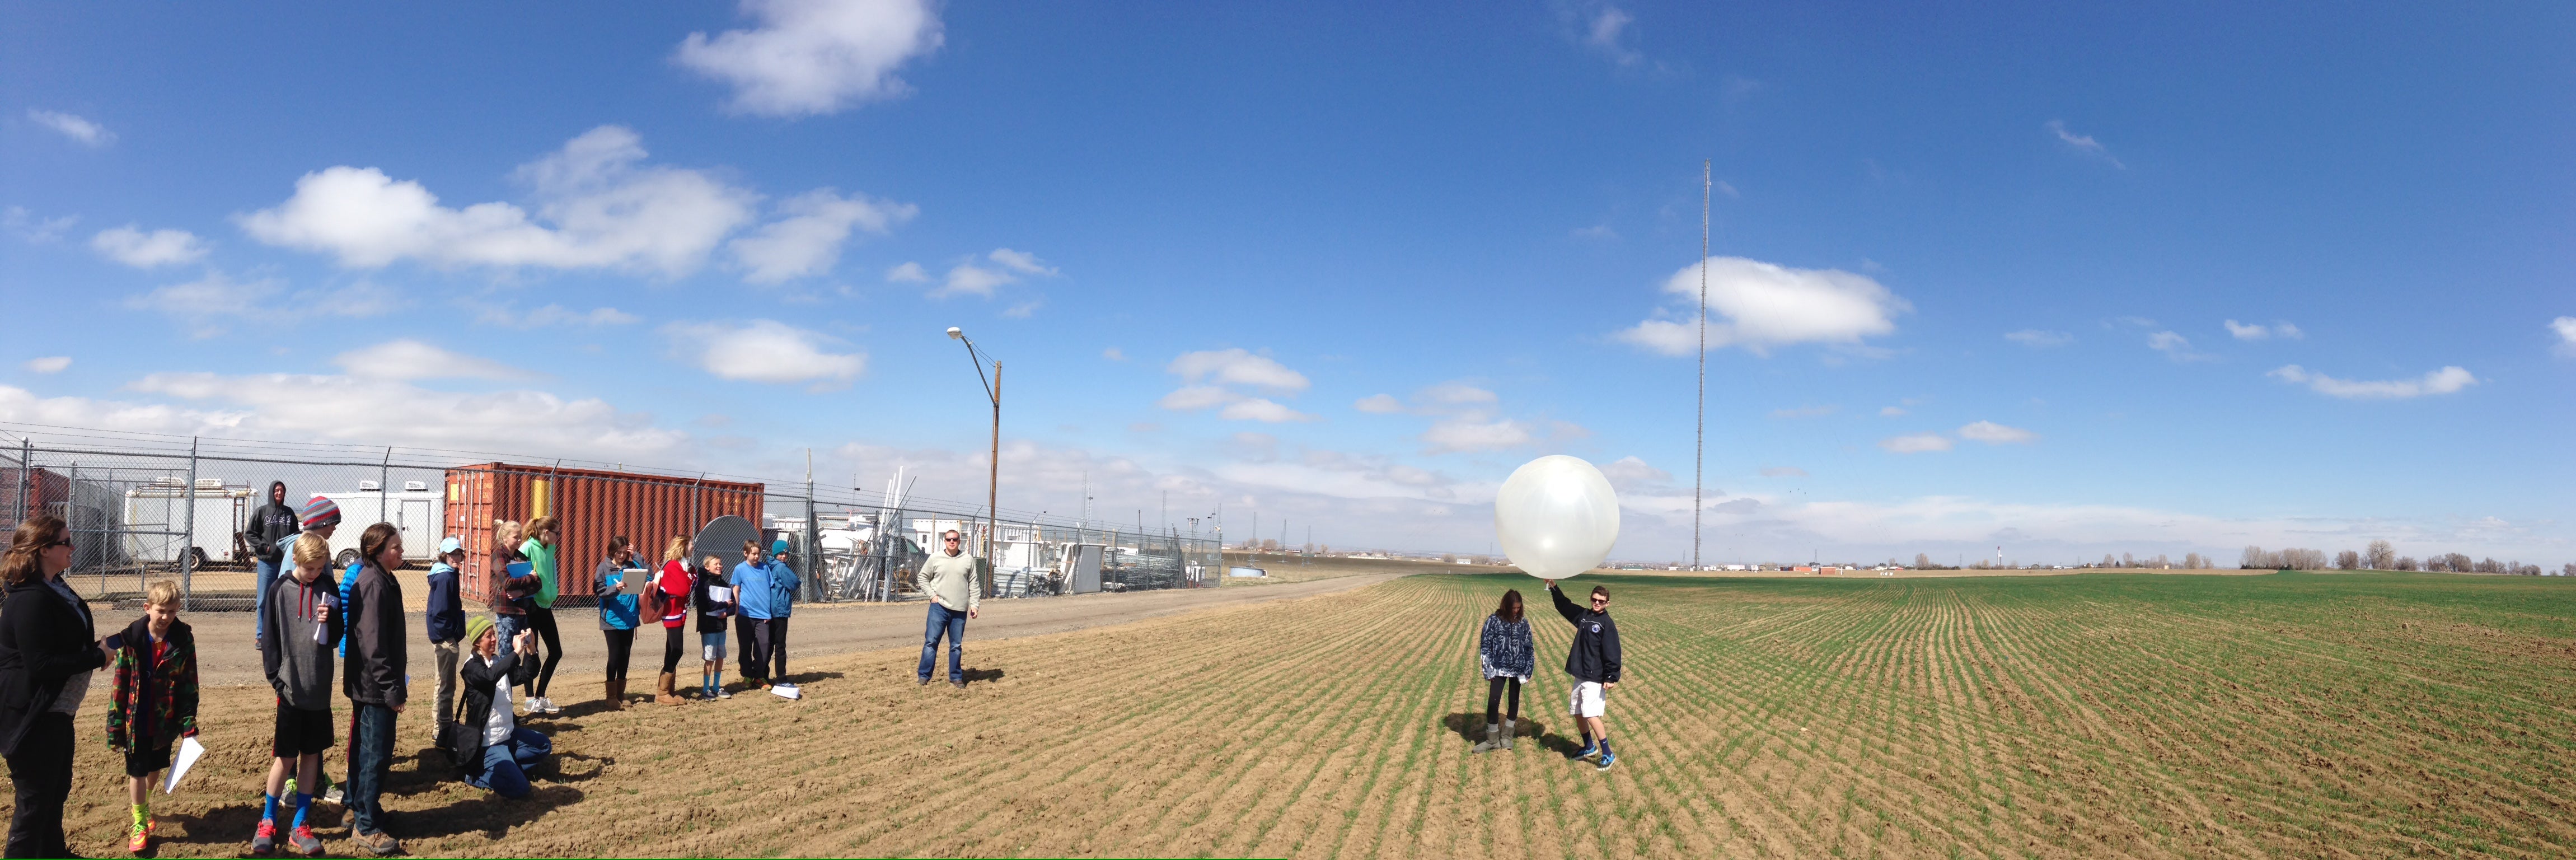
Figure 3: EHS Environmental Science student preparing to release the afternoon sounding, 9 March 2015. The 300-m Boulder Atmospheric Observatory tower can be seen to the left of the balloon in the background. The gentleman to the right of the student, leaning against the vehicle, was a pilot for the St. Vrain School District who brought a quadcopter with a camera in order to film the launch of the sonde for the school district website.
|
ISFS
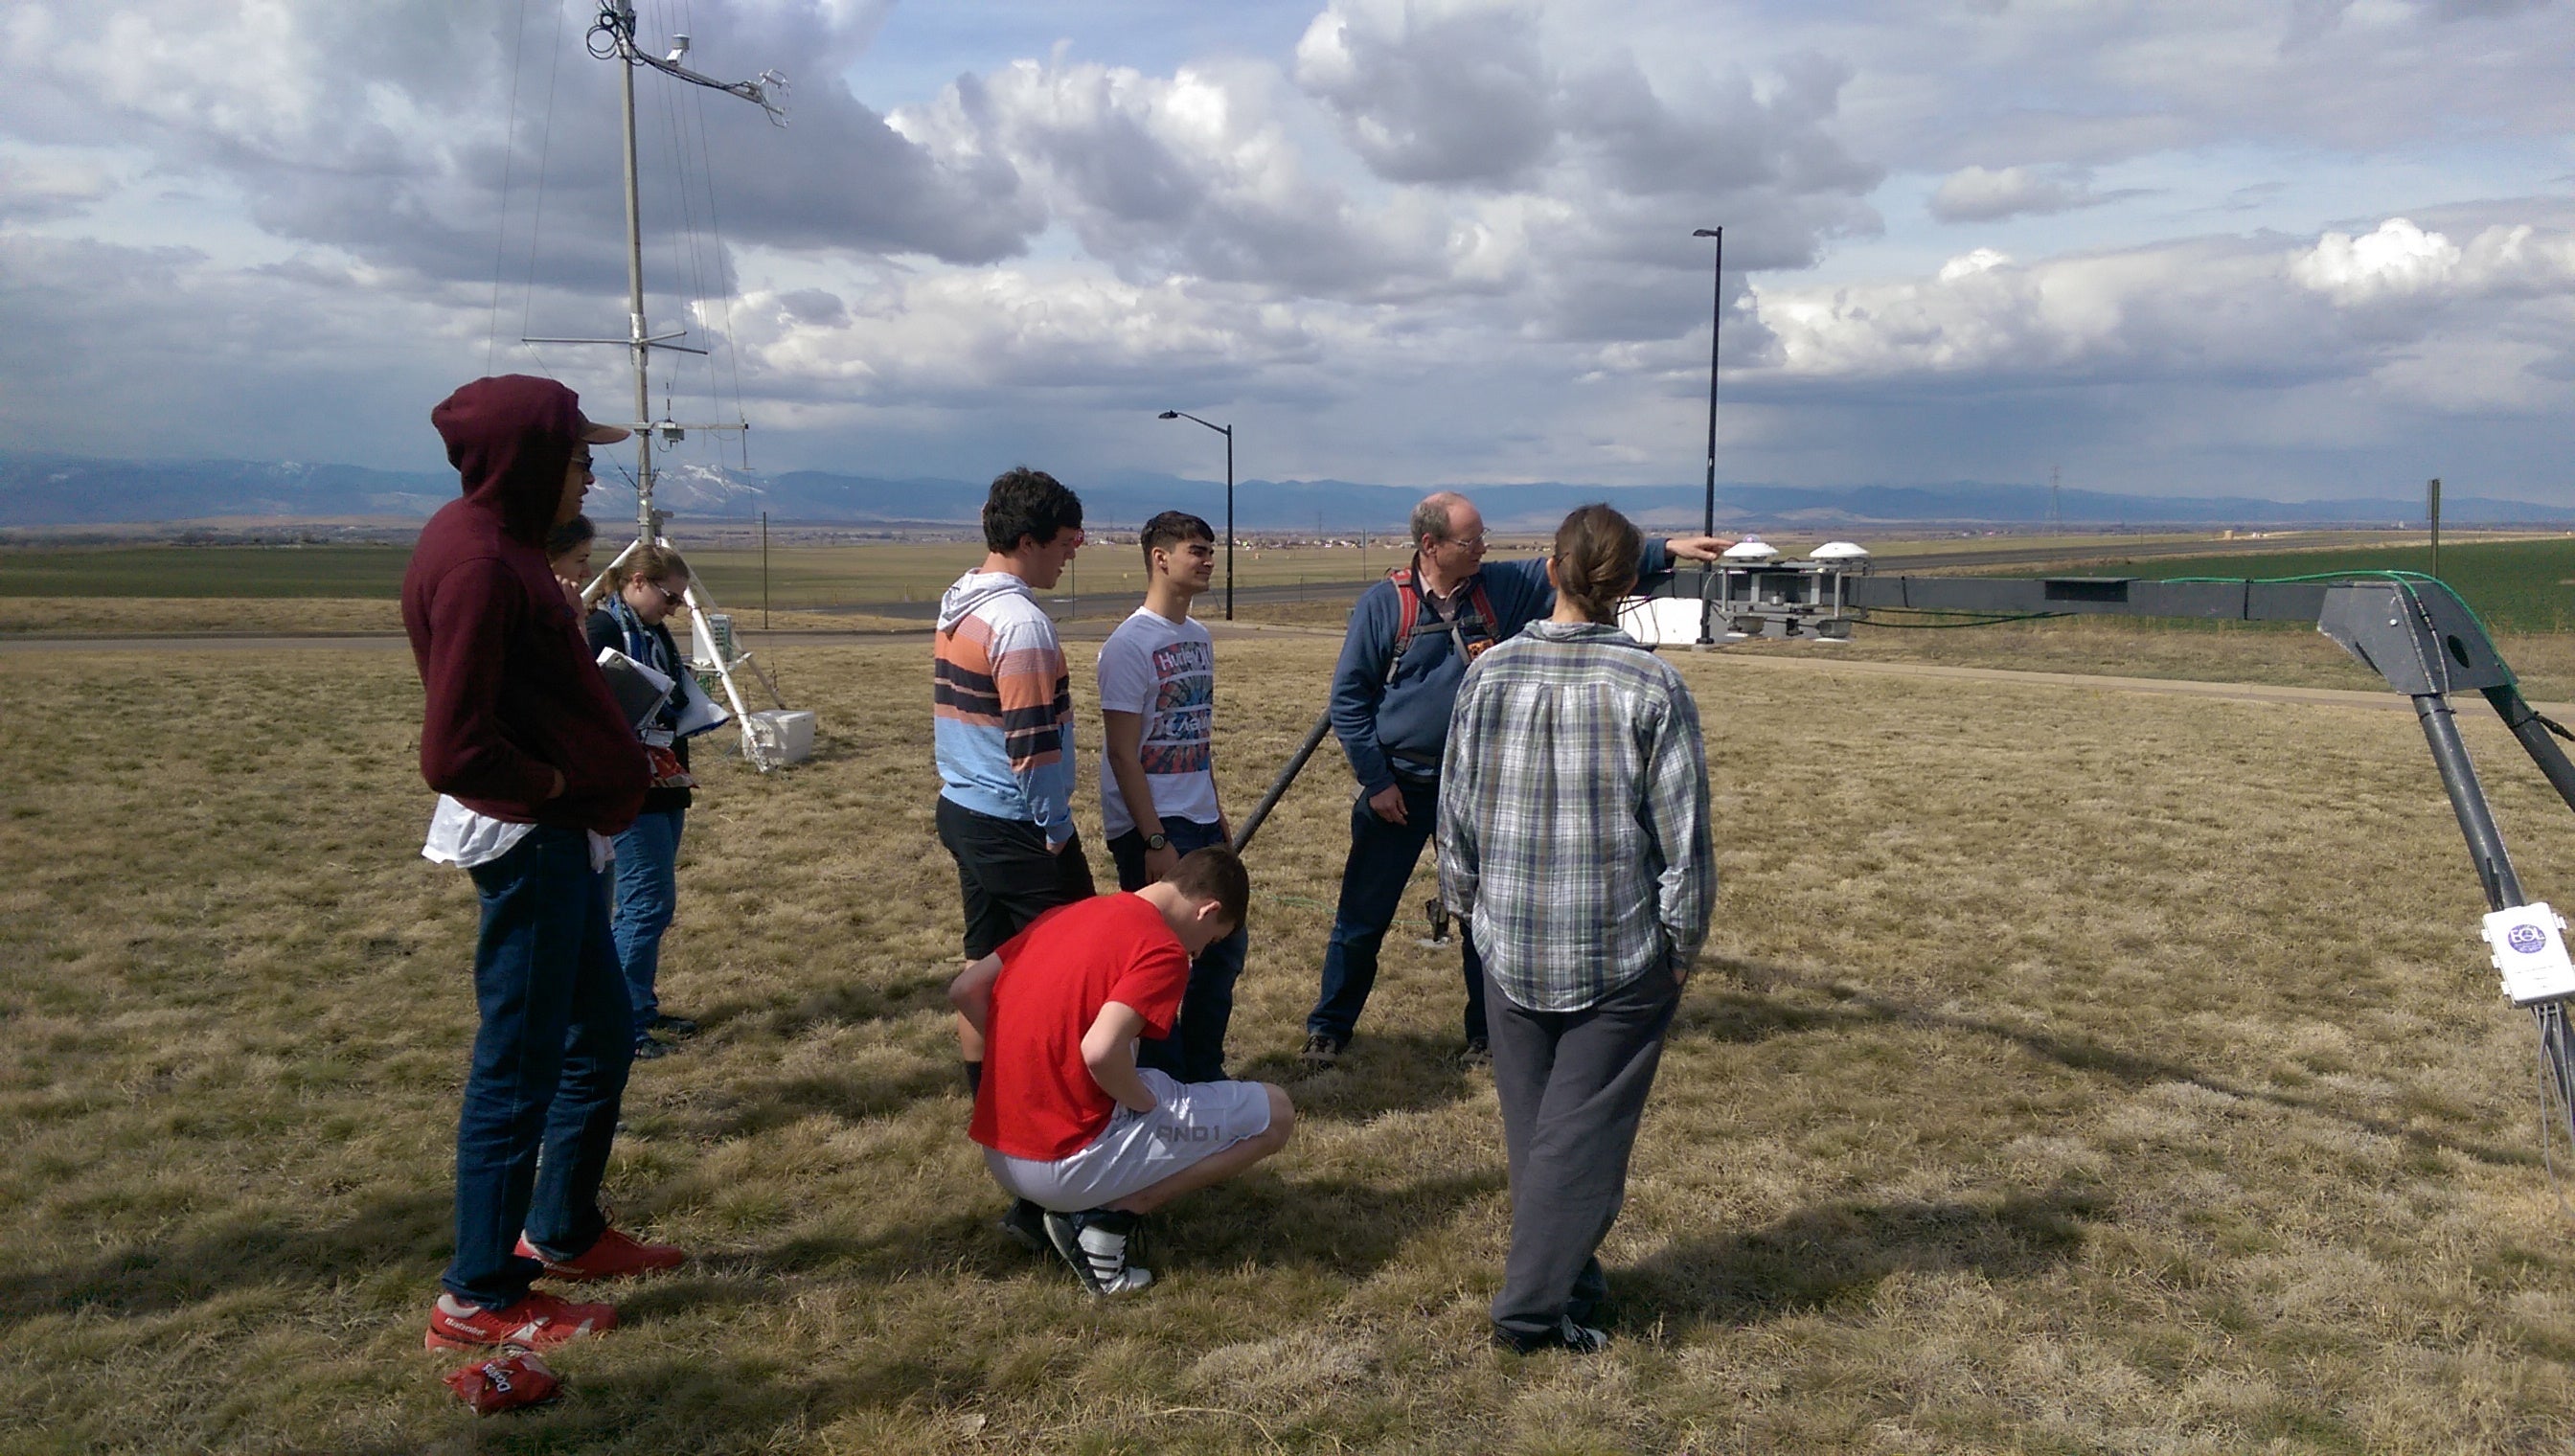
CABL also provided the opportunity to introduce Erie High School students to boundary-‐ layer meteorology through the presence of a surface flux station with radiation measurements directly north-‐northwest of their school. Considerable assistance with administrative matters and legal issues was provided by St. Vrain School District Assistant Superintendent of Operations Brian Lamer. Directly north-‐north-‐west of the school, EOL staff installed the equipment 9 March and withdrew the equipment on 20 April. Dr. Steve Oncley and Prof. Lundquist led class visits to Mrs. Julie Mitchell’s Meteorology (morning) and Mrs. Holly Marcus’ Environmental Science (afternoon) classes, including visits to the surface flux stations (Figure 4-‐Figure 6).
 |
||
|
Figure 4: Dr. Steven Oncley explaining the equipment on the 10 m surface flux station to Mrs. Julie Mitchell’s Meteorology class.
|
200S lidar
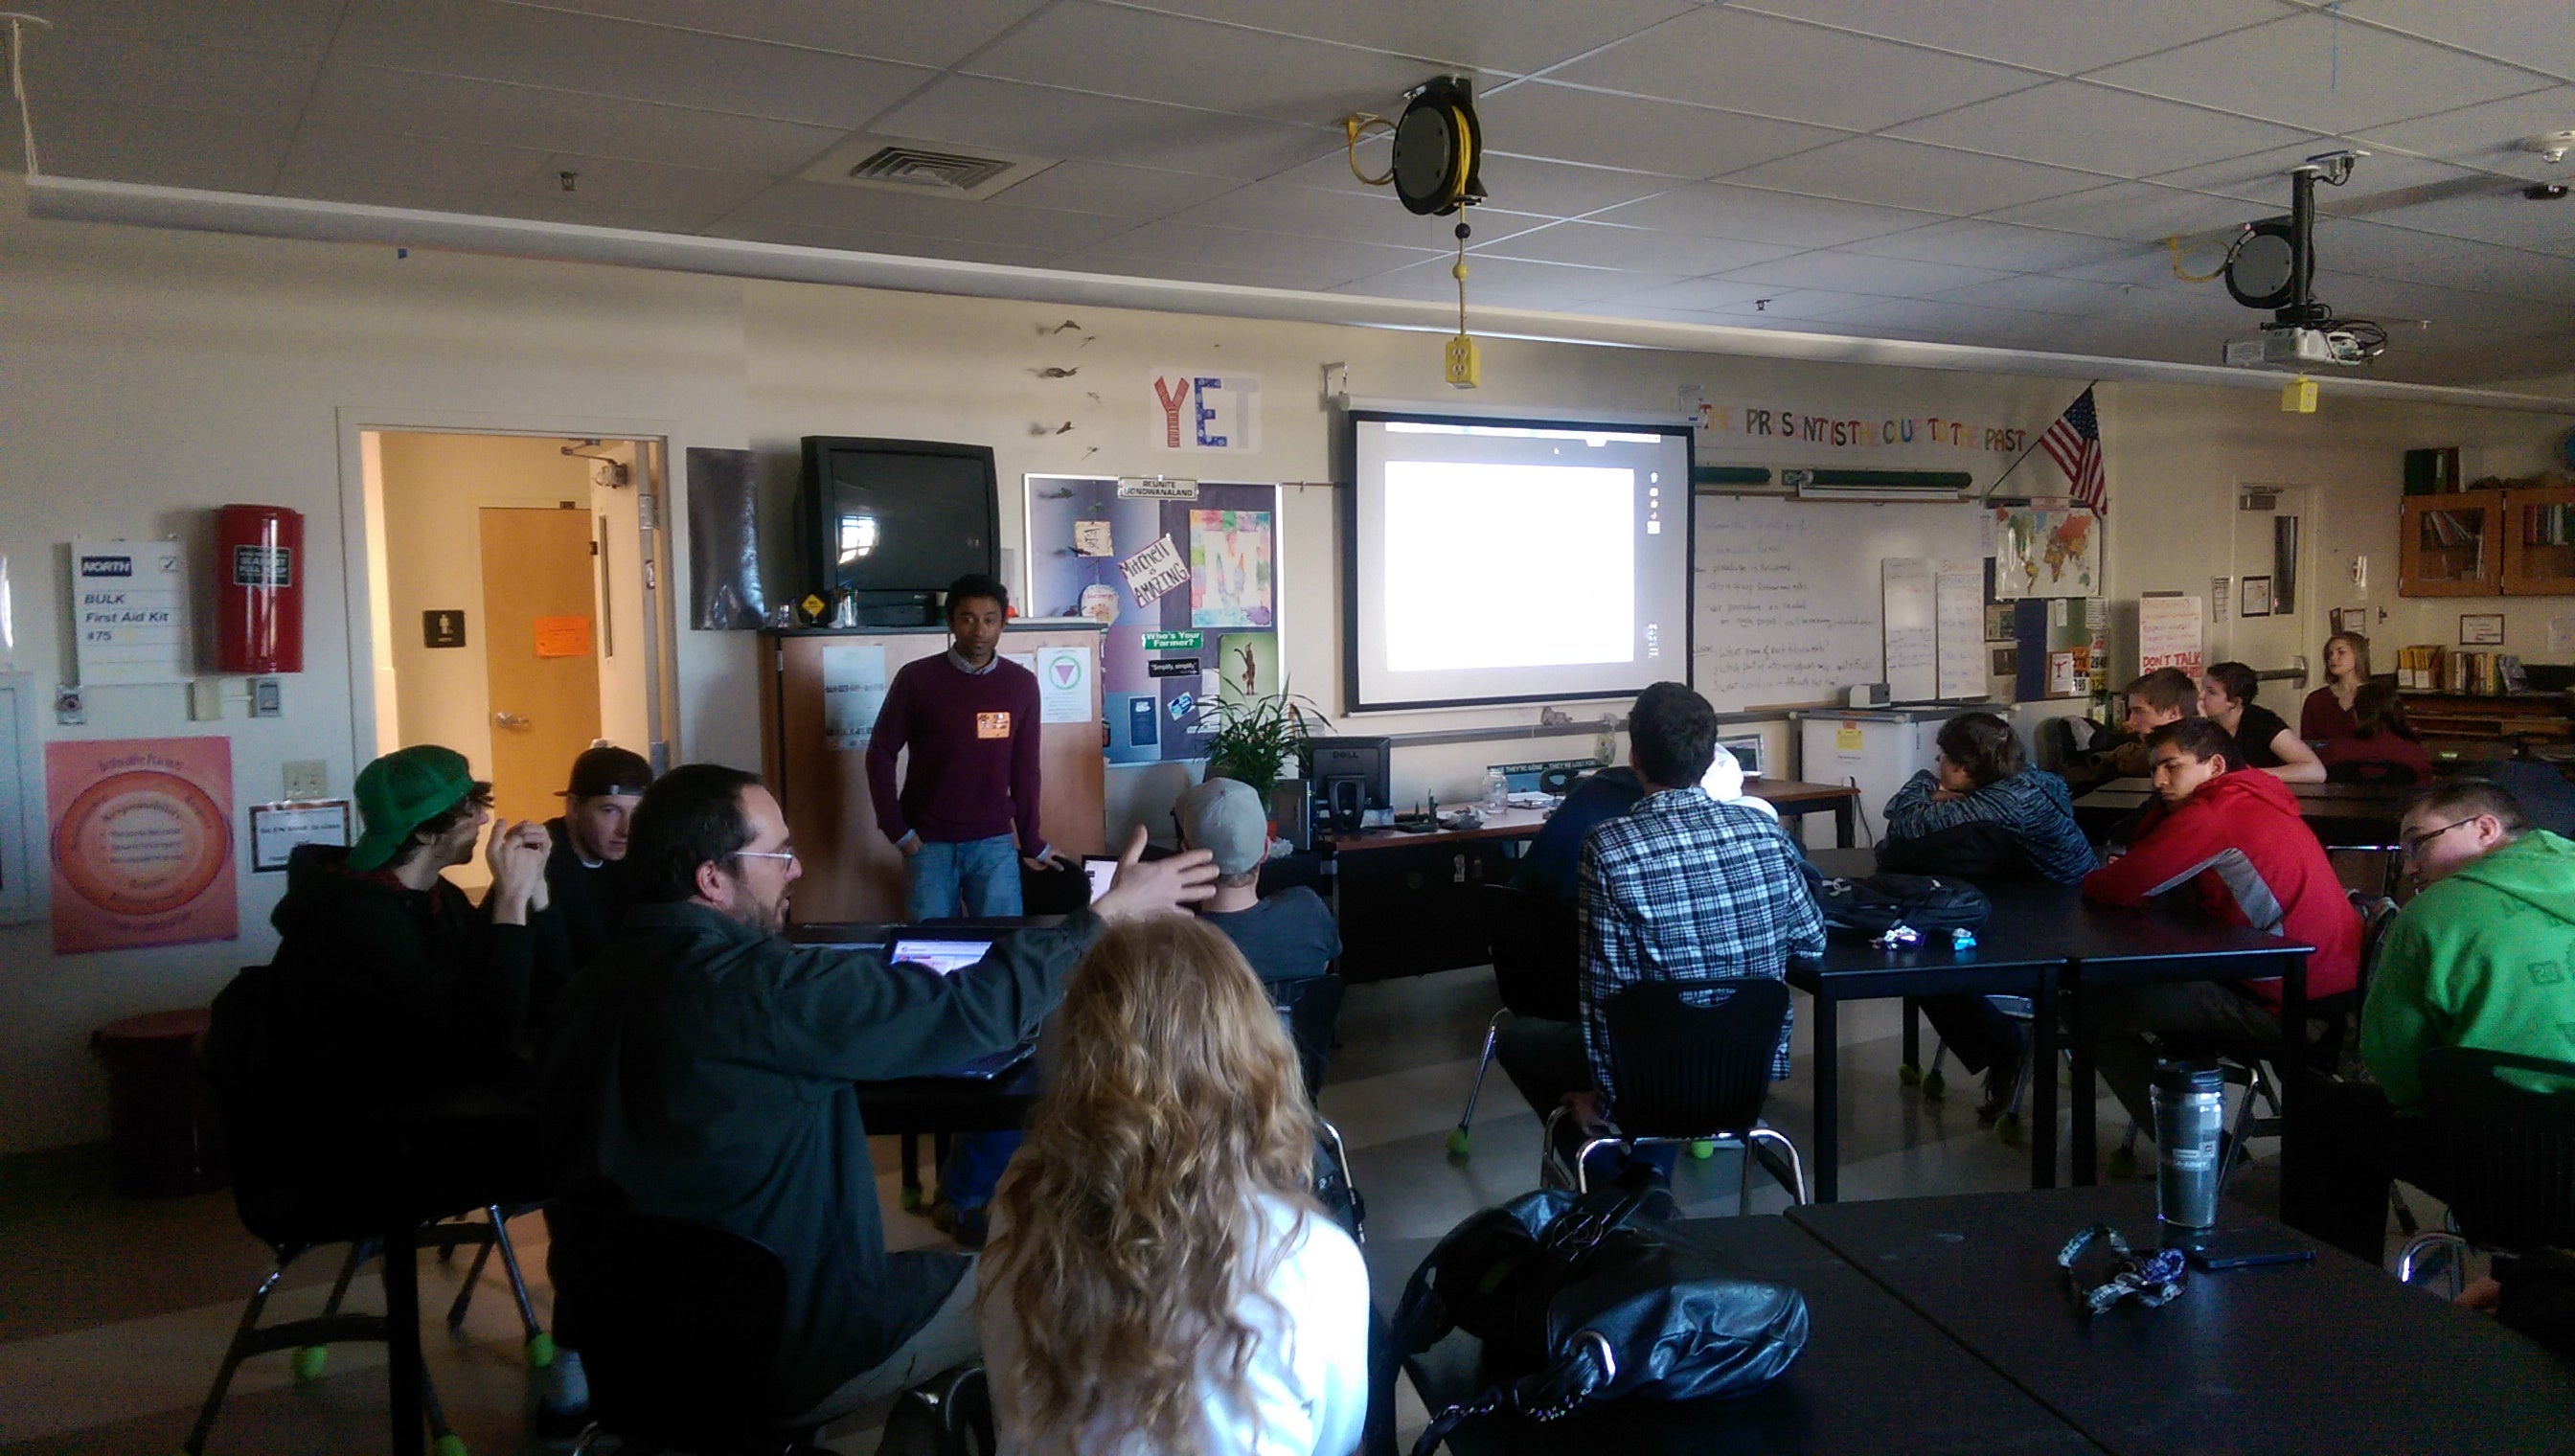
Although CABL did not directly support the deployment of NOAA’s WindCUBE 200S scanning lidar on the roof of EHS, data from the sounding launched on 9 March was used in-‐class on 11 March to compare to lidar measurements from that lidar and from the NOAA High Resolution Doppler Lidar deployed ~ 2 km away from EHS. (The NOAA deployments were supported by NOAA and XPIA.) Prof. Lundquist visited the Environmental Science and Meteorology classrooms with Drs. Alan Brewer and Aditya Choukulkar of NOAA’s Environmental Science Research Laboratory (ESRL) to provide a brief overview of lidars and how they work. This visit provided the students with an opportunity to work with the MGAUS data collected two days previously. We prepared an exercise for the class in which they used Microsoft Excel to looked at the wind measurements from their sounding, and compared those measurements to the wind measurements from the lidar at the same time. One “lesson learned” from this experience is to ensure that “lecture time” is no longer than ten minutes for this age group. Further, the morning class needed to integrate the sounding and the lidar datafiles together, which was challenging for some students. In the afternoon class, we integrated the files together before the students accessed them, which saved considerable time and allowed the students to clearly identify jet structures in the winds and the associate of jets with inversions (using the morning 9 March soundings). This class visit also afforded an opportunity to interact with the NCAR-‐provided datastreams from the 300-‐m BAO tower, which one of the teachers used in a subsequent class on her own.
 |
 |
|
Figure 5: Steve Oncley explaining the range of meteorological instrumentation on a surface flux station to Mrs. Mitchell's Meteorology class on the morning of 13 March 2015.
|
Figure 6: Steve Oncley explaining surface radiation measurements to Mrs. Marcus' Environmental Science class, afternoon 13 March 2015.
|
 |
|
|
Figure 7: EHS Environmental Science students ask lidar questions of Dr. Aditya Choukulkar (CIRES/NOAA, standing in red sweater at front) and Dr. Alan Brewer (front left gesturing with hands) on 11 March 2015.
|
CU-Boulder
Undergraduate and graduate students at CU benefitted enormously from the EOL resources deployed through CABL. Graduate students participated in the deployment of one of the ISFS stations at the BAO, learning more about instrumentation and field deployment issues in one morning than could probably be taught in a classroom in several weeks. Graduate and undergraduate students were also trained on launching soundings, and a group of graduate students had primary responsibility for sonde launching for several weeks of CABL. Finally, the CABL equipment deployed on the 300-‐ m BAO tower, as well as the real-‐time and interactive web interface to access those data, enabled the tower data to be used in undergraduate and graduate classes at CU.
ISFS station
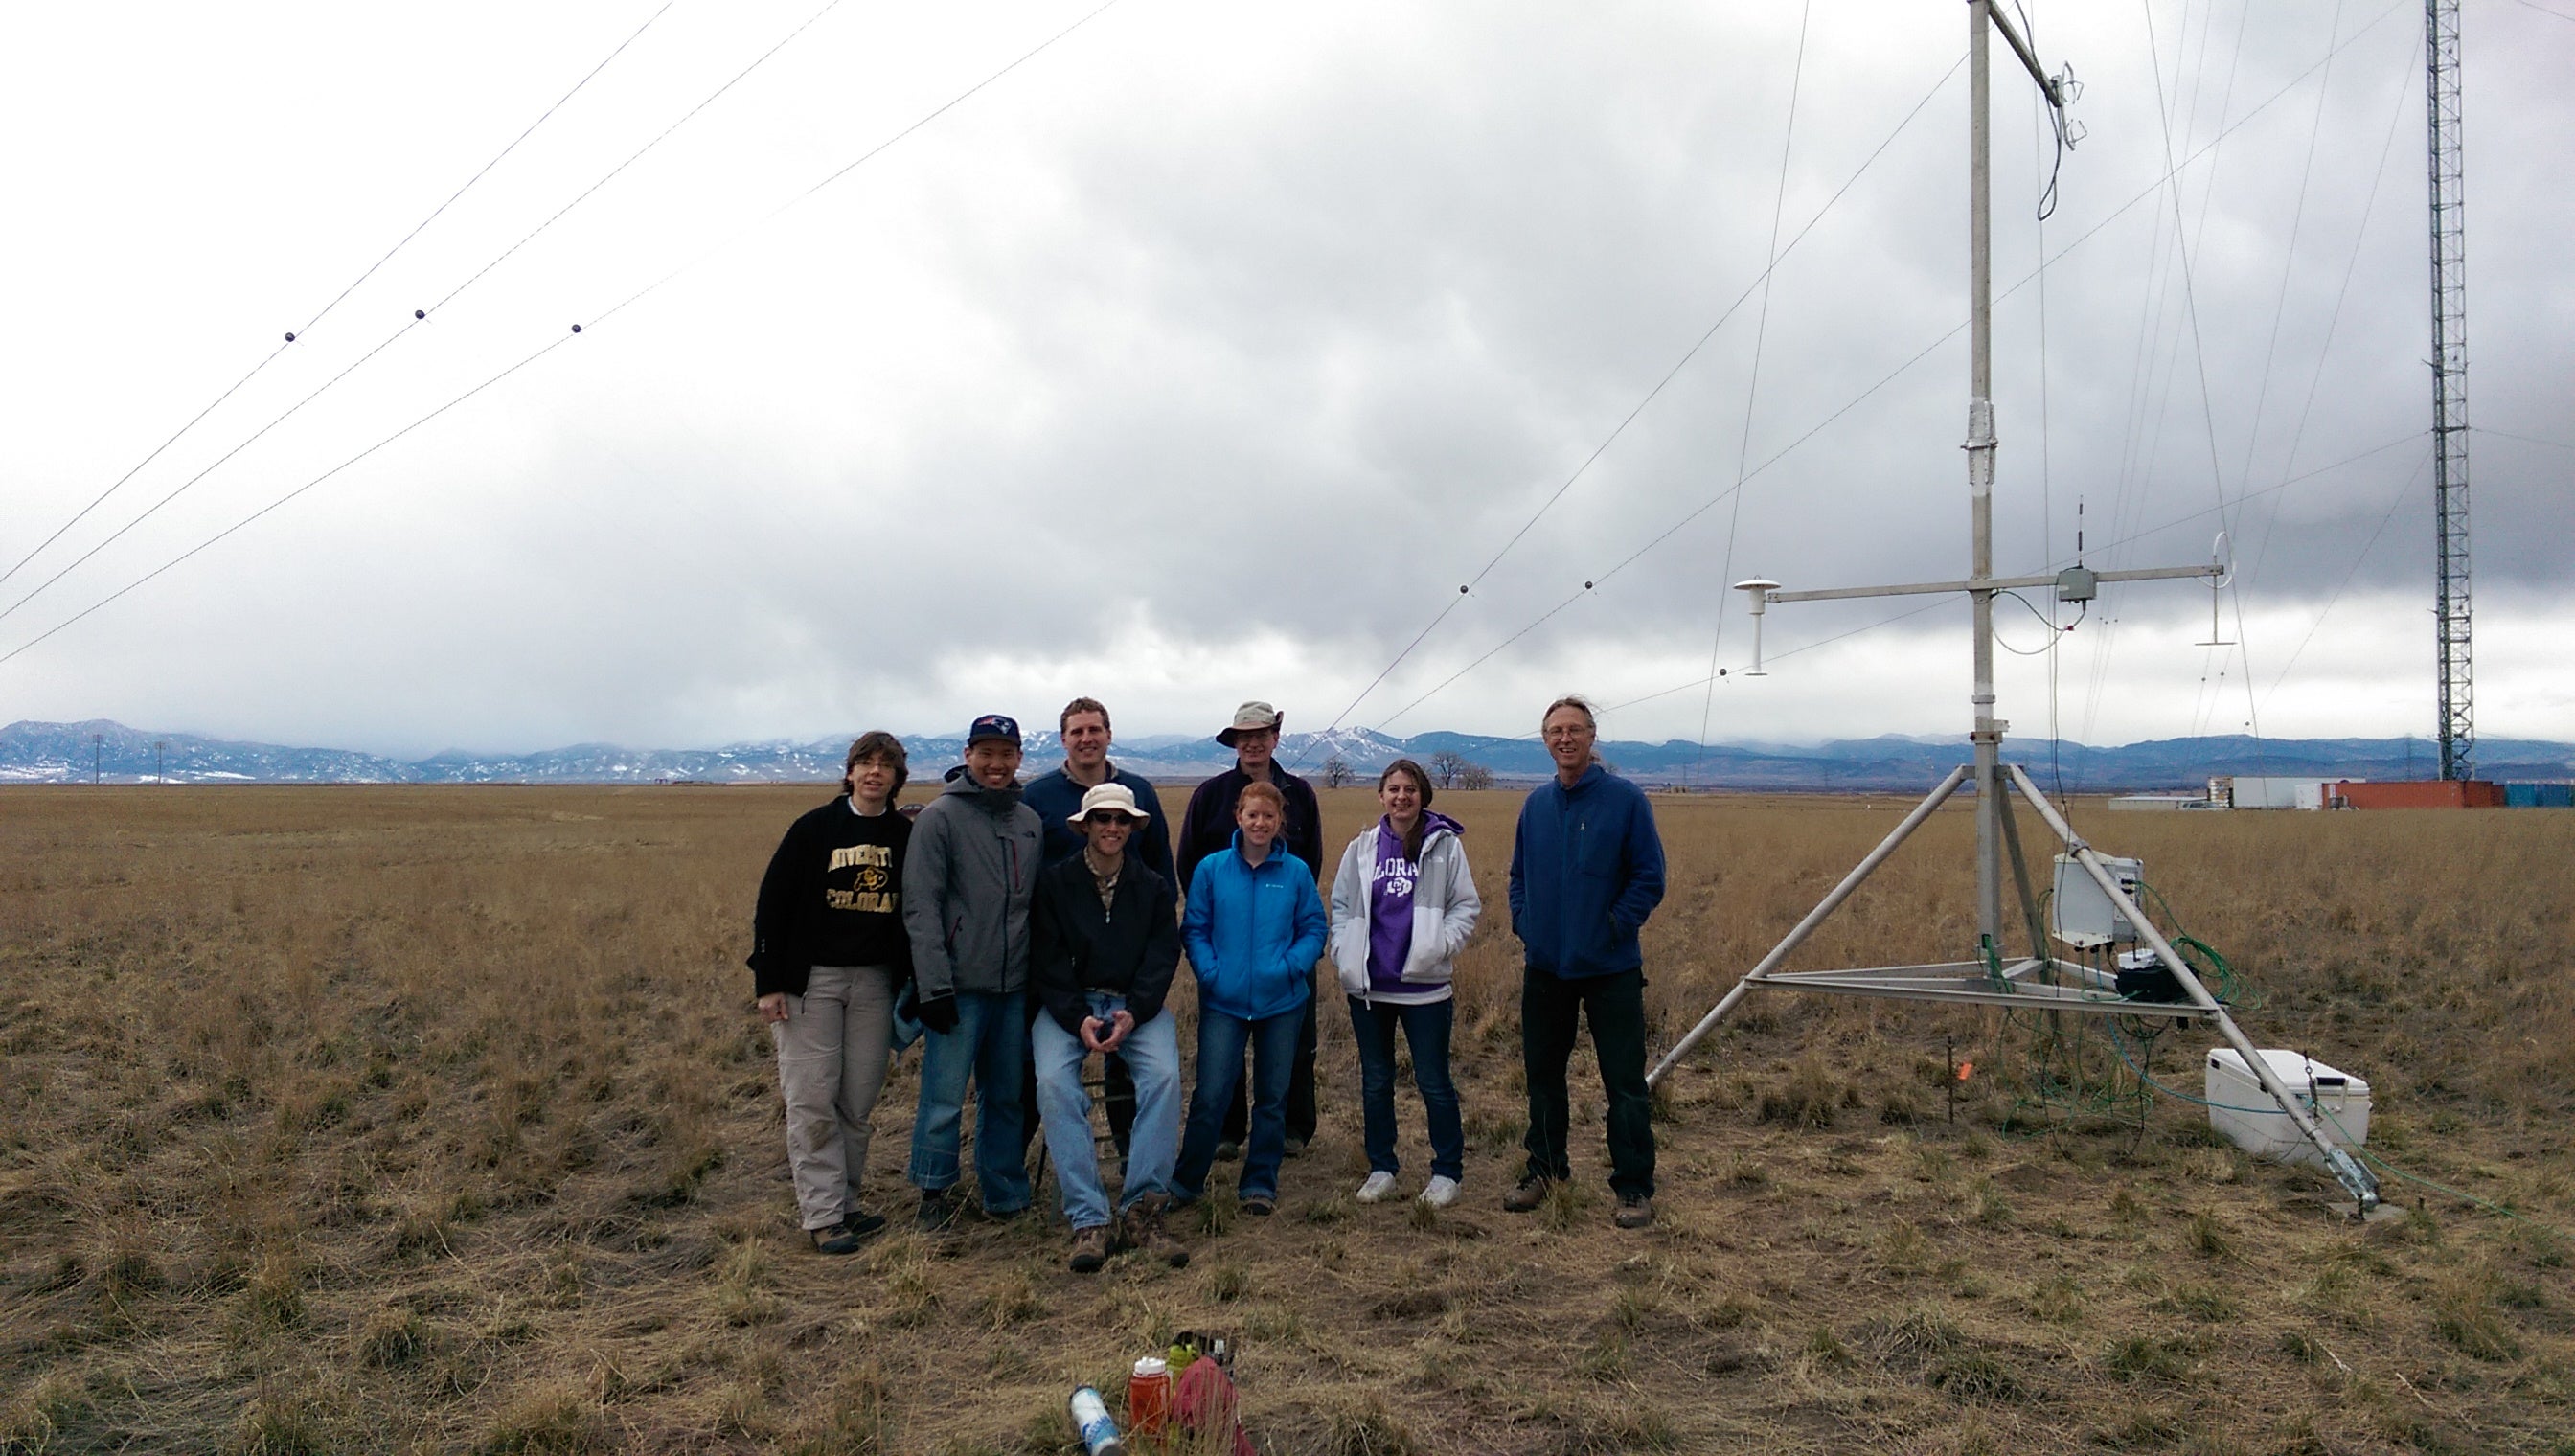
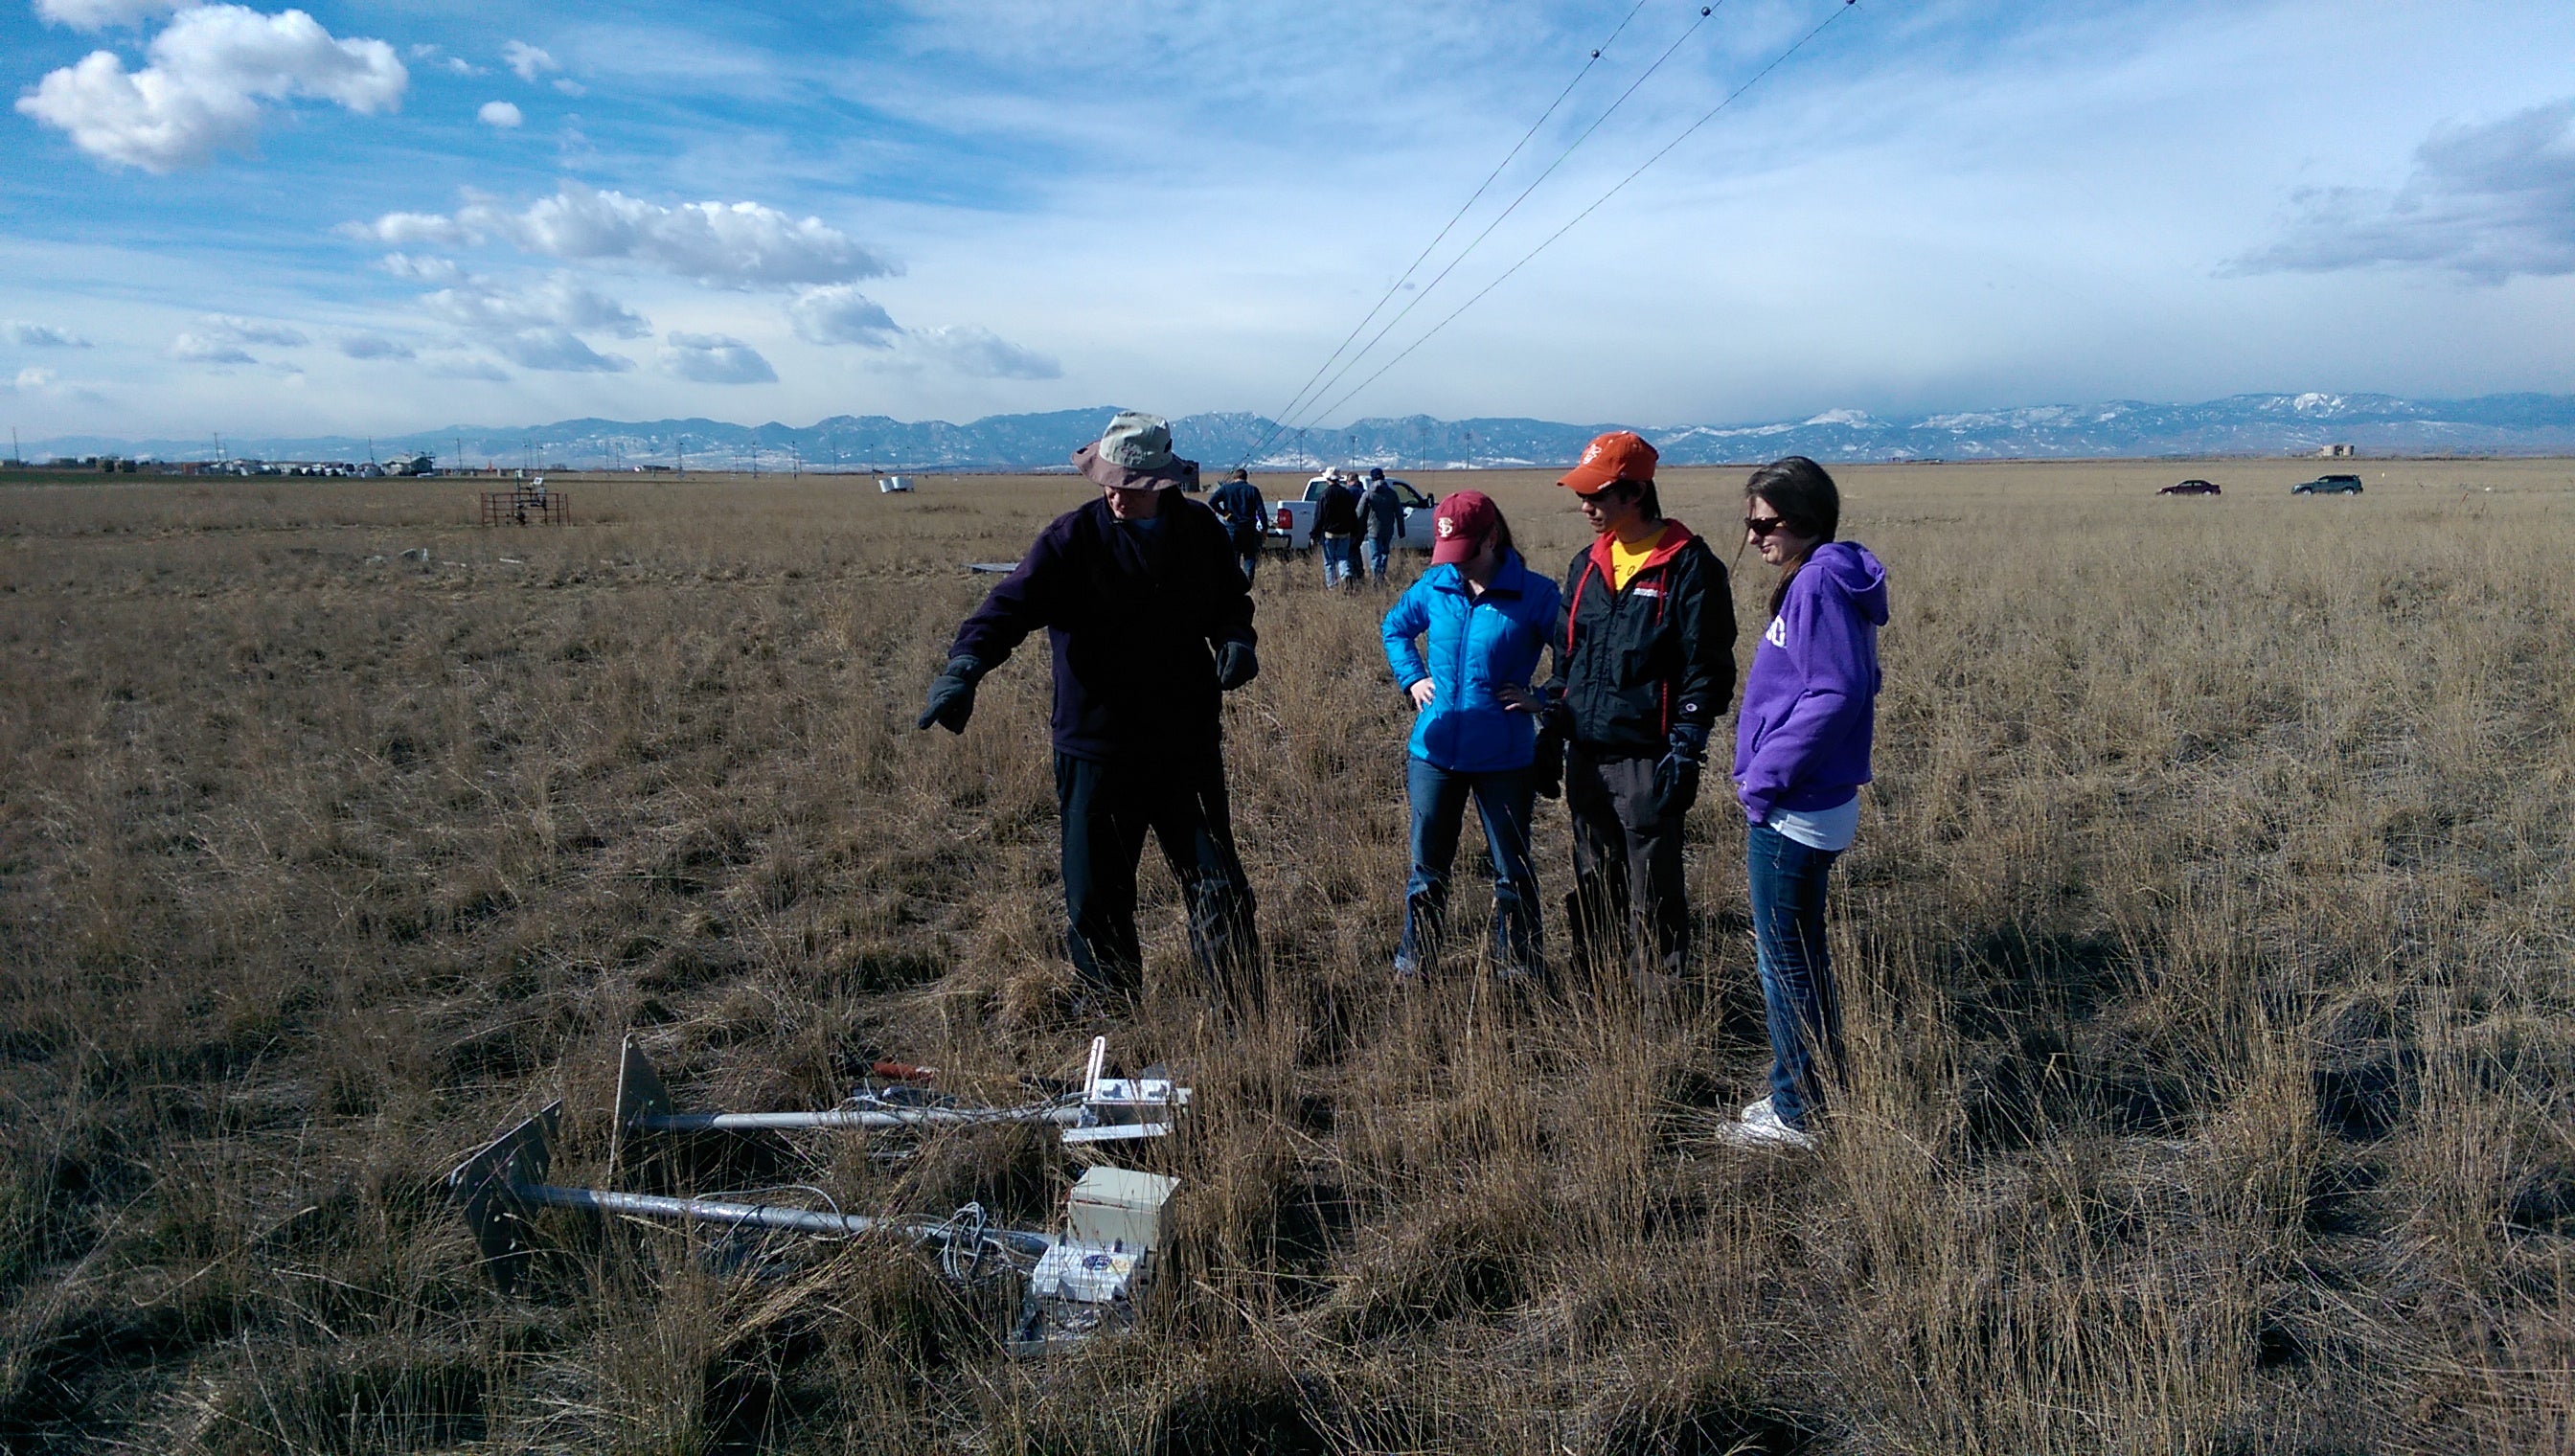
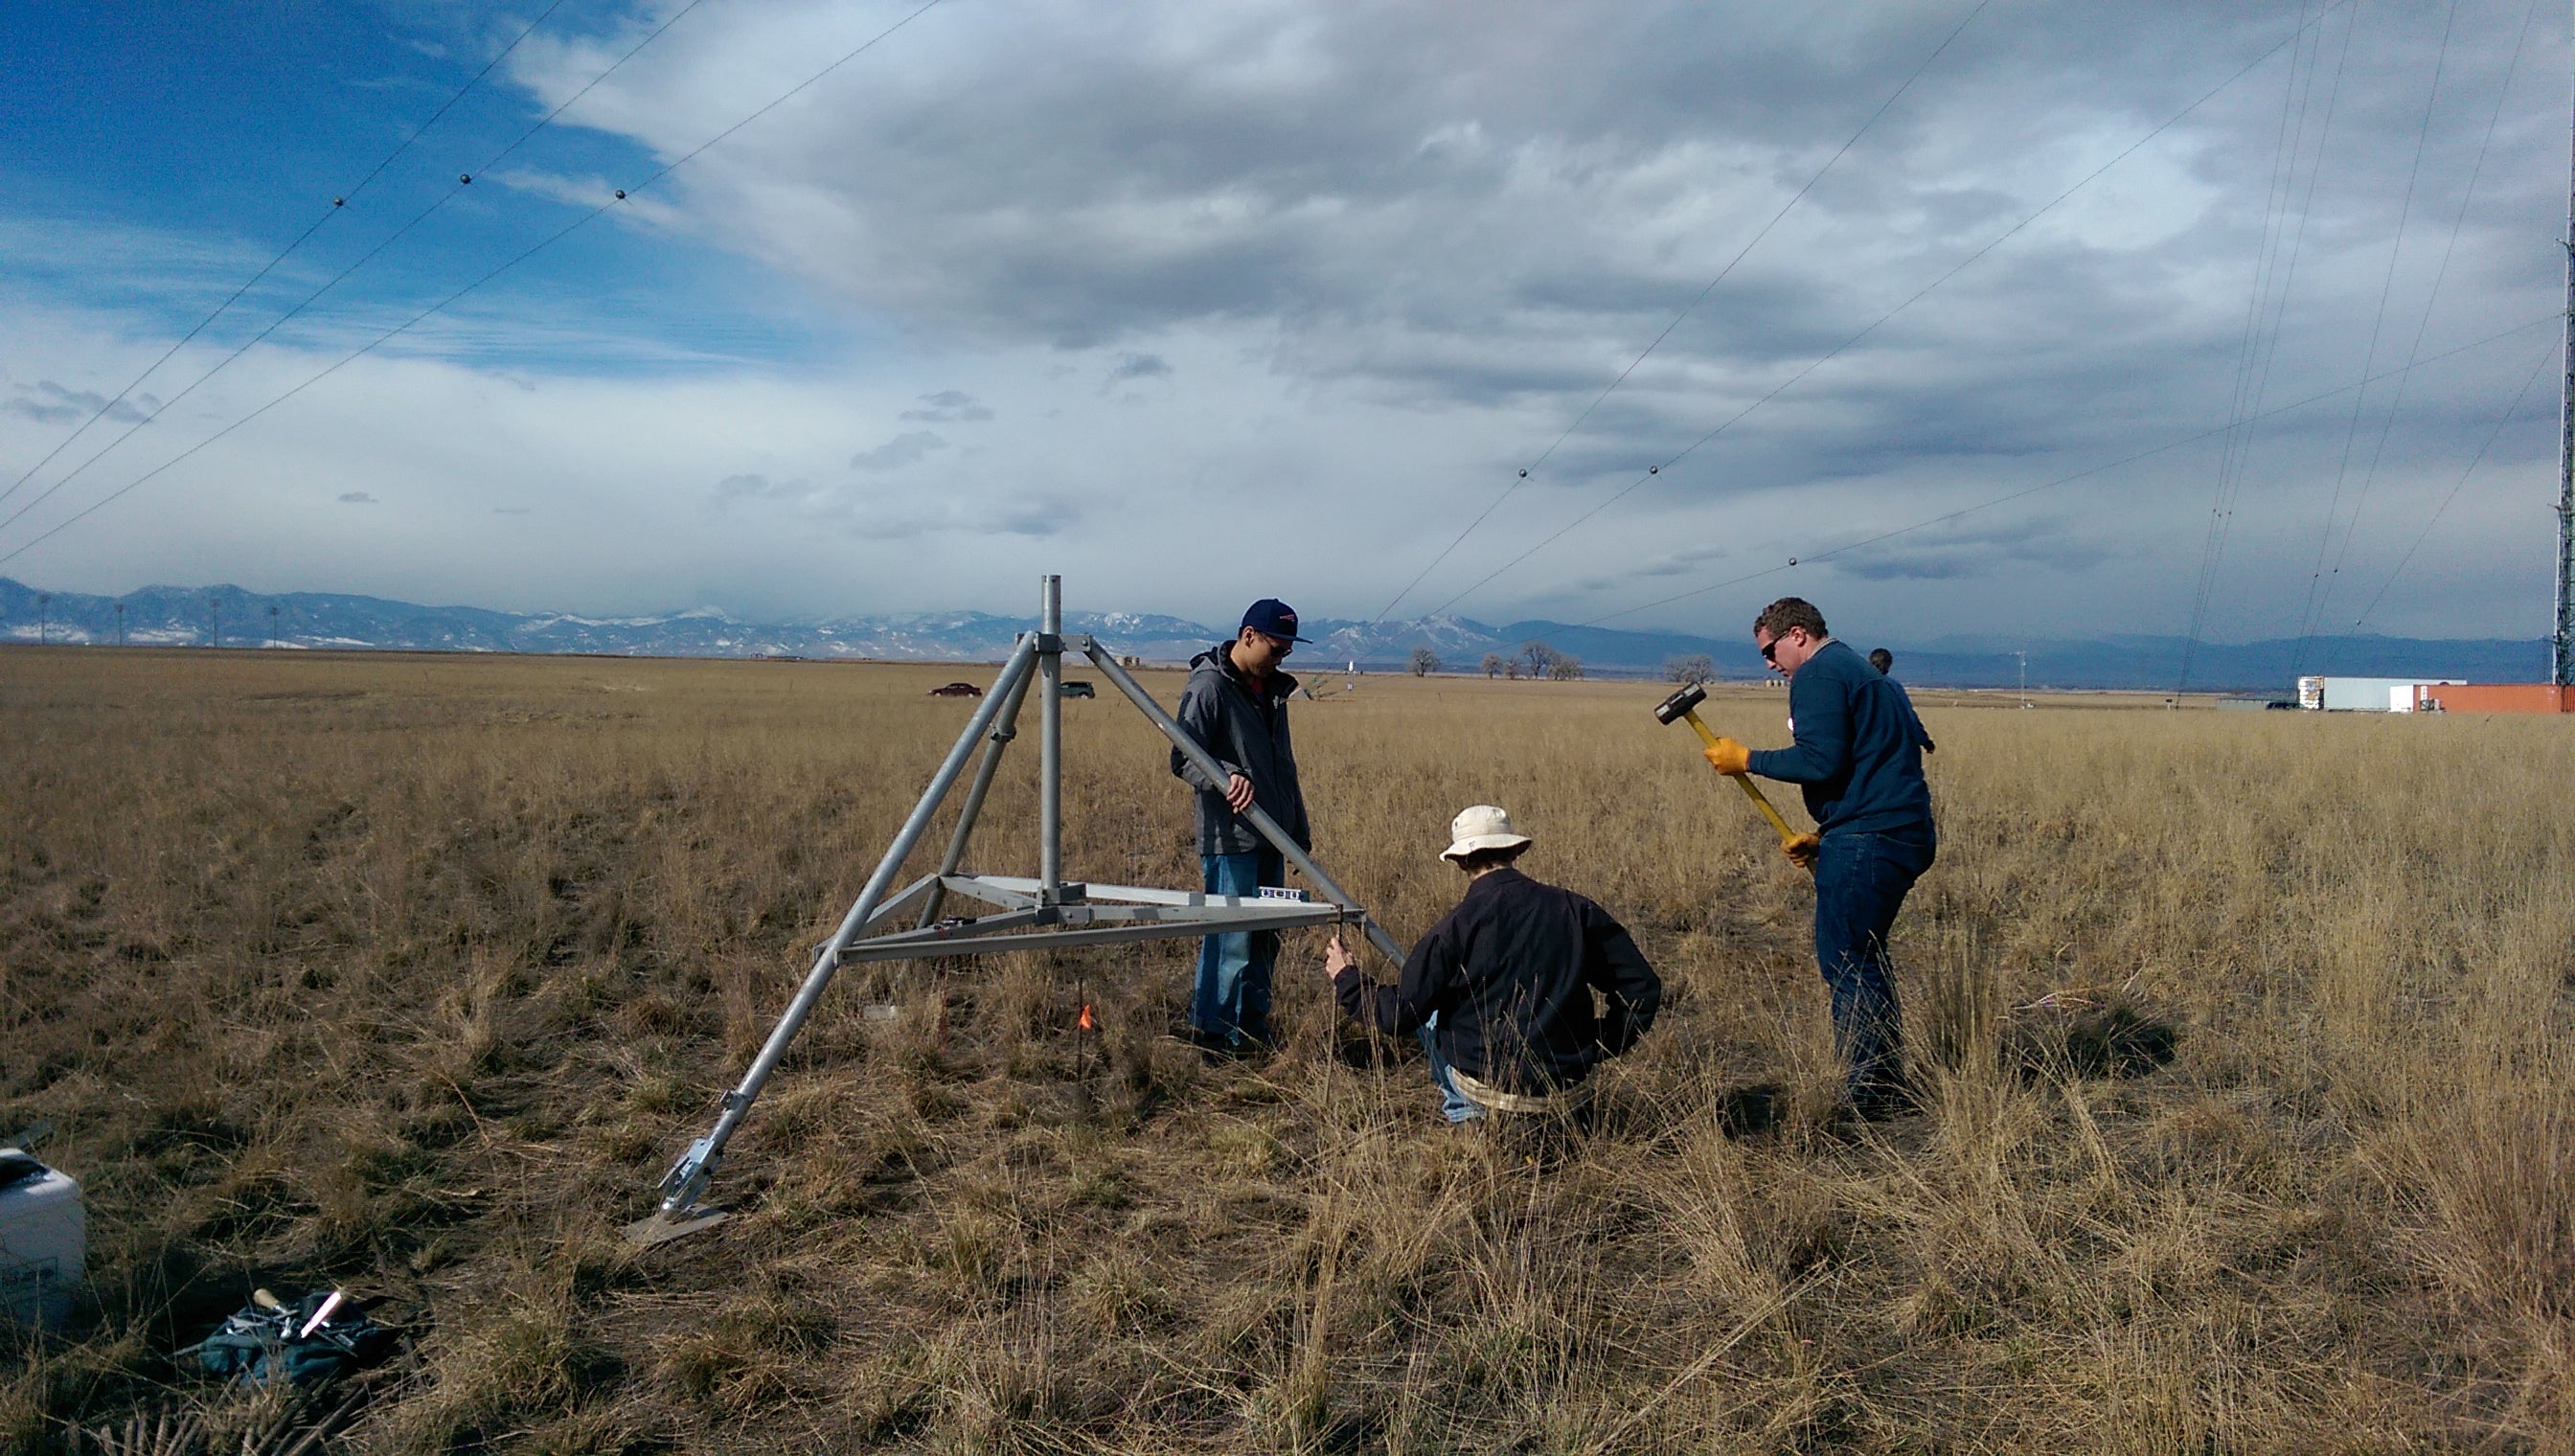
On 20 February 2015, six CU graduate students in Atmospheric and Oceanic Sciences met Dr. Steve Oncley and Mr. Kurt Knudson at the BAO to prepare for the installation of an ISFS station southeast of the main BAO tower. Dividing up into “soil moisture / radiation” and “meteorological station” groups (Figure 8-‐Figure 12), the students helped deploy the instruments while learning about considerations for field deployments.
 |
 |
|
Figure 8: Steve Oncley explaining some of the component of the soon-‐to-‐be-‐installed ISFS.
|
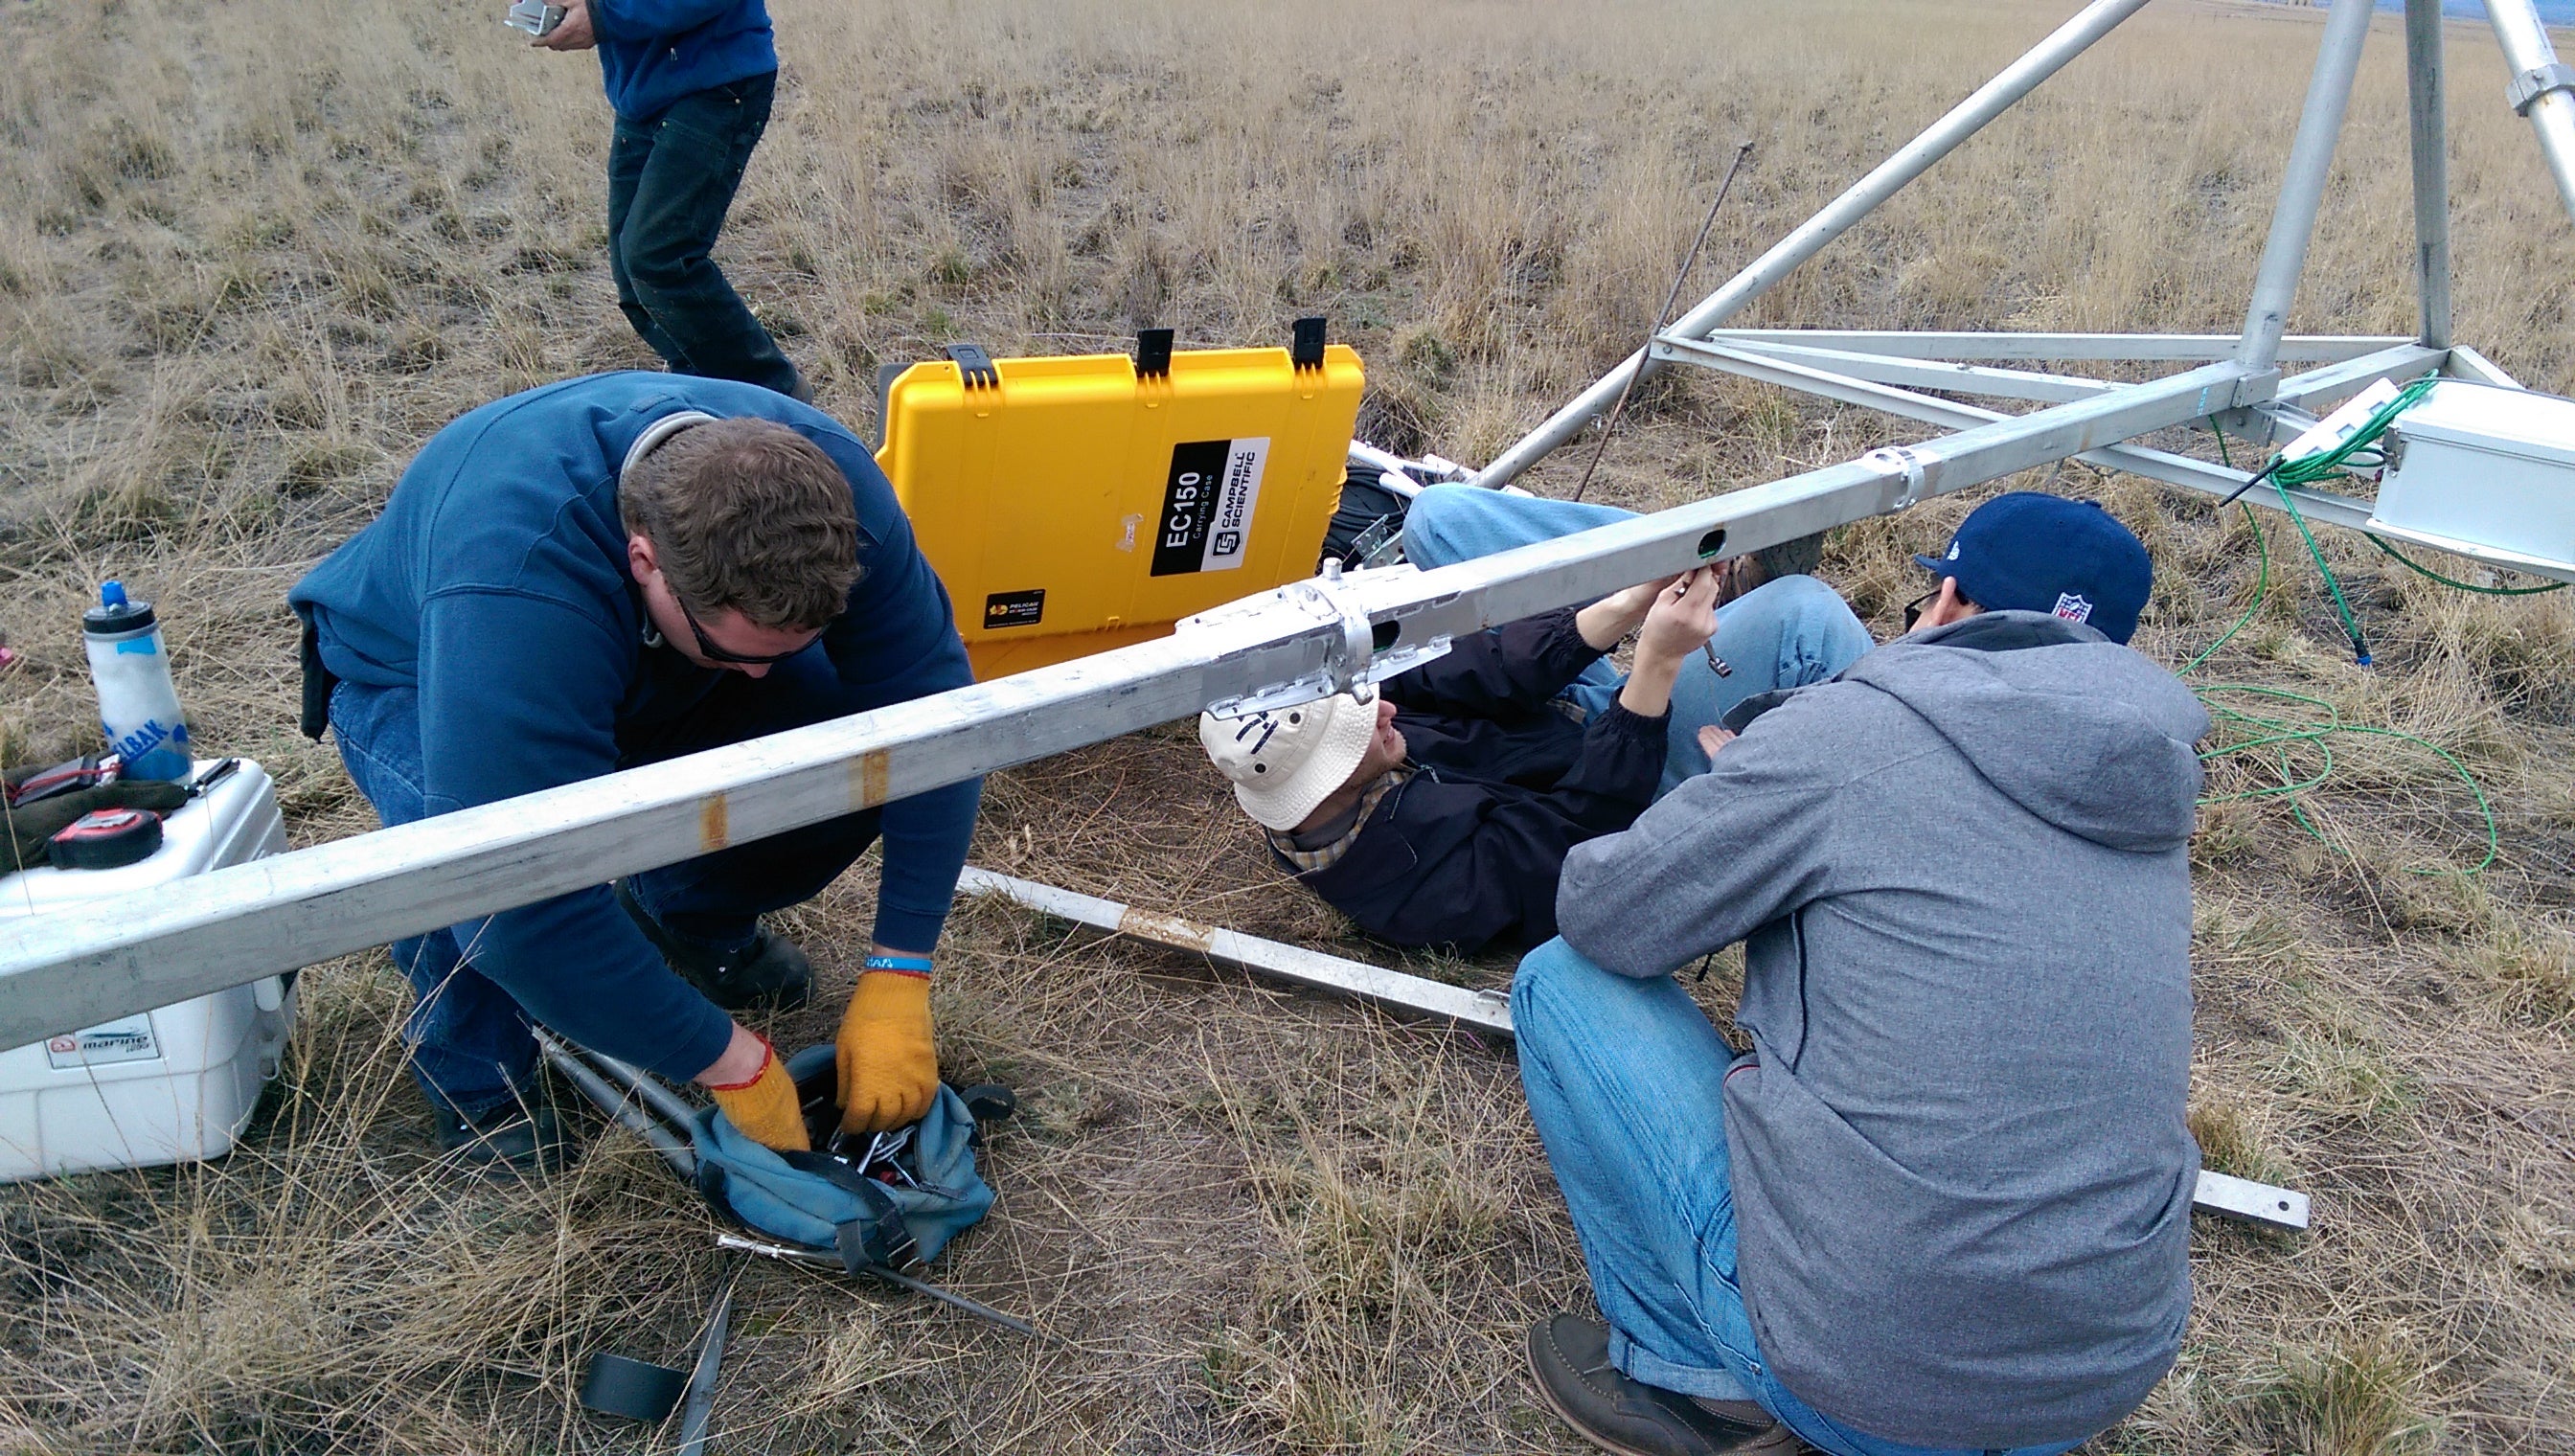
Figure 9: CU students helping install the ISFS station southeast of the BAO tower, 20 Feb 2015.
|
 |
 |
|
Figure 10: CU students preparing tower structure, 20 Feb 2015.
|
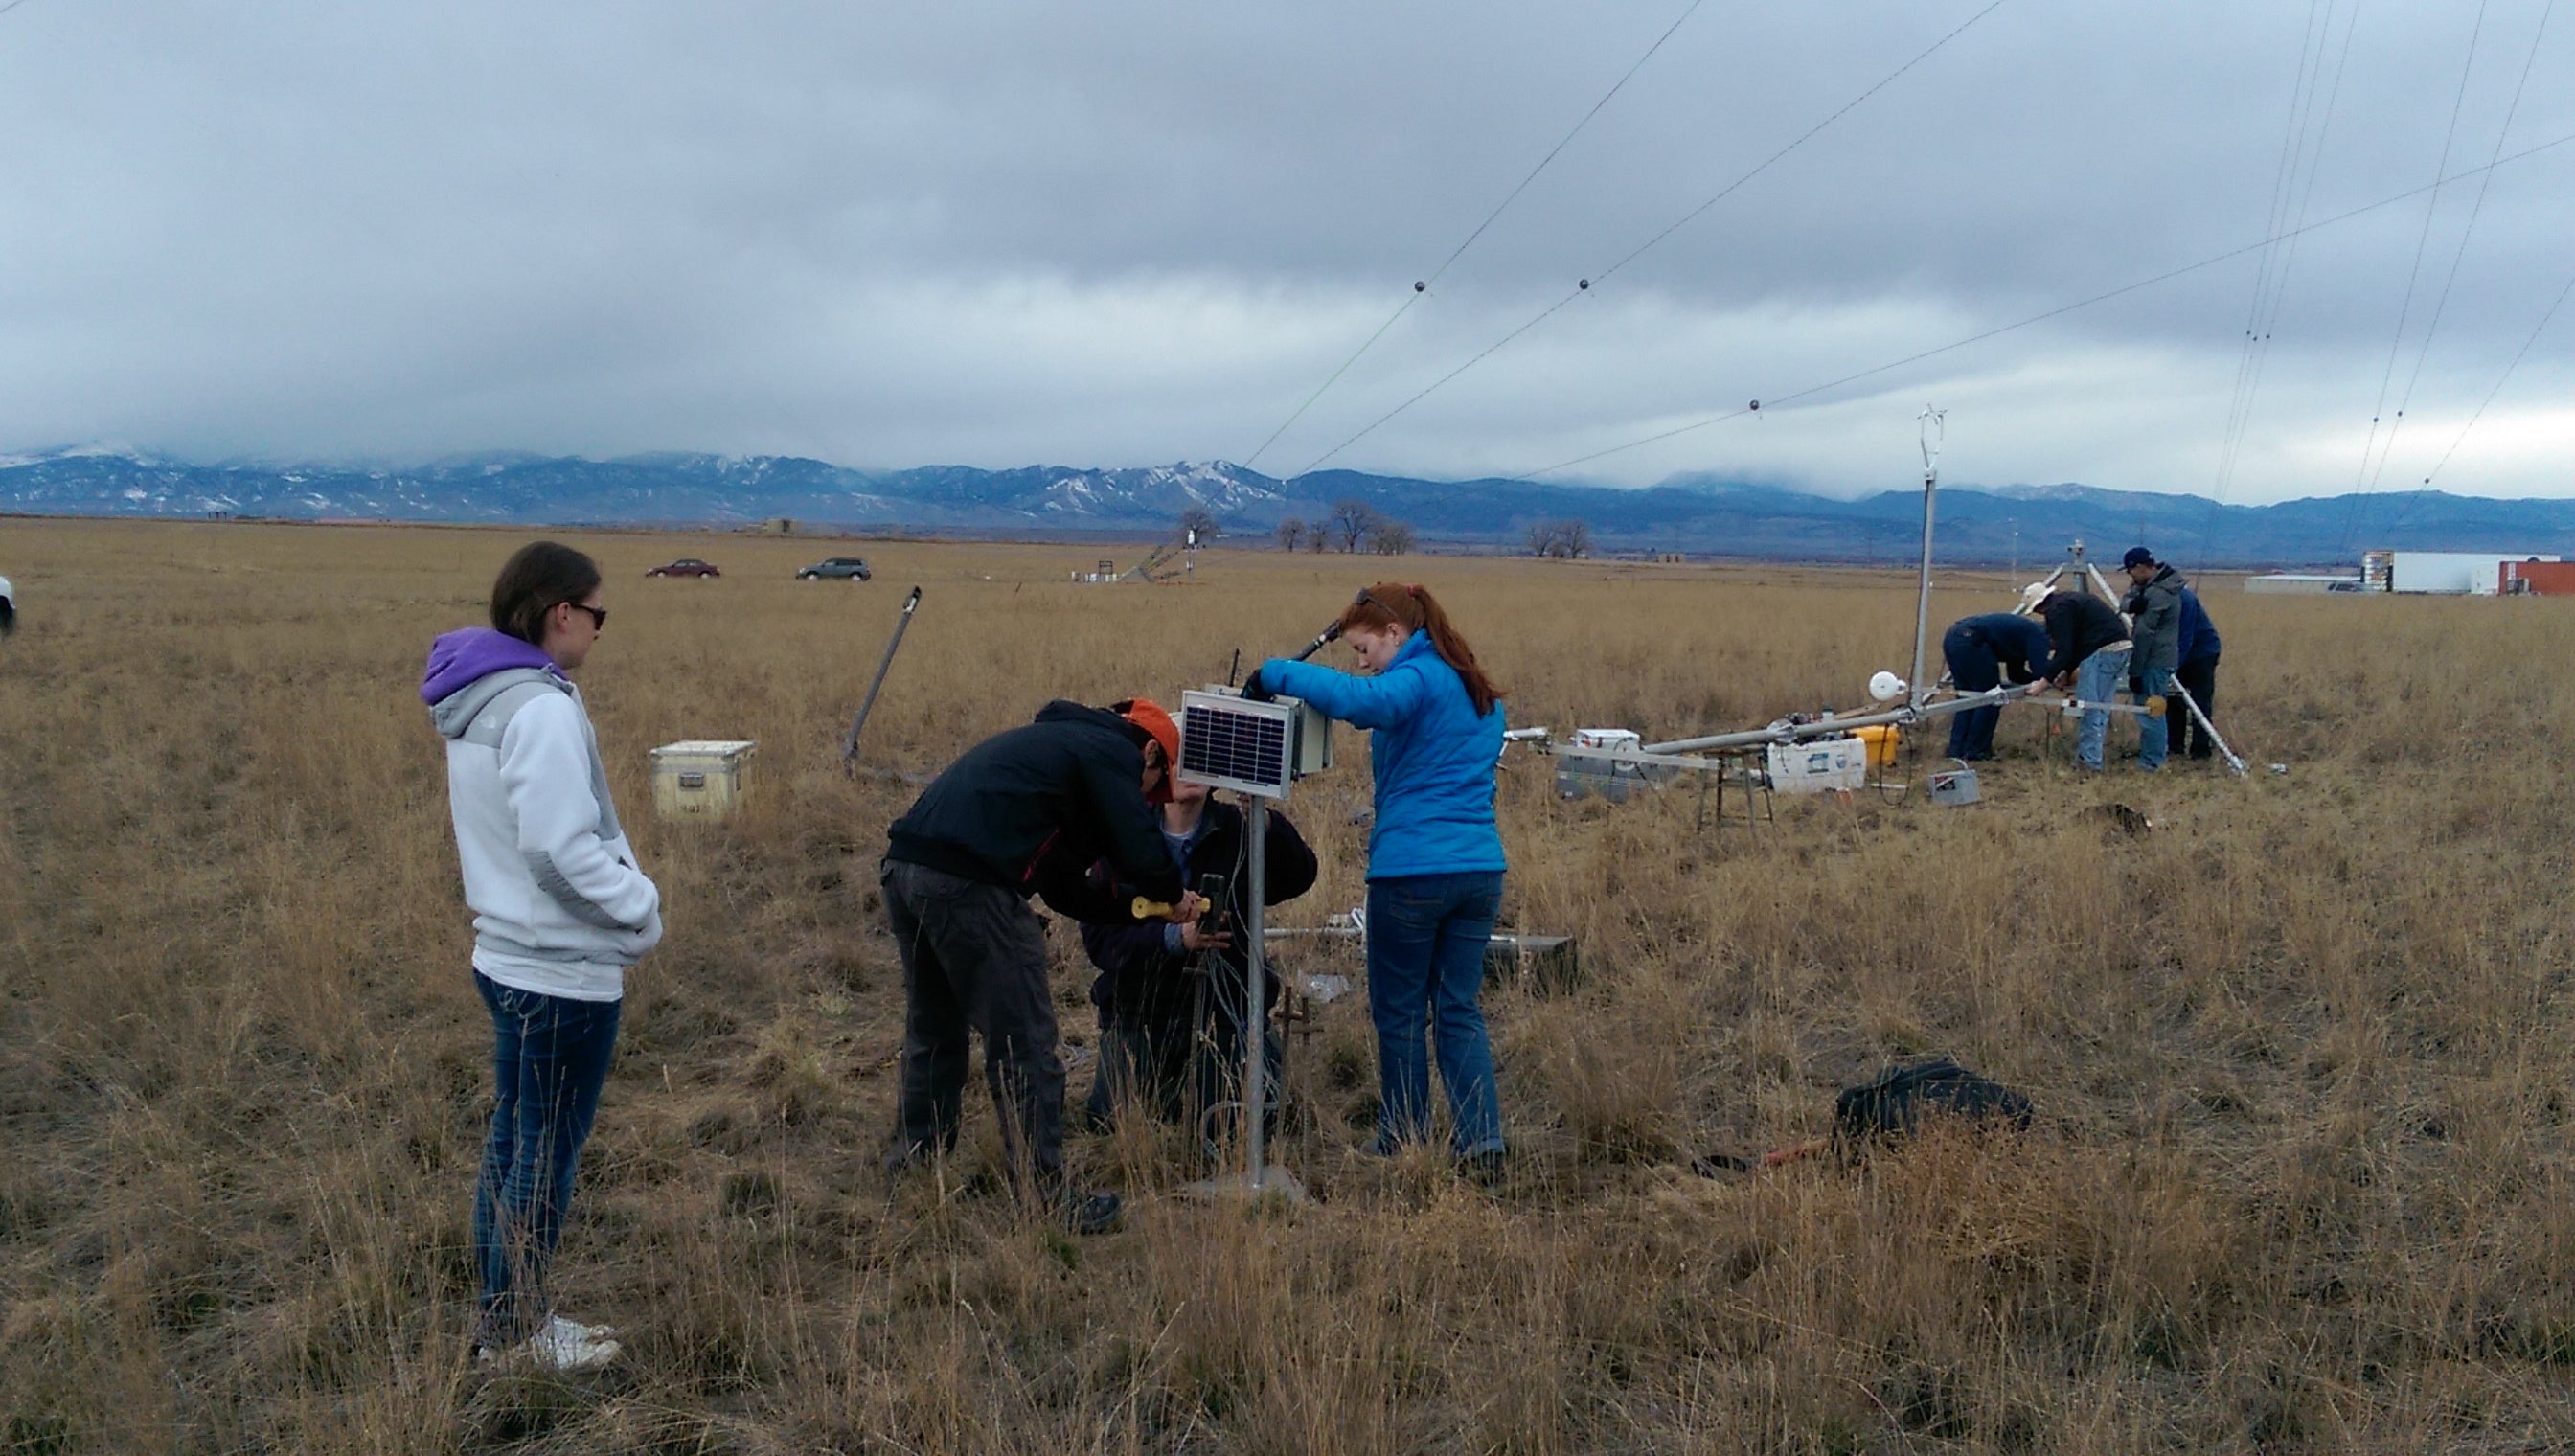
Figure 11: CU students assist Steve Oncley with power and network connections in the foreground while other students prepare the tower in the background, 20 Feb 2015.
|
|
|
|
Figure 12: Group photo after the intallation of the ISFS tower, 20 Feb 2015. Joseph Lee took the photo.
|
MGAUS
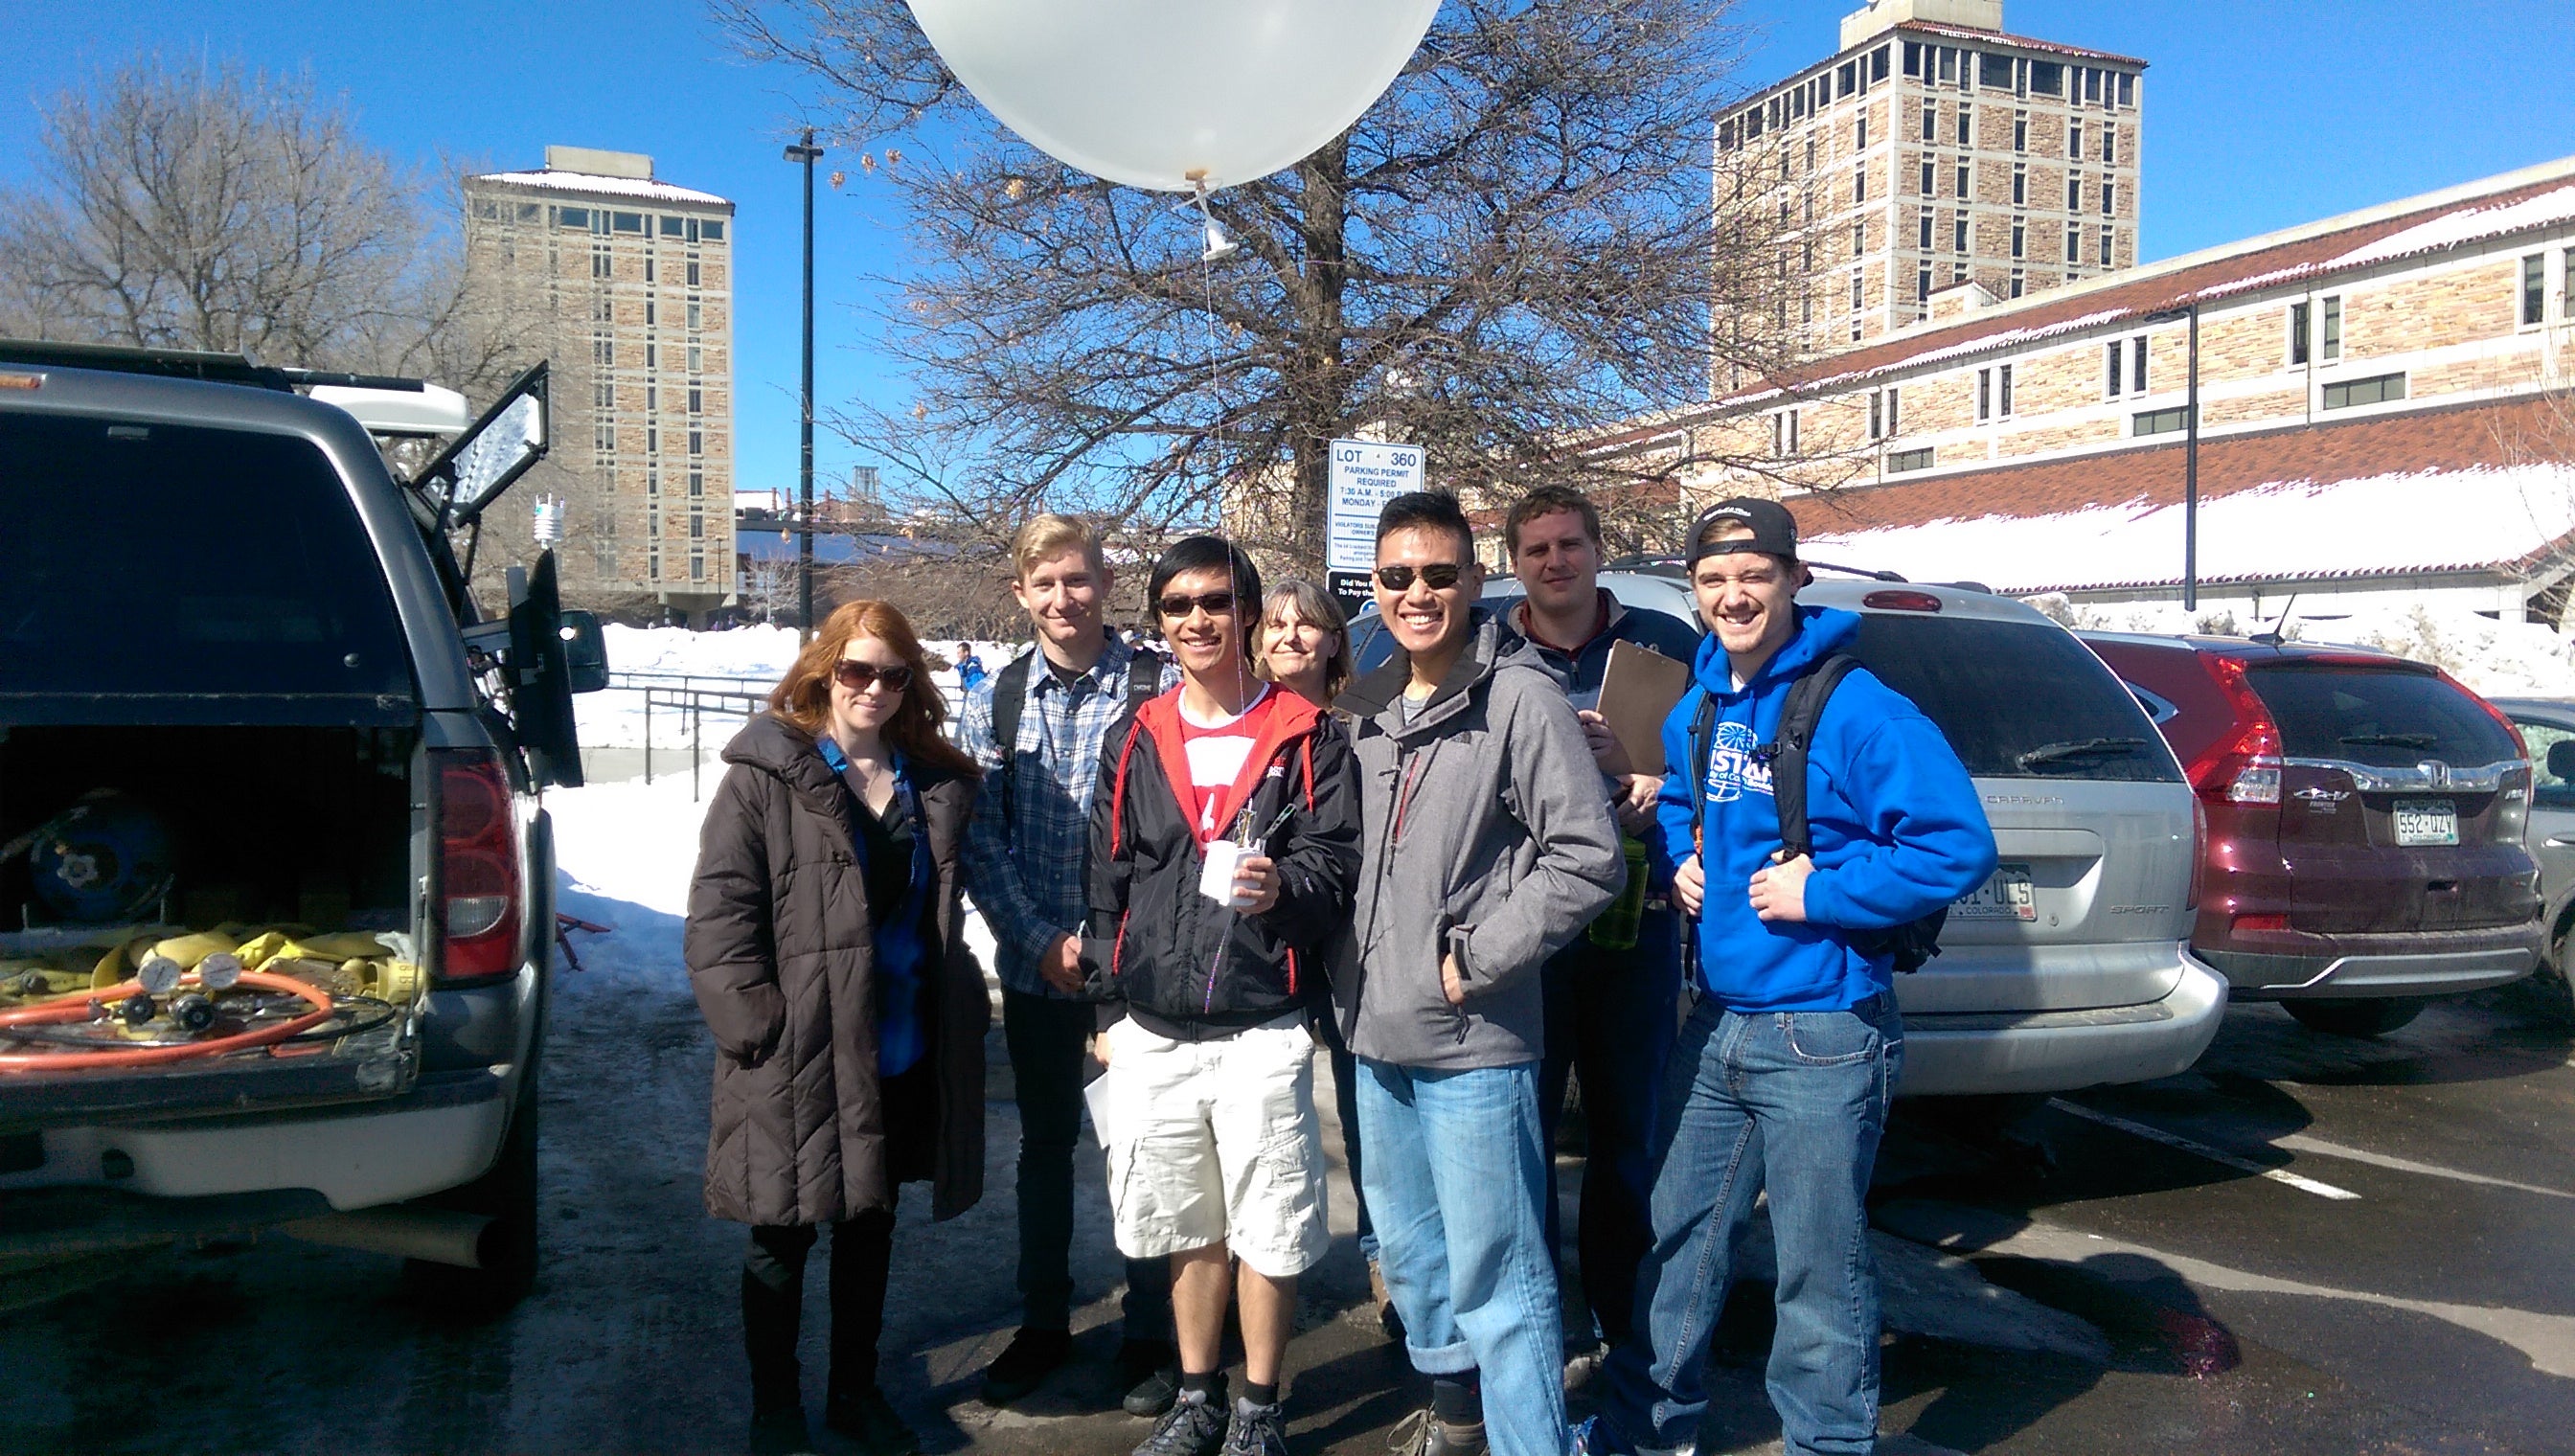
Before the MGAUS launches at EHS discussed above, Tim Lim brought the MGAUS system to CU-‐Boulder to expose CU students in ATOC 4770/5770, a mixed graduate-‐ undergraduate course in “Wind Energy Meteorology” to soundings (Figure 13-‐Figure 14). This demonstration (6 March 2015) also provided a teaching opportunity for the CU graduate students who would launch soundings throughout March from the BAO site.
Following this demonstration, from 9 March through 18 March, CU students Rochelle Worsnop, Paul Quelet, Clara St. Martin, Joseph Lee, and Brian Vanderwende took primary responsibility for launching radiosondes from the BAO Visitor Center. Following the launch, they used NCAR’s ASPEN software (https://www.eol.ucar.edu/software/aspen ) to prepare basic plots of the soundings and summarized the launches and meteorological conditions at the project blogsite,
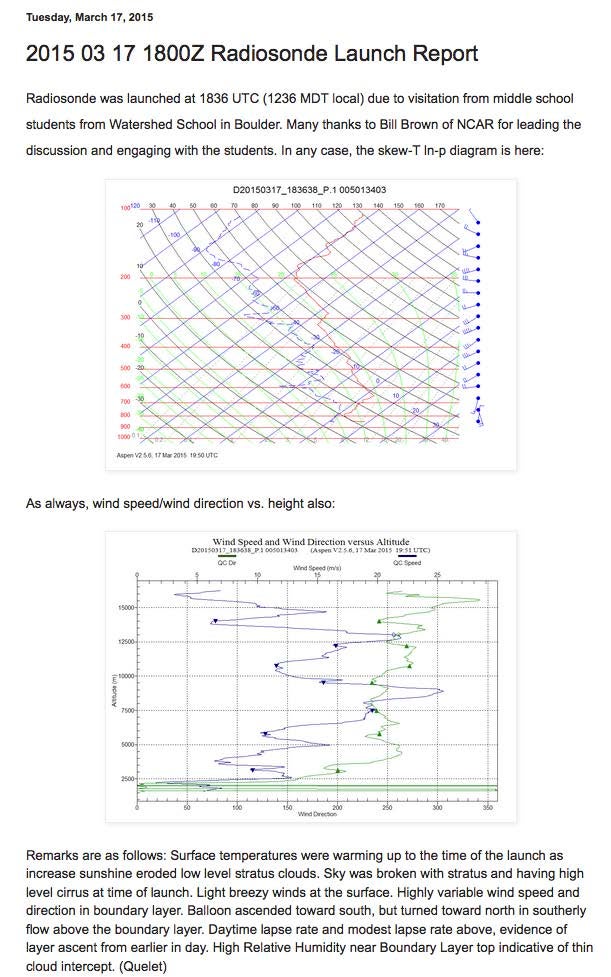
http://a2expia.blogspot.com. Several of the students mentioned that using aspen was a useful experience. An example post is shown in Figure 15.
Finally, these data were used in ATOC 1050, a large undergraduate general science requirement course (“Weather and the Atmosphere”) by Dr. Melissa Nigro. Her in-‐class exercise appears in Figure 21 and Figure 22, in the “Examples of Student Work” section below.
 |
||
|
Figure 13: A subset of the CU students who attended Tim Lim's 6 March sounding demonstration.
|
 |
 |
|
Figure 14: CU undergraduate students from ATOC 4770, “Wind Energy Meteorology”) launching a radiosonde from CU Main Campus, 6 March 2015.
|
Figure 15: Blog post from CU graduate student showing data from MGAUS launch and meteorological remarks. From http://a2expia.blogspot.com/2015/03/2015-‐
03-‐17-‐1400z-‐radiosonde-‐launch_17.html. |
BAO tower datastreams
The considerable investment in sonic anemometers and temperature/relative humidity measurements at the BAO tower as part of CABL provided significant educational opportunities for a range of students at CU Boulder. For example, CU graduate students participating in XPIA are utilizing the data as part of their research. Data from the towers are being incorporated into a revision of the ATOC 1070 Weather Lab – each semester, approximately 250-‐280 students are enrolled in ATOC 1070 to complete their general science requirements. Finally, although Prof. Lundquist’s ATOC 4770/5770 class (26 students) was scheduled to visit the BAO in person for a field trip on 26 February 2015, inclement weather required that the trip be cancelled due to safety concerns regarding transportation out to the BAO. Because the CABL datastreams from the tower and from several of the XPIA lidars on-‐site at the BAO were available online, however, a “virtual” field trip took place. In addition to learning about the instrumentation, a guided worksheet enabled students to apply and test their developing understanding of wind profiles and the relationship between atmospheric stability and winds. The worksheet is provided in Section 3 of this report.
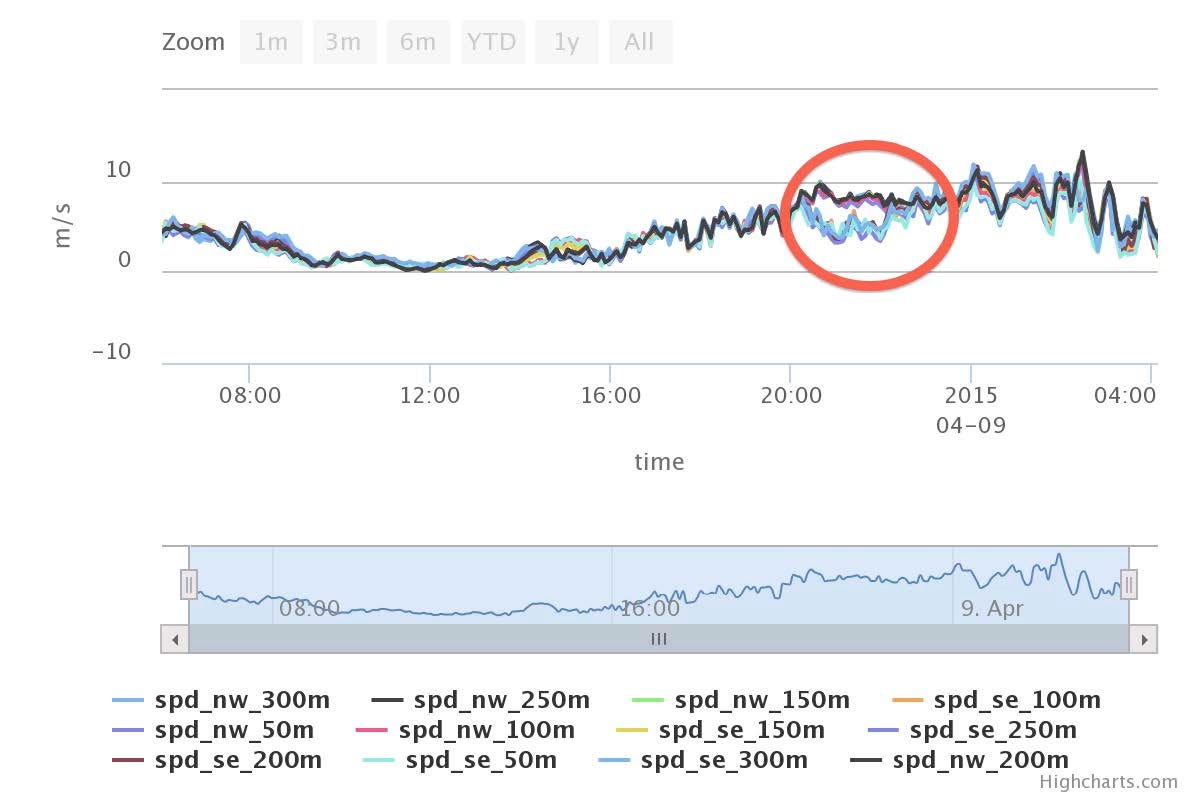
An important topic in ATOC 4770/5770 deals with how tower wakes might influence meteorological measurements. A bonus problem on the “Virtual Field Trip” worksheet suggested that students consider the idea that the tower itself might wake the instruments on the booms. Several weeks later, this tower waking was clearly evident, as captured in a blogpost (http://a2expia.blogspot.com/2015/04/distinct-‐mast-‐effects-‐ on-‐se-‐sonics.html), which included an example from NCAR’s ncharts plots (Figure 16).
|
Figure 16: Snapshot from ncharts showing a distinct tower wake (see http://a2expia.blogspot.com/2015/04/
distinct-mast-effects‐on‐se‐sonics.html for more information). This image was later used in ATOC 4770/5770 lecture. |
The NCAR investment in developing the ncharts platform that enabled this data access and data browsing is greatly appreciated considering its great utility for both educational and research purposes.
Watershed School
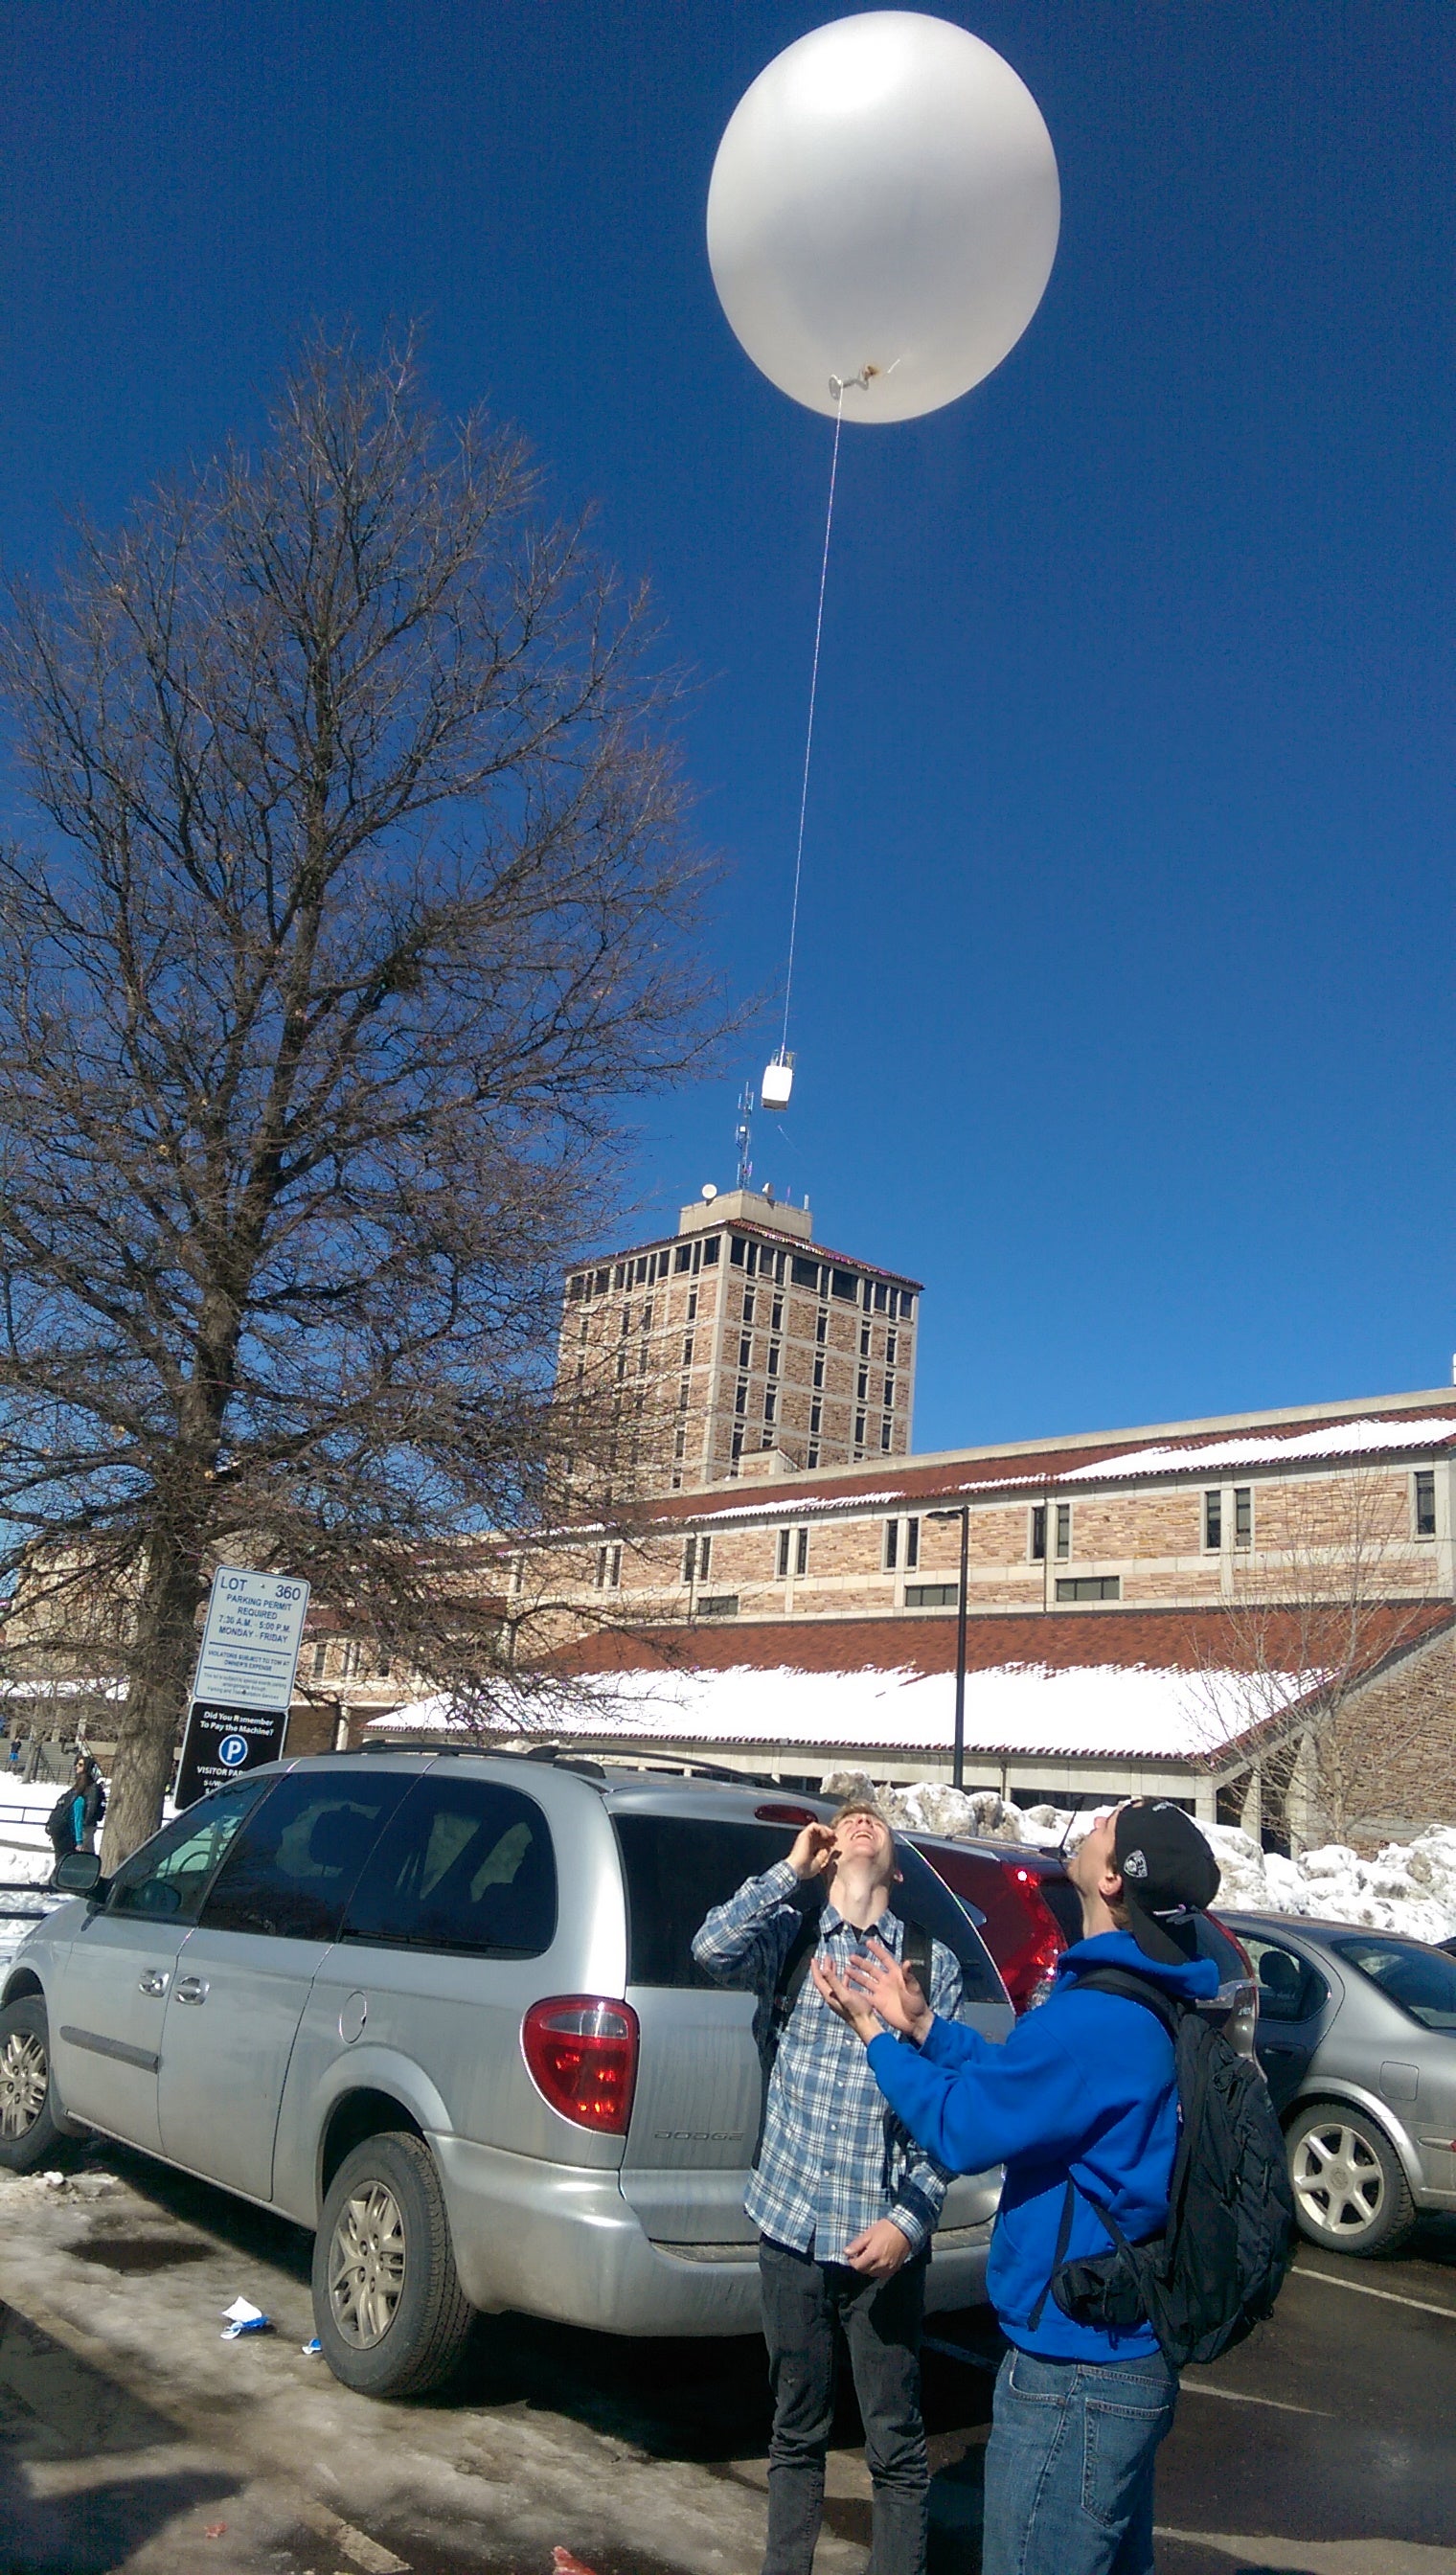
This educational outreach opportunity presented itself when this middle school requested a sounding demonstration from NCAR. A CU student, Paul Quelet, shifted his sounding launch time to accommodate the visit and interaction with the students from the Watershed School (Figure 17). Paul expressed great appreciation that Dr. Bill Brown from NCAR joined the school visit.
|
Figure 17: Middle school students from the Watershed School visit the BAO tower and launch a radiosonde. The 300-m BAO tower appears at right.
|


