CABL
Characterizing the Atmospheric Boundary Layer
 Characterizing the Atmospheric Boundary Layer (CABL)
Principal Investigator: Dr. Julie K. Lundquist
Facility: GAUS and ISFS Stations
Overview
The “Characterizing the Atmospheric Boundary Layer” (CABL) educational deployment leveraged multiple outreach opportunities to provide scientific opportunities to high school, undergraduate, and graduate students in Colorado’s Front Range. Several EOL facilities were deployed as part of CABL, including 12 sonic anemometers and 6 temperature/relative humidity probes mounted on the Boulder Atmospheric Observatory (BAO), 40 mobile GPS Advanced Upper-‐air Soundings (MGAUS), and the deployment of two Integrated Surface Flux stations, one at the BAO and in the vicinity of Erie High School.
These deployments occurred in conjunction with the XPIA experiment, conducted by the University of Colorado Boulder (CU) and the Earth Systems Research Laboratory at NOAA with colleagues from the University of Maryland Baltimore Country and the University of Texas at Dallas. The primary scientific goal of the XPIA experiment was to characterize the capabilities of remote sensing instrumentation, such as scanning lidar and radar, in a range of air quality conditions. As we had expected, spring conditions on Colorado’s Front Range brought several rounds of precipitation (ranging from light to heavy, rain through snow) as well as strong diurnal cycles and the resulting cycle in atmospheric stability, providing an excellent testbed for evaluating the performance of lidars, radars, and radiometers.
Because of close cooperation between XPIA staff and Erie High School (EHS), located ~ 1 km from the BAO, we were able to work closely with environmental science and meteorology teachers at EHS, as well as with undergraduate and graduate students at the University of Colorado Boulder (CU) and local middle school students. This document highlights the educational impact of the CABL deployment. The atmospheric science research enabled by CABL and XPIA is summarized in an NREL technical report (in preparation) and a submission to the Bulletin of the American Meterological Society (in preparation) as well as several papers to be submitted to a special issues of Atmospheric Measurement Techniques (http://www.atmos-meas-tech.net/special_issues.html).
Examples of Pedagogical Materials
In this section, we provide selected examples highlighting how CABL data were used in the classroom during Spring 2015. CABL data are also being incorporated into the curricula for future classes, and at least one CU graduate student is incorporating CABL and XPIA data into his dissertation research. In this section, we highlight implementation into the ATOC 4770/5770 mixed graduate-‐undergraduate curriculum, the ATOC 1050 large undergraduate meteorology lecture, as well as some research results on the BAO tower wake.
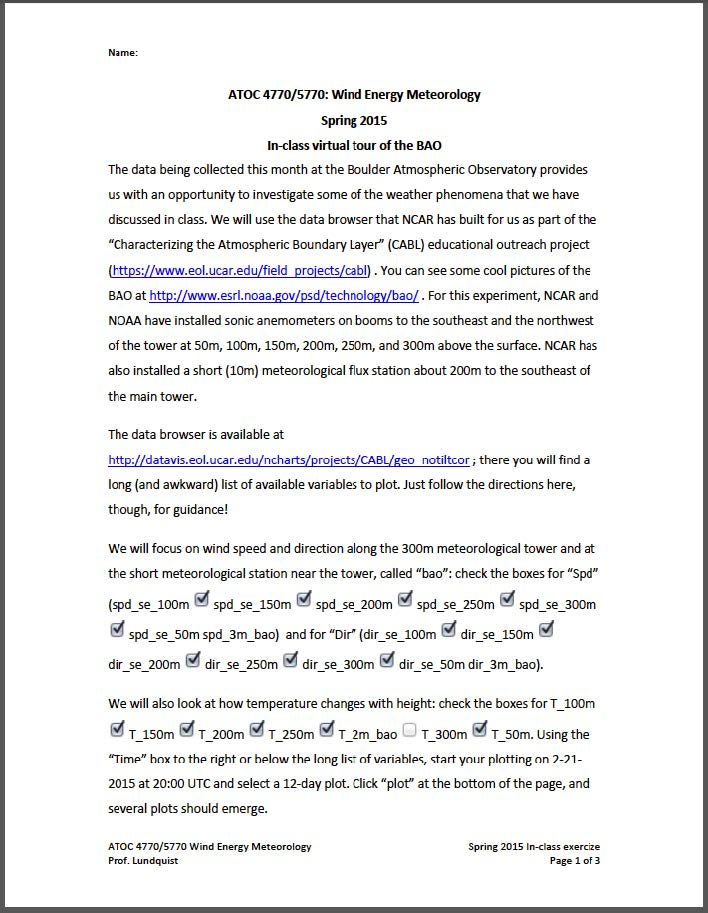
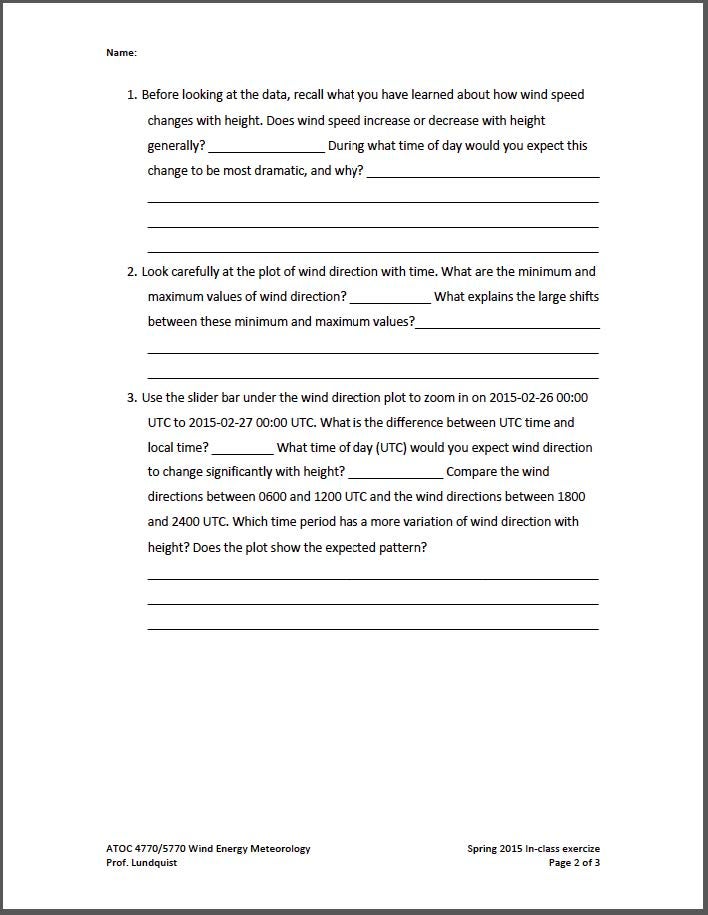
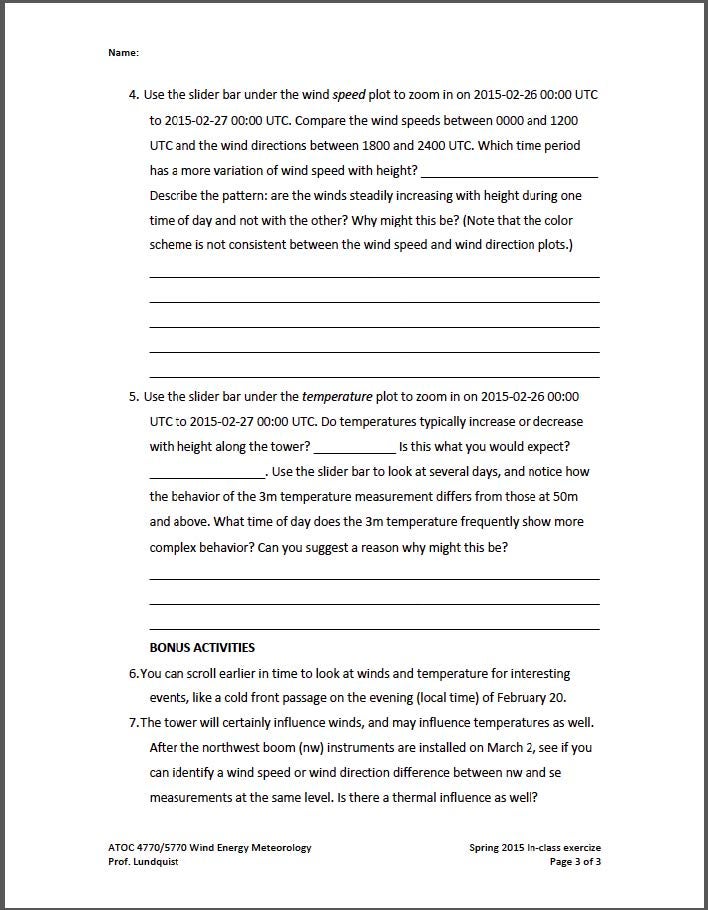
ATOC 4770/5770 Virtual field trip documentation
As discussed above, Prof. Lundquist’s “Wind Energy Meteorology” class had a planned field trip on 26 February to visit the BAO. Due to heavy snowfall and icy roads, this trip was cancelled that morning and a virtual field trip was instead prepared. The following three pages include the material guiding that "virtual field trip". A presentation including photos was also included in the class that day.
 |
 |
 |
| Figure 18-20: ATOC 4770/5770 in-class exercise, page 1-3 | ||
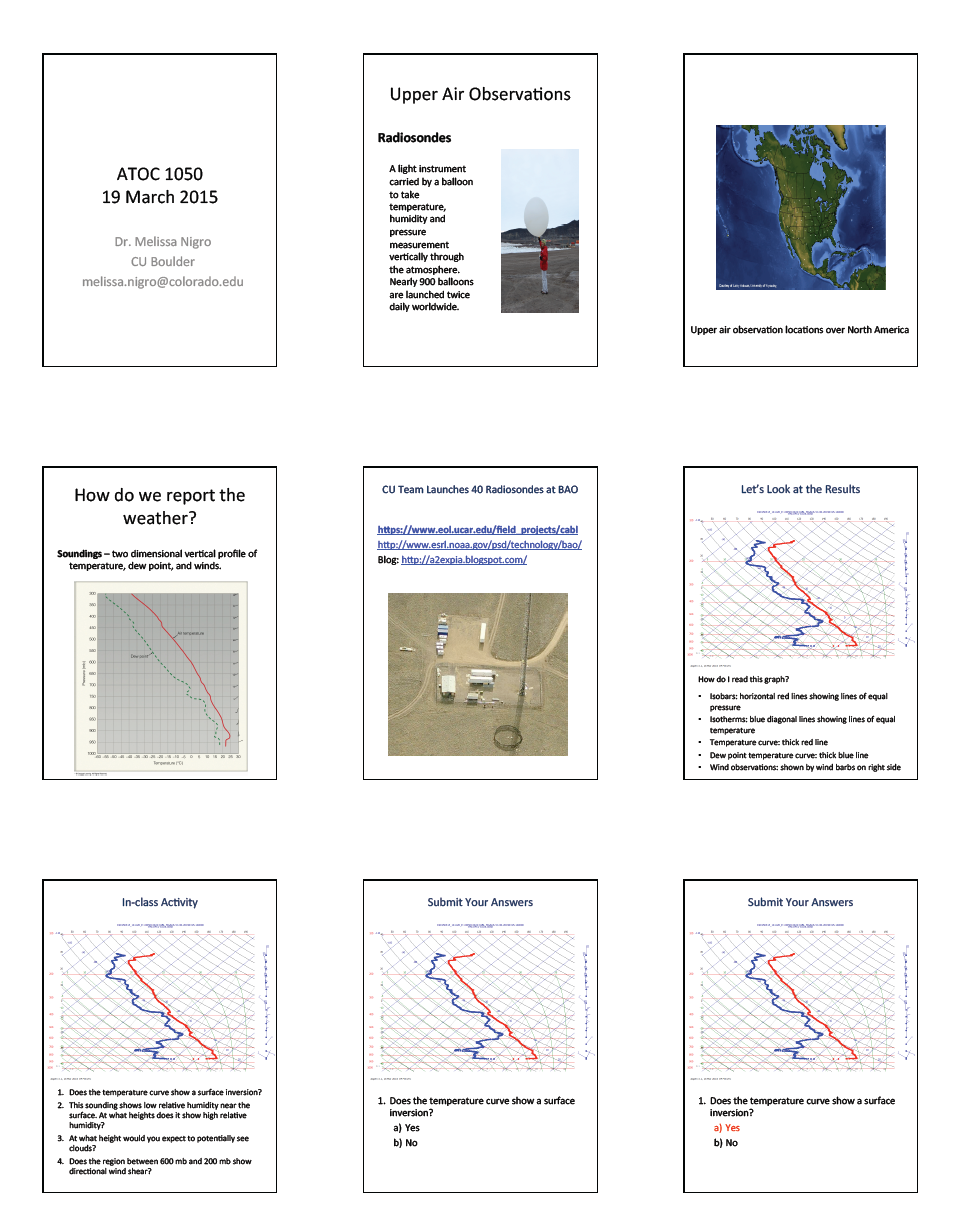
ATOC 1050 (~ 300 undergraduate students) in-‐class clicker activity with soundings
Many of CU’s large undergraduate courses employ “clickers” for in-‐class polling and student assessment. (More information on clickers can be found at http://www.colorado.edu/sei/documents/clickeruse_guide0108.pdf .) Dr. Melissa Nigro developed an in-‐class exercise, based on MGAUS data, for use in her large undergraduate ATOC 1050 course. The slides for this exercise are seen in Figure 21-‐ Figure 22. (These are best viewed on-‐line and zoomed-‐in.)
 |
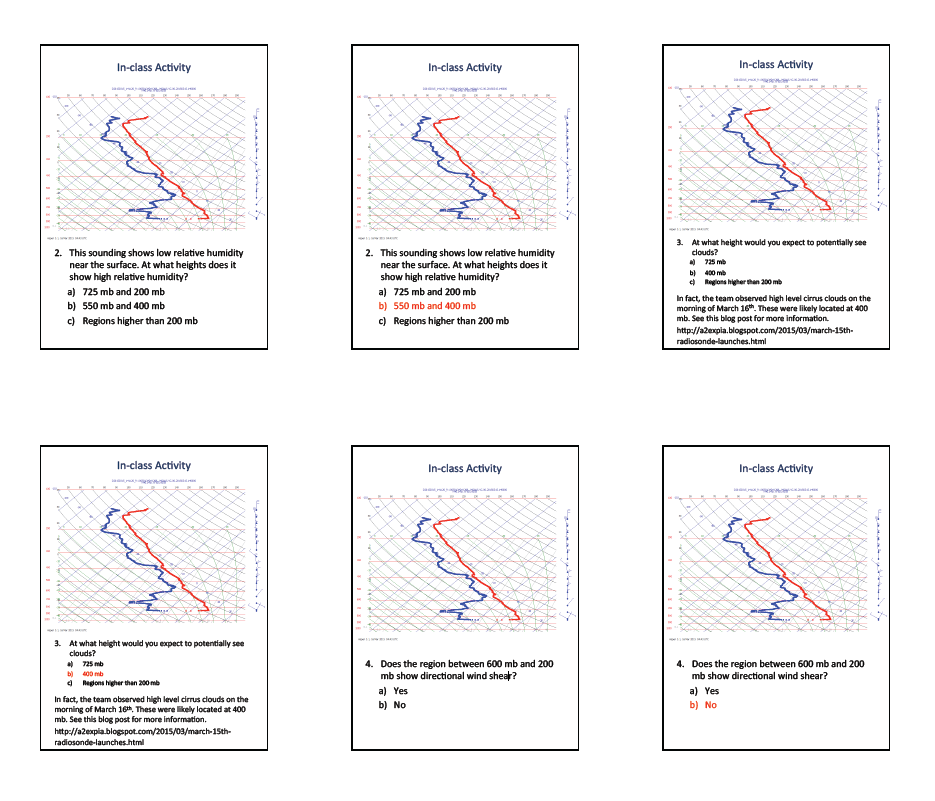 |
| Figure 21: Incorporation of CABL data into ATOC 1050 (~ 300 undergraduate students) by Dr. Melissa Nigro (first nine slides). | Figure 22: As in Figure 21, last six slides. |
Graduate student research
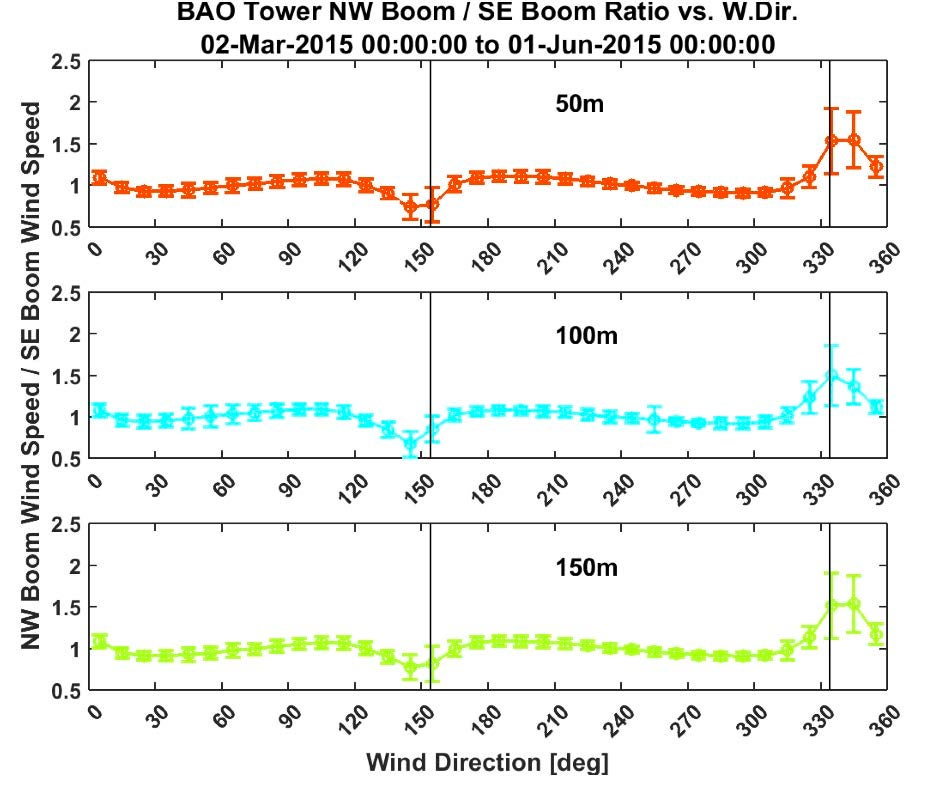
CU graduate student Paul Quelet is investigating the performance of the wind profiling lidars located near the BAO tower. As part of that work, he assessed the occurrences of tower wakes on the sonic anemometers deployed on the tower as part of CABL. Distinct wakes are seen at the expected wind directions (Figure 23), and these wakes are not evident in the lidar data, from the system located 200 m south of the tower (Figure 24). Collaborators have assessed turbulence kinetic energy and turbulence kinetic energy dissipation rate from the tower sonics as well, with identical patterns in the wakes.
Summary
The “Characterizing the Atmospheric Boundary Layer” (CABL) educational deployment request provided unique scientific opportunities to high school, undergraduate, and graduate students in Colorado’s Front Range by complementing and extending the reach of the eXperimental Planetary bound layer Instrumentation Assessment (XPIA) occurring in Spring 2015 at the Boulder Atmospheric Observatory (BAO). We are very grateful for NCAR EOL’s superb support before, during, and after the CABL deployments, which included MGAUS, ISFS, and equipment for deployment on the BAO 300-‐m meteorological tower. As noted above, the on-‐line data access (through ncharts) proved to be very useful from both real-‐time research and pedagogical perspectives.
The extensive atmospheric science research enabled by CABL and XPIA is summarized in an NREL technical report (in preparation) and a submission to the Bulletin of the American Meteorological Society (in preparation) as well as several papers to be submitted to a special issues of Atmospheric Measurement Techniques.
 |
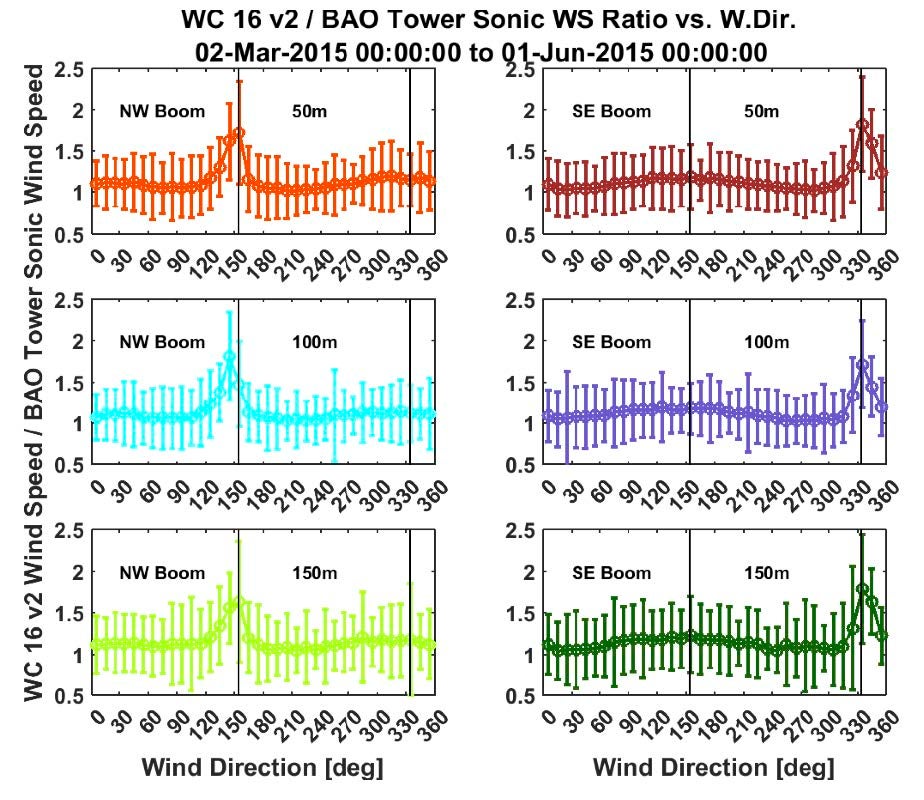 |
| Figure 23: Ratio of wind speed from the sonic anemometer on the NW boom to that from the SE boom as a function of wind direction. Vertical lines mark the direction of the booms. Error bars indicate standard deviations for that wind speed bin. Courtesy Paul Quelet. | Figure 24: Comparison of wind speeds from BAO tower sonics at three levels (top, center, bottom) to profiling lidar data (WC16 v2) from the lidar supersite 200 m south of the BAO tower. Error bars indicate standard deviations for that 10-‐degree wind speed bin. Courtesy Paul Quelet. |
Data Manager
EOL Archive, NCAR/EOL/DMS