| What |
|
|---|---|
| When | Dec 03, 2004 12:00 PM to Jan 05, 2005 12:00 PM |
| Where | Rico |
| Contact Name | Gordon Maclean |
| Contact Phone | (303) 497-8794 |
Introduction
This document describes the operation and measurements of the Integrated Surface Flux Facility (ISFF) meteorological station during RICO.
If you reached this page from a search engine, click here to see the full report, with frames.
RICO Links
Site Description
The GPS coordinates for the site are 17 deg 33.047' N, 61 deg 44.259' W (from the RICO Project Information book).
Schedule
December 3rd, 2004 -Data collection starts
January 25th, 2005 -Data collection ends
Instrumentation
The instrumentation consists of:
- Barometer, Vaisala PTB220B, with a single-disk static pressure port
- Vaisala 50Y Humitters to measure air temperature and RH at 2m AGL in NCAR aspirated radiation shield
- RMYoung Prop Vane at 10 meters
- Long and short wave radiometers
- Rain gauge
Sensor Notes
No major sensor problems occurred during this project.
Propeller-Vanes
No problems occurred. The mast was down on both Dec 30 and 31 to move communications antennae. These data have been removed.
T/RH
The first 5 hours of data collected on Dec 3 were from a bad sensor. The rest of the data were okay. The Gortex filter was replaced approximately weekly (and had some salt build-up). We don't think this should affect the data. The fan also was inspected (at least by ear) almost daily and was always working. The fan was removed from its housing a few times during the project and moisture and crystallized salt was found on the housing, but the blade appeared to be unaffected.
Derived values of specific humidity have been added to the data files.
Barometer
No problems occurred. The pressure signal is dominated by a semidurnal oscillation associated with a solar "tide", typical of tropical conditions (see example).
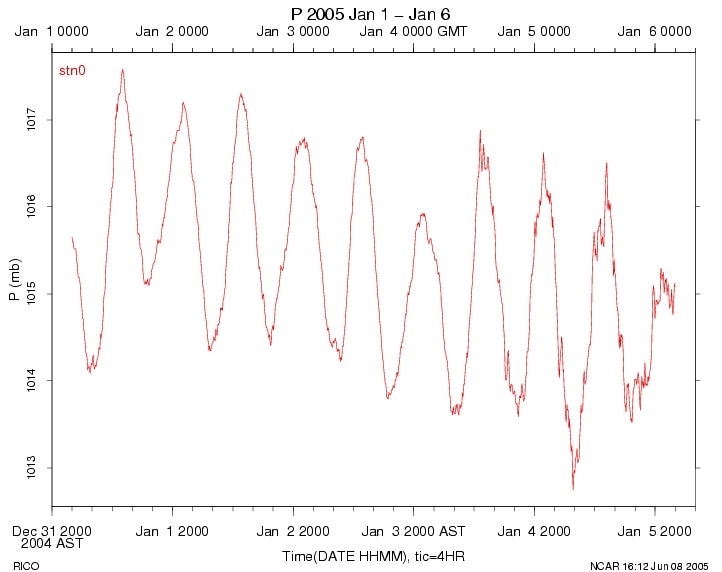
Radiometers
Both the pyranometer and pyrgeometer behaved properly throughout the program. However, persistent winds built up a thin coating of salt spray on the windward (east) side. For this reason, both radiometers were cleaned every day (usually in the morning). Because cloud-free skies almost never happened, it is quite difficult to estimate the error caused by this spray, but it could actually enhance the measured radiation due to increased specular reflections. With the frequent cleanings, we have ignored this error.
Two unusual characteristics in the short-wave data are short-duration spikes, due to shadowing by small (~100m) quickly-moving (15m/s) clouds, and enhancement of radiation above the cosine-weighted attenuated solar constant at the edges of clouds due to direct sunlight collected by the optically-thin clouds. Examples of this are 1 day, a few clouds.
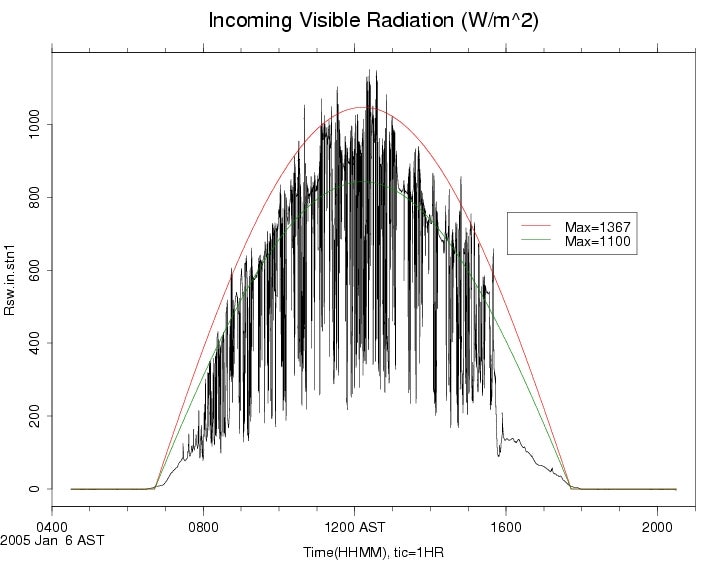
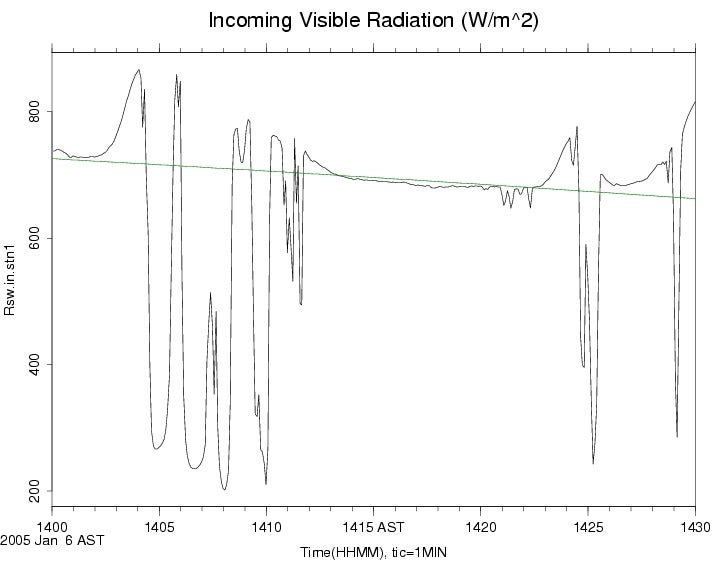
Values of long-wave radiation derived simply as: R_pile + sigma T_case^4 have been added to the data files. This should be sufficient since Kipp-and-Zonen pyrgeometers were used.
Rain Gauge
This operated normally as far as we can tell. Total accumulation was only 40mm, which seems somewhat low and may be due to high winds affecting the collection efficiency. (Though this usually is not a problem for liquid precipitation.) A few test tips on Dec 4 and Dec 29 have been removed from the data set.
Photographs
Photos of the station and environment around Spanish Point are here. Here are Ned Chamberlain's, Mike Susedik's, and Steve Oncley's tourist photos.
Here are unedited STATION PANORMAS taken from on top of the tripod and rotating around the mast:
Set-1
Field Logbook
A computer-readable field logbook of comments by NCAR and other personnel is available in read-only html form.
Data Plots
Click on the above link to plots of 5 minute statistics of the sampled variables.
Data Download
The NCAR data are available for download in the following forms:


Data Policy
Data Set Documentation Guidelines
Data Submission Instructions
Scientific Overview Document (PDF)
Operations Plan (PDF)
Kathy Caesar's Weather Summary (PDF)
Participant Web Pages
UCLA
UCSC
University of Miami:
Overview | Instrumentation
University of Wyoming
Facility Web Pages