Sites
17 sites were chosen in the 10x10km area surrounding the WLEF tower. 2 in wetlands used the ISFS tripod towers, only to 4m height. 3 used guyed Rohn towers from 13--30m high. The remaining 12 were our first use of trailer-mounted telescoping towers (TT, below) to 32m, with the top instrumentation at about 33m.
| Sites | Lat | Lon | NCAR name | Ameriflux name |
Original name |
Tower Type |
|---|---|---|---|---|---|---|
| NW1_pine_1 | 45.9720010 | -90.3231720 | NW1 | 10 | Landa TT | |
| NW2_poplar_1 | 45.9677333 | -90.3087833 | NW2 | c | Rohn-12m | |
| NW3_tussock_1 | 45.9689167 | -90.3010333 | NW3 | d | PAM | |
| NW4_lake_1 | 45.9792500 | -90.3004167 | NW4 | 25lake | ITS TT | |
| NW5_grass_1 | 45.9458333 | -90.2943667 | NW5 | ISS | MSU | |
| NE1_pine_2 | 45.9734833 | -90.2723000 | NE1 | 19 | Landa TT | |
| NE2_larch_1 | 45.9557333 | -90.2406000 | NE2 | k | Landa TT | |
| NE3_hardwood_1 | 45.9749000 | -90.2327333 | NE3 | 42W | ITS box TT | |
| NE4_cedar_1 | 45.9618667 | -90.2270333 | NE4 | l | Landa TT | |
| SW1_poplar_2 | 45.9149000 | -90.3425000 | SW1 | e | ITS box TT | |
| SW2_poplar_3 | 45.9409000 | -90.3177333 | SW2 | 28 | 30m Rohn | |
| SW3_hardwood_2 | 45.9206670 | -90.3099000 | SW3 | 16W | ITS TT | |
| SW4_hardwood_3 | 45.9392167 | -90.2823167 | SW4 | 11 | Landa TT | |
| SE1_lake_2 | 45.9228833 | -90.2728333 | SE1 | 23lake | MSU | |
| SE2_maple_1 | 45.9365167 | -90.2640833 | SE2 | 45 | Landa "H" TT | |
| SE3_aspen_1 | 45.9271500 | -90.2475000 | SE3 | h | ITS gooseneck TT | |
| SE4_tussock_2 | 45.9244833 | -90.2474500 | SE4 | g | PAM | |
| SE5_aspen_2 | 45.9380833 | -90.2381833 | SE5 | i | Rohn-13m | |
| SE6_pine_3 | 45.9197333 | -90.2288333 | SE6 | 8 | ITS gooseneck TT |
Instrumentation
Most of the sites were similarly instrumented. At the top of each site's tower was:
- sonic anemomter and open-path infrared H2O/CO2 gas analyzer (Campbell CSAT3AW/EC150) for turbulent fluxes
- slow-response temperature/humidity sensor (NCAR SHT)
- barometer (Vaisala PTB210)
- 4-component radiometer (Hukseflux NR01)
In addtion, 2 more temperature sensors were deployed, one at 2m and one at mid-canopy (where appropriate). Also, soil sensors (NCAR 4-level Tsoil, Meter EC-5 Qsoil, REBS HFT Gsoil, and Hukseflux TP01 Csoil) were deployed at one location in the 0--5cm layer near the base of the tower.
- All sonics, fast-response H2O/CO2, radiometers, and barometers were above the local canopy, though at NW2 there were a few trees that were much higher (an overstory)
- All soil sensors were, of course, buried below the surface, though at the two wetlands sites this was in a weed mat, that actually was underwater after mid summer at SE4.
- As for our slow response temperature/relative humidity sensors:
- The two wetlands sites, NW3 and SE4, had sensors just at 2m that were above the tussock canopy. All other 2m sensors were within the canopy.
- The two shorter tower sites, NW2 and SE5, had sensors at 10m that were above the local canopy (with the overstory caveat above for NW2). All other 10m sensors were within the canopy.
- All other sensors (25m or 30m) were above canopy
Laser multi-station scans of the positions and orientation of the sonic anemometers and positions of the TRH sensors were made in August. Although these should have high relative accuracy for each site, the scans were georeferenced only using a stand-alone GPS receiver and a hand-held compass for orientation. Thus, absolute accuracy is expected to be a few m in position and 2 degrees in azimuth. Position values are in UTM (zone 15T) and compass angles have been converted to true headings using a declination of 2.4 degrees.
Operations
Since the forest canopy will severly reduce light reaching the ground, solar panels were only used for power at the wetlands sites. Gas generators also could not be used due to their carbon emission. Thus, we manually exchanged batteries, bringing them to the ISFS base trailer for recharging. To reduce battery weight, we used LiPO batteries for the first time. Due to limited recharging capability at the base, there were times when stations lost power prior to the batteries being swapped. Field staff tried their best to avoid these outages.
- The tower at NE1 was received with a bad tilting motor, which delayed installation of the above-canopy sensors until 15 Jul.
- The wetland site SE4 became flooded, with heavy rain overfilling the adjacent stream channel, during 3 periods from 16--29 Aug, then continuously from 3 Sep through the end of the project. Data were lost for about 5 hrs. on 3 Sep., when the site's battery charger was submersed, shutting off power to the site.
- The NW1 site suffered a lightning strike on 30 Sep that destroyed the data system, the entire soil array, and several other sensors. All damaged components were replaced within 36 hours.
Since telescoping towers were used, the entire tower was lowered any time that servicing (cleaning, reconfiguration, or repair) of sensors was required. Data from the affected sensors have been removed when the tower was lowered. Fortunately, it often was straightforward to identify these time periods by inspection of the signal from the barometer that was mounted at the top of these towers.
Data Quality
Summary of information in the QC log.
NR01 Radiometers
NR01 integrated 4-component radiometers were used at all sites. Data have been filtered for wetness on the sensor and the periodic cleaning. They were cleaned 2-3 times during the study and no issues were noted. NR01 sensors were replaced at SE6, SW4, and NW1 (due to lightning strike).
We have added Rlw derived from the measured Rpile and Tcase from the pyrgeometers, Tsfc derived from the downward-looking pyrgeometer (assuming an emissiivity of 0.98) and Tsky derived from the upward-looking pyrgeometer (emissivity of 1.00), and Rsum derived as the signed sum of the 4 radiation components to the average statistics.
Hukseflux NR01 Issue First Documented Wed, Dec 23, 2020.
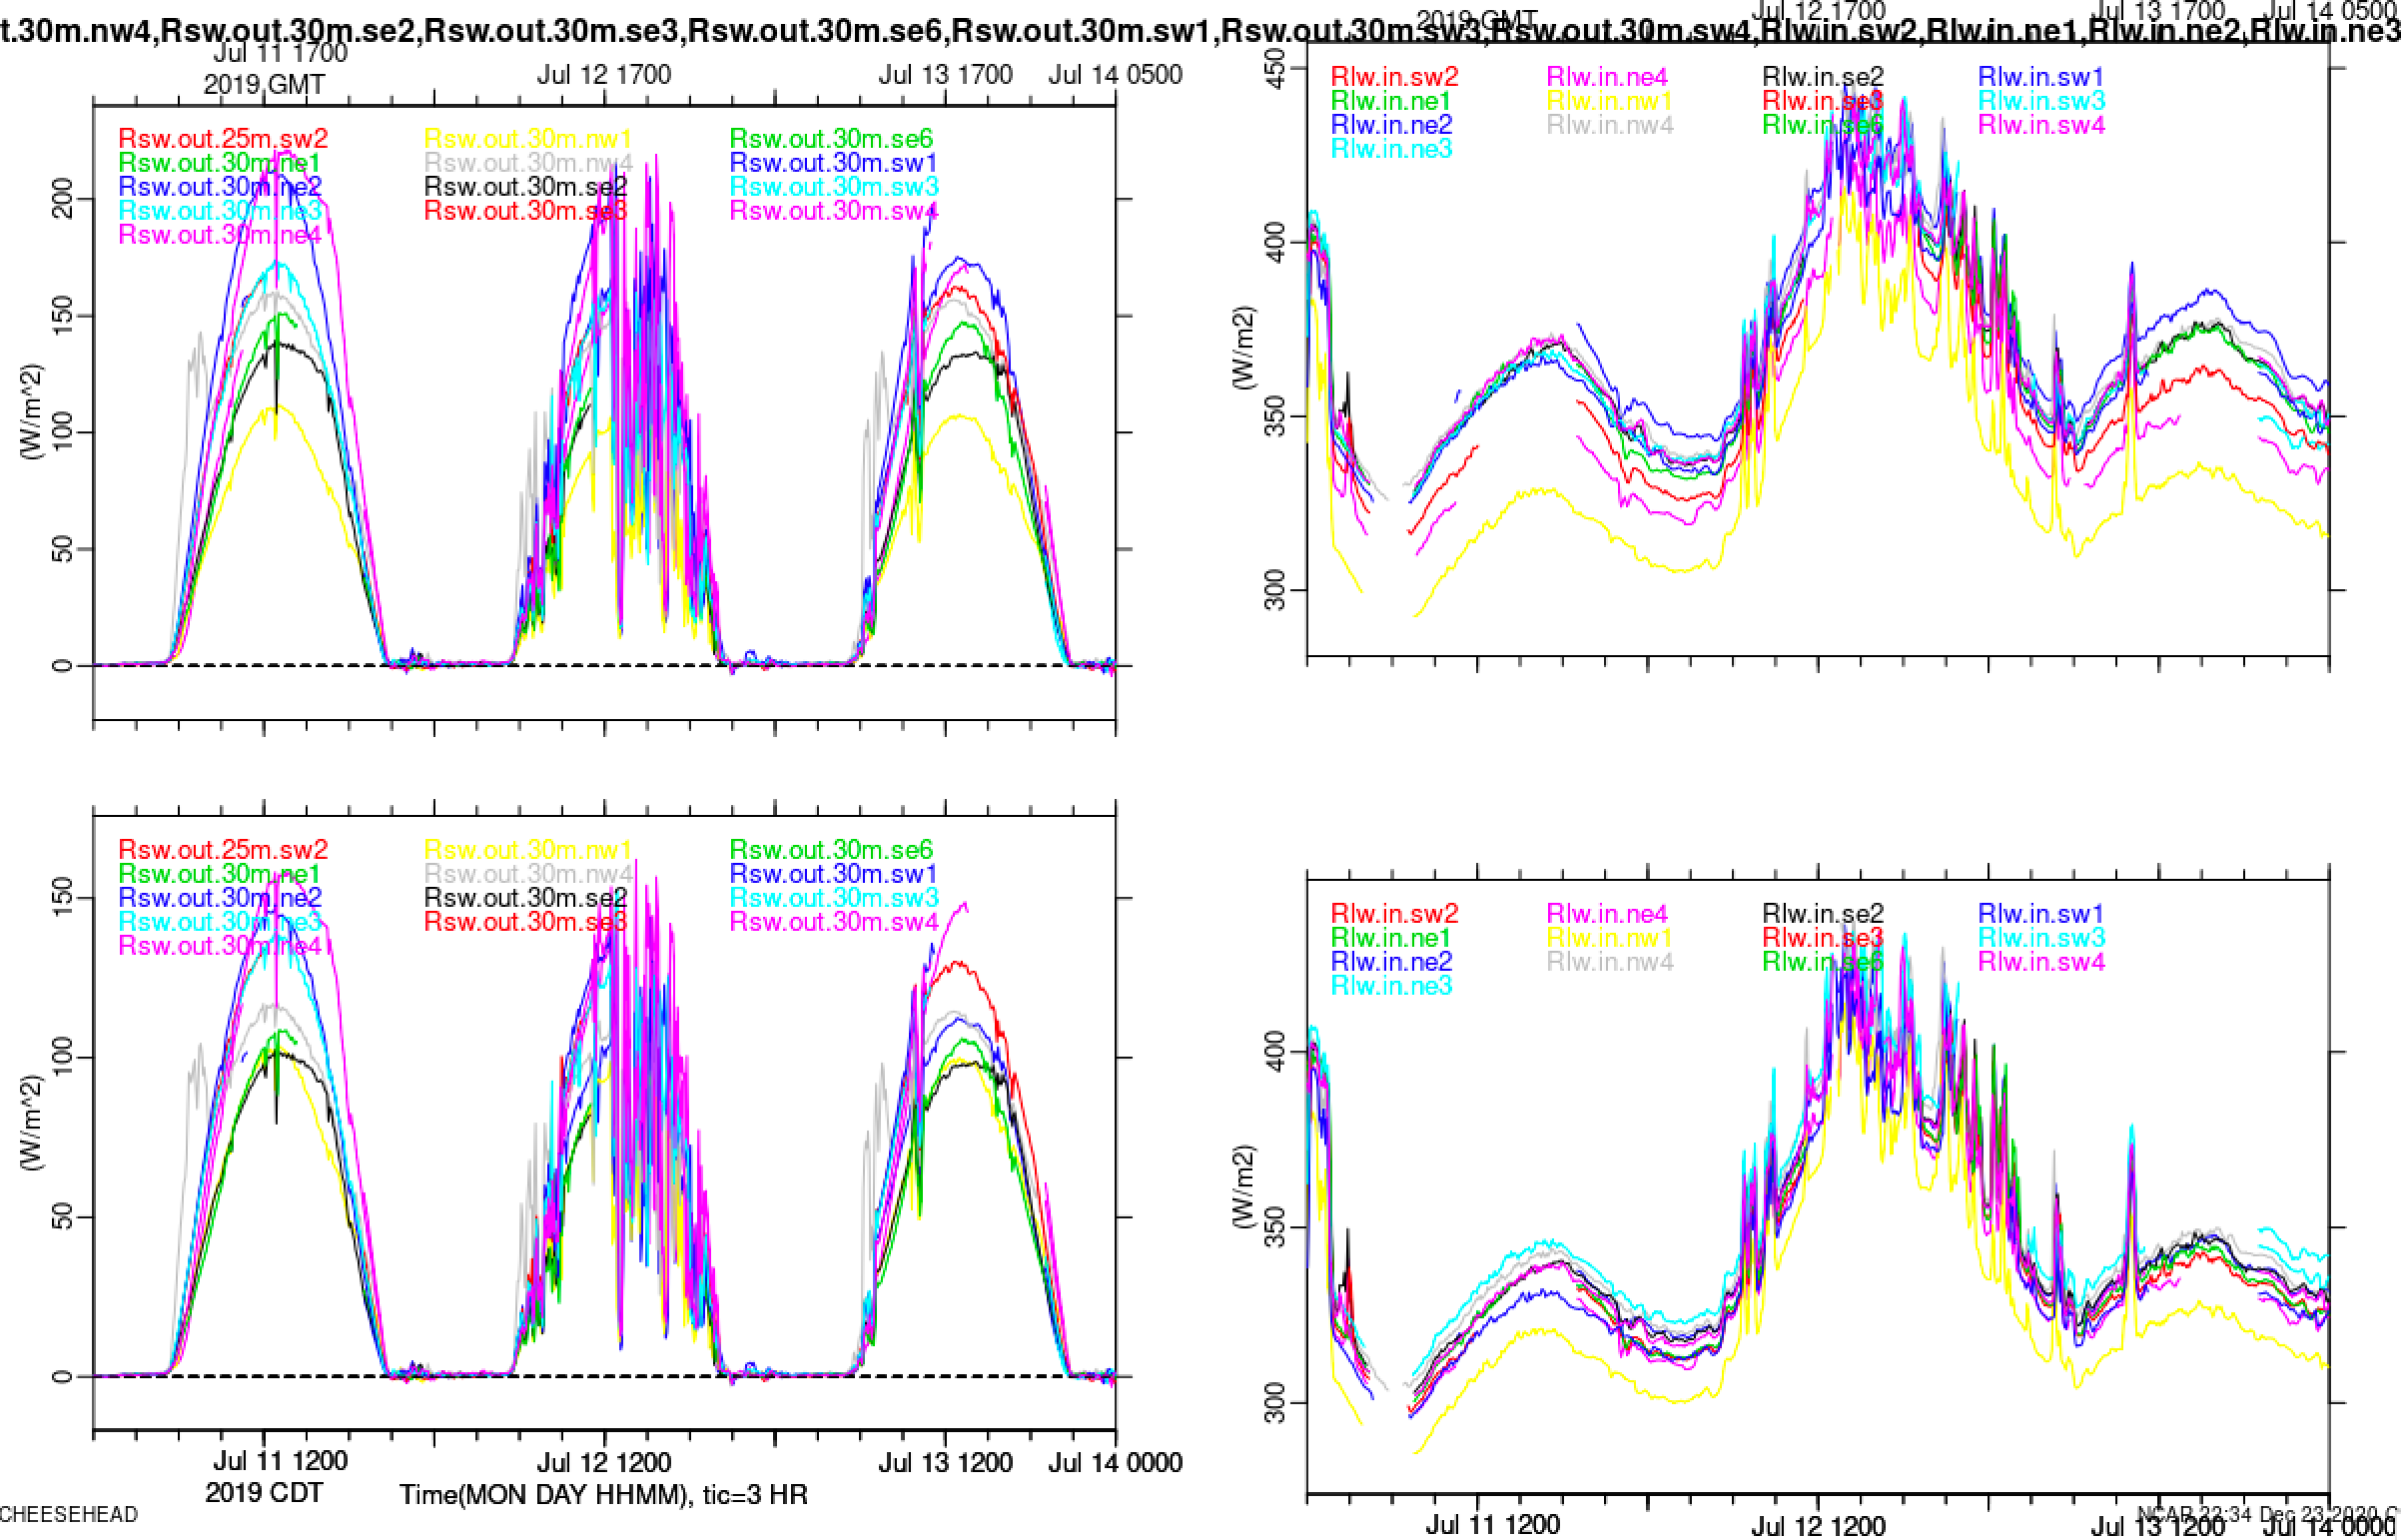
An error was discovered in the NR01 radiometer measurements. Coefficients provided by the manufacturer and unique to each sensor were swapped for the Rsw.out (outgoing shortwave radiation) and Rpile.in (radiant heat within the radiometer dome) parameters. This also affects the derived parameters Rlw.in (incoming longwave radiation) and Rsum (the total of all 4 components) - refer to https://www.eol.ucar.edu/node/1935 for the calculation. The plot below is a test example from the CHEESEHEAD campaign with the upper left Rsw.out and upper right Rlw.in before correction, and the bottom row after correcting for this switch.
Sensors with serial numbers greater than 14 are affected and require correction, i.e. apply the correct coefficients for Rsw.out and Rpile.in parameters and update the measured values, including derived Rlw.in and Rsum. Refer to the Table below for a list of the site, associated NR01 serial number, and whether corrections are required.
These measurements have been corrected for the 5-minute averaged data files (now version 2.0), and are available at the EOL Field Data Archive:
Flow Corrected (Planar Fit Technique): https://data.eol.ucar.edu/dataset/592.025
Laser multi-station (Leica survey equipment) scans: https://data.eol.ucar.edu/dataset/592.006
| Site | NR01 Serial Numbers | Change Date |
Requires Coefficient Correction? |
|---|---|---|---|
| nw1 | 30, 1 | 2019 10 01 15:12:44 | Yes, No |
| nw2 | 25 | N/A | Yes |
| nw3 | 13 | N/A | No |
| nw4 | 27 | N/A | Yes |
| ne1 | 26 | N/A | Yes |
| ne2 | 28 | N/A | Yes |
| ne3 | 12 | N/A | No |
| ne4 | 23 | N/A | Yes |
| sw1 | 21 | N/A | Yes |
| sw2 | 3 | N/A | No |
| sw3 | 20 | N/A | Yes |
| sw4 | 17, 8 | 2019 09 17 14:51:24 | Yes, No |
| se2 | 18 | N/A | Yes |
| se3 | 19 | N/A | Yes |
| se4 | 29 | N/A | Yes |
| se5 | 5 | N/A | No |
| se5 | 22 | N/A | Yes |
Sonic anemometers
These all operated as expected. Laser multistation scans were done once to determine the orientation with respect to gravity, which haa been used to rotate the data. Orientation to north ultimately was referenced to a hand compass, expected to be within 2deg. These multistation scans have also been used to tilt correct the data for the dataset labeled as Tilt Corrected (tiltcor). A separate, Flow Corrected (flowcor) dataset is also available that uses a planar fit technique to apply a tilt correction with respect to the flow through the sensor. Note that this flow correction was undefined for three sites due to thier locations either below the canopy (NW2) or along waterways (NW3 and SE4), each of which resulted in winds primarily from two opposing directions throught the campaign. Thus no correction has been applied to these sites for the Flow Corrected dataset. The table below gives the actual corrections applied to both datasets. Plots of these corrections are included in CHEESEHEAD_sonic_flow_correction_plots.pdf.
| Site | Height (m) | Vazimuth (deg) | Flowcor Lean (deg) | Flowcor Leanaz (deg) | Flowcor w offset (cm/s) | Tiltcor Lean (deg) | Tiltcor Leanaz (deg) | Notes |
|---|---|---|---|---|---|---|---|---|
| nw1 | 30 | 330.3 | 5 | 119.4 | 3.2 | 3.7 | 136.1 |
beginng to 18 Sep 12:10 CDT |
|
nw1 |
30 | 330.3 | 3.5 | 155.9 | 10.5 | 30.9 | -89.2 | 18 Sep 12:10 CDT to 24 Sep 12:30 CDT |
| nw1 | 30 | 330.3 | 5.3 | 112.6 | 1.6 | 3.8 | 146.8 |
24 Sep 12:30 CDT to end |
| nw2 | 10 | 2.1 | NA | NA | NA | 0.9 | 32 | undefined flow correction, so no tilt correction applied in flow corrected dataset |
| nw3 | 2 | 22.3 | NA | NA | NA | 2.1 | 81.9 | undefined flow correction, so no tilt correction applied in flow corrected dataset |
| nw4 | 30 | 344.4 | 6.4 | -2.6 | 8.4 | 1.4 |
90 |
|
| ne1 | 30 | 282.4 | 2.9 | 149.6 | 1.7 | 0.7 |
56.3 |
|
| ne2 | 30 | 330.7 | 0.5 | 160.3 | -1.1 | 1.8 | 135 |
beginning to 25 Aug 09:55 CDT |
| ne2 | 30 | 330.7 | 0.9 | 131.6 | -2.5 | 1.4 | 146.3 |
25 Aug 11:05 CDT to end |
| ne3 | 30 | 306.2 | 2.4 | -136.6 | -1.6 | 1 | 78.7 |
|
| ne4 | 30 | 312.9 | 4.5 | 111.1 | -2.7 | 3.7 | 157.6 |
|
| se2 | 30 | 345.4 | 4.7 | 65.6 | 4.2 | 3 | 113.2 |
|
| se3 | 30 | 48.8 | 2.5 | 51.1 | -1.4 | 2.4 | 77.7 |
|
| se4 | 2 | 7 | NA | NA | NA | 1.4 | 54 | undefined flow correction, so no tilt correction applied in flow corrected dataset |
| se5 | 10 | 339.2 | 4.7 | -36.4 | -1.9 | 2 | 32.9 |
|
| se6 | 30 | 353 | 1 | -65.4 | -0.8 | 0.7 | 164.1 |
|
| nw1 | 30 | 301.9 | 1.6 | 70.9 | -2.4 | 1.3 | 90 |
|
| nw2 | 25 | 27.8 | 0.8 | 75.2 | -2.2 | 1.5 | 28.3 |
|
| nw3 | 30 | 318.5 | 0.9 | -176.2 | -0.2 | 2.2 | 122.3 |
|
| nw4 | 30 | 345.4 | 4.6 | 119.6 | 3 | 2.4 | 131.6 |
|
The NE3 sensor was found in early July to be tilted, due to loose clamps, and was releveled. However, we appear not to have recorded data earlier, so no extra correction is required. A similar rotation occurred for the NW1 sensor in mid Sept. We have rotated these data, using a combination of the multistation scans and the planar fit tilt correction for the periods before and after the sensor orientation was adjusted. The SE4 sonic was initially mounted upside down and corrected in the end of August. This has also been corrected in the data. Finally, the SE5 sonic was replaced at the end of September due to large negative biases and bad data in H2O and CO2. These data have been rotated to correct this error.
We have added the variable w't' and corrected the variables w'h2o' and w'co2' using the WPL and spatial separation corrections as described here to the average statistics. We also have computed and added H and LE.
Infrared gas analyzers
These all operated as expected. Sensors were cleaned 2--3 times during the project, and no significant issues were logged. Data will be removed when flagged by the sensor itself, generally during times with rain.
Large biases developed during the project in both h2o and co2. We calculated differences between the T/RH sensor H2O values for the top or middle sensor at each site and the IRGA h2o values, smoothed over time, and removed these differences every hour from the h2o data. Noting that the h2o biases were smallest for site sw2, its co2 value was selected as the reference for calculating smoothed biases for the co2 measurements at each of the other sites.
Dew regularly formed on the IRGA optical windows at night. Early in the project, field staff enabled internal heating on the sensor, which helped, but some amount of dew formation still occured. These periods were identified again by comparing h2o to H2O values from the nearest T/RH, in this case not smoothing. Bad periods were defined by the difference being greater than 0.5 g/m^3. Data from booth h2o and co2 were removed during these periods, reasoning that dew on the optics would adversely affect both measurements. Application of this approach left amount of suspect data at the beginning and end of the bad periods. Many of these have been further removed by a simple threshold on h2o (3--20 g/m^3) and co2 (590--850 mg/m^3), though some likely bad values still remain.
Temperature/Relative Humidity
We used a mix of instruments with Micronel and Sanyo fans, the latter thought to be more reliable. There were a few failures of sensors with the Sanyo fans, primarily due to the new electronics that was used with them. Data when the fans are suspect will be removed in QC processing. Overall, very few spikes and anomalous data were observed. Other than data gaps due to connectivity/network issues and a bad lightning storm at the end of September, there was very little additional filtering required. We note sites where the TRH housing or sensor was replaced (i.e. bad sensor discovered), and minor data issues that have a possible known origin.
NE1 - Due to the broken motor pivet, continuous data at all heights start mid July.
NE3 - Sensor was replaced 07 Oct.
NE4 - Housing was replaced 19 Sept due to a broken fan.
NW1 - TRH at 10m and 30m was not available until 09 July. The TRH at 10m was replaced twice on 23 July and after a lighting storm on 30 Sept. TRH’s at 2m and 30m were also replaced after the lightning storm.
NW2 - Data were spotty until mid July, particularly at 10m, possibly due to connectivity issues since other sensors showed similar data gaps.
NW4 - TRH at 30m was power cycled several times when bad data was reporting, i.e. 180C, 0%RH.
SE2 - Housing was replaced 26 Aug due to a broken fan. The TRH at 30m was replaced on 22 Sept.
SE3 - TRH at 2m and 10 show intermittent data throughout the time series possibly due to network issues. Other sensors sharing the same power show similar data gap patterns. The TRH at 2m was removed and placed at 30m on 01 July until a replacement arrived 13 July, explaining the large data gap at the beginning of the time series.
SE5 - Housing replaced for TRH at 2m on 24 July. Eventually bug netting had to be added to the inlet to keep the fan running optimally.
SE6 - TRH at 2m was replaced on 27 Sept. TRH at 30m was replaced on 12 July.
SW2 - TRH at 25m was replaced 30 Aug.
SW3 - There is a significant data gap prior to 06 August for TRH at 10m. TRH at 10m was replaced twice on 07 Aug and 20 Aug.
SW4 - TRH at 30m was replaced 28 Aug.
Pre- and post-calibrations were done on most sensors in the EOL Calibration Laboratory: https://www.eol.ucar.edu/node/2652. Temperature oil baths were used to calibrate the T and the Humidity Generator to calibrate RH. Note that three constant temperatures were used to calibrate the RH; 10C, 20C, and 30C. All probes were within the expected error for T (+/-0.1C), relative to the Cal. Lab. reference. Most probes were within the expected error for RH (+/- 1%) with respect to the lab reference, except for a few notable exceptions summarized in the table below:
| Site | Height | TRH Serial No. | RH biases outside the +/- 1% expected error relative to reference |
|---|---|---|---|
| sw3b | 10m | TRH109 | For RH > 60%, bias within +1-2% |
| se2t | 30m | TRH112, TRH011 (replace 2019 09 22) | Bias within +1-2% |
| nw2 | 2m | TRH114 | For T > 10C, bias within 1-2% |
| sw4t | 30m | TRH115 | For constant T=29C, bias just above -1%. For RH>60% at constant T=10C, bias within -1% and -2% |
| se6b | 2m | TRH117 | For RH > 65% at constant T=10C & 20C, bias within 1-1.5% |
| nw4t | 30m | TRH118 | Large RH bias increases to a maximum ~ +3.5% at RH=80% |
| se6t | 30m | TRH123 | Bias is asymptotic. Use with caution. |
| nw1t | 30m | TRH129 (replaced 2019 10 01) | Mean bias ~ -2% |
| se4 | 2m | TRH29 | Bias within -1% and -2% |
| se5 | 10m | TRH31 | Bias increases linearly. Use with caution. |
| se2b | 2m | TRH34 | Bias increases linearly. Use with caution |
| se5 | 2m | TRH4 | For RH > 50%, bias decreases down to max -4% at constant T=10C |
| sw2 | 25m | TRH58 (replaced 2019 08 30) | Bias ~ 2% |
| nw1b | 10m | TRH60 (replaced 2019 10 01) | At constant T=10C, RH bias decreases linearly to -4%; at constant T=20C, 30C RH bias ~ -2% |
Pressure
All barometers were PTB-210. One at NE3 failed and was replaced, with no data available 26 Jun -- 13 Jul (but the tower wasn't erected during this period anyway). Pressures from these sensors were used to determine when towers were lowered for maintenance. These periods have been removed from the data.
Soil sensors:
One soil plot was instrumented at each tower site, in an area thought to be representative of the fetch. At least the NE3 site had animal-related damage (wires cut), resulting in some data loss - all sensors were replaced and moved to an undisturbed location. The flooding at SE4 mentioned above resulted in odd data, as the water flowing through the soil plot (in essentially a vegetation mat), caused horizontal heat transfer. This heat transfer is not captured by our measurements and thus energy balance closure will be very strange. Mid-September TP01 and tsoil was not responding at site SW2 and had to be replaced when it was discovered that the mote had water in it.
Due to our inability to air-ship sensors from RELAMPAGO, soil sensors at several sites were not installed until about a month into the project.
Temperature Profile: Mostly operated normally. Tsoil.4.4cm.se2 failed shortly after installation and was bad until being replaced late Sep. Probe failures also occured at ne3, sw1, sw2, and sw4. All these data have been removed.
Moisture: Decagon (now METER) EC-5 probes were installed at each site. Three rounds of manual gravimetric measurements were taken during the project, from which in-situ calibrations were generated (along with soil dry bulk density values). Biases of 0--20% were generated from these calibrations that were applied to the data. Soil moisture at both wetland sites always read quite high (<50%), in a regime that the manufacturer states is expected to respond quadratically, rather than linearly. It isn't obvious to us how to create such a calibration, so we simply note that these sites likely were close to saturation continuously.
Data were removed at the beginning of the project when it was obvious that the probe was still settling into the soil disturbed by installation.
Heat flux: Operated normally, though readings are strange at the wetlands sites during flooding.
Thermal properties: Most sites operated normally, though readings are strange at the wetlands sites during flooding. The TP01 sensor at sites NE3 and NE4 are believed to have been installed incorrectly. We came to this conclusion based on the extreme lack of variablility at these locations in Lambdasoil and Tau63 values relative to other sites. The sensor was replaced at NE3 in September, after which point the data look reasonable. Thus, we have removed TP01 data from the entire campaign at NE4 and until the sensor was replaced at NE3 in September.
We have added the calculation of heat capacity and surface heat flux (measured at 5cm plus the soil heat storage term) to the statistics, folllowing the procedure here.
Rain gauges:
Tipping bucket rain gauges were used at the 5 sites with clearings. NW2, SE4, and SW2 sites were found to be clogged at least once. These data will be removed, if possible. As much as possible, false tips have been removed. We note that these gauges were retired at the end of this project due to ongoing clogging issues.