 The BuFx campaign used CERES, MODIS, ASTER and AIRS/AMSU/HSB satellite data from NASA's Terra and Aqua platforms and GMS5 data for a time period of one year (June 2004 - June 2005) in the proposed research. The CERES data was used to examine differences in surface and top-of-the-atmosphere radiation budgets. The land surface data from MODIS, crucial inputs for the soil vegetation model within RAMS, was used to construct numerical modeling simulations for current and pristine land use scenarios. Differences in cloud formation and microphysics between agricultural and native vegetation areas were explored using MODIS and GMS5 data. MODIS and ASTER data was used to examine surface energy, moisture fluxes and soil moisture as a function of land use. The BuFex team used TRMM data to examine precipitation associated with cloud systems influenced by land use. MODIS retrieved cloud particle size that was used to detect the presence of drizzle in cumulus clouds. Satellite retrieved soil moisture will also be used to initialize the soil model in the RAMS. They use AIRS/AMSU/HSB satellite data to study differences in atmospheric thermodynamic profiles over regions of contrasting land use.
![]() CERES data was used to examine the effect of land use on top-of-the -atmosphere and surface clear sky radiation budgets. CERES products include both reflected solar and Earth emitted radiation at the top-of-the-atmosphere. Surface shortwave and longwave fluxes will be derived from the CERES top-of-the-atmosphere observations using Langley parameterized shortwave/longwave algorithms (Gupta et al, 1992; Gupta et al., 2001). These algorithms use atmospheric temperature and humidity profiles derived from European Center for Medium Range Weather Forecasts (ECMWF) data and MODIS cloud masks created using the Interactive Visualizer and Image Classifier for Satellites (IVICS) software. A monthly global emissivity database was used to provide the emissivity data for the model.The seasonal variation of radiative energy flux components in combination with seasonal variation of NDVI derived from MODIS data will be used to quantify the effect of agriculture practices on the top-of-the-atmosphere and surface radiation budgets of this area.
CERES data was used to examine the effect of land use on top-of-the -atmosphere and surface clear sky radiation budgets. CERES products include both reflected solar and Earth emitted radiation at the top-of-the-atmosphere. Surface shortwave and longwave fluxes will be derived from the CERES top-of-the-atmosphere observations using Langley parameterized shortwave/longwave algorithms (Gupta et al, 1992; Gupta et al., 2001). These algorithms use atmospheric temperature and humidity profiles derived from European Center for Medium Range Weather Forecasts (ECMWF) data and MODIS cloud masks created using the Interactive Visualizer and Image Classifier for Satellites (IVICS) software. A monthly global emissivity database was used to provide the emissivity data for the model.The seasonal variation of radiative energy flux components in combination with seasonal variation of NDVI derived from MODIS data will be used to quantify the effect of agriculture practices on the top-of-the-atmosphere and surface radiation budgets of this area.
![]()
Moderate Resolution Imaging Spectroradiometer (MODIS) and Advanced Spaceborne Thermal Emission and Reflection Radimeter (ASTER) satellite data was utilzed for retrieval of surface energy and moisture fluxes. The MODIS data, available twice daily, was used to examine seasonal the variation of surface energy budget and soil moisture availability at 1km spatial resolution. ASTER data was available over the same location approximately every 16 days, and surface energy, moisture fluxes and soil moisture availability can be retrieved at 90m spatial resolution. They used the triangle method of Gillies et al. (1997) for satellite retrievals of surface energy and moisture fluxes. Their preliminary work suggests that this technique, which has been validated over other geographical areas, performs adequately in the proposed study region (Ray et al., 2003). However, they planed to conduct a rigorous validation of this technique by comparison against the in situ surface flux and soil moisture measurements. They compared point in situ measurements of sensible heat, latent heat flux and soil moisture availability from the Bowen ratio system and the flux tower against corresponding values retrieved from co-located ASTER data. The averaged values of energy, moisture fluxes and soil moisture availability retrieved from ASTER pixels located within a 1km MODIS footprint were compared against the MODIS retrievals for that pixel.
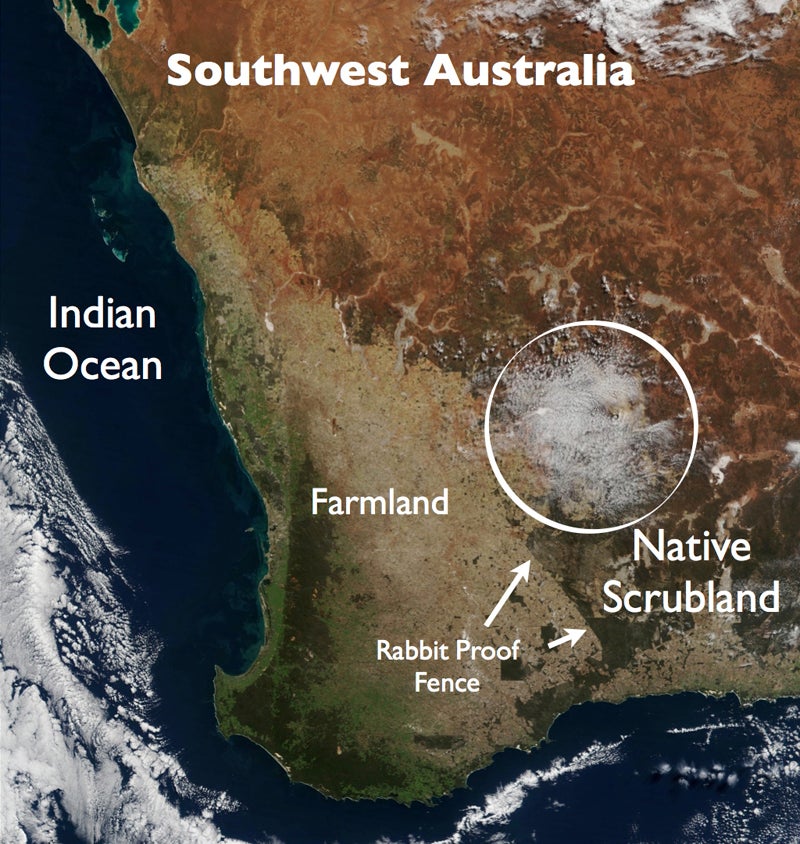
One of the main goals of this study was to explore how land use and landscape heterogeneity influence cloud formation and impact regional hydrology. For this purpose, meteorological and satellite data was utilized to identify situations where land use and landscape heterogeneity may be influencing cloud formation. Examples of such situations included those days in summer when clouds form mostly over native vegetation, days in winter when this behavior is reversed with clouds forming over the agricultural area and when mesoscale convective systems form almost directly over the bunny fence region. The first two categories result from variations in boundary layer development between agricultural and native vegetation areas. The landscape heterogeneity is the potential cause for the third category situation. They quantified how often such situations occur and also the amount of precipitation associated with the cloud systems. This enabled them to observationally quantify the effect of land use on the local hydrology.
Read more about the satellite observations that helped to support the BuFex campaign.
