
Overview
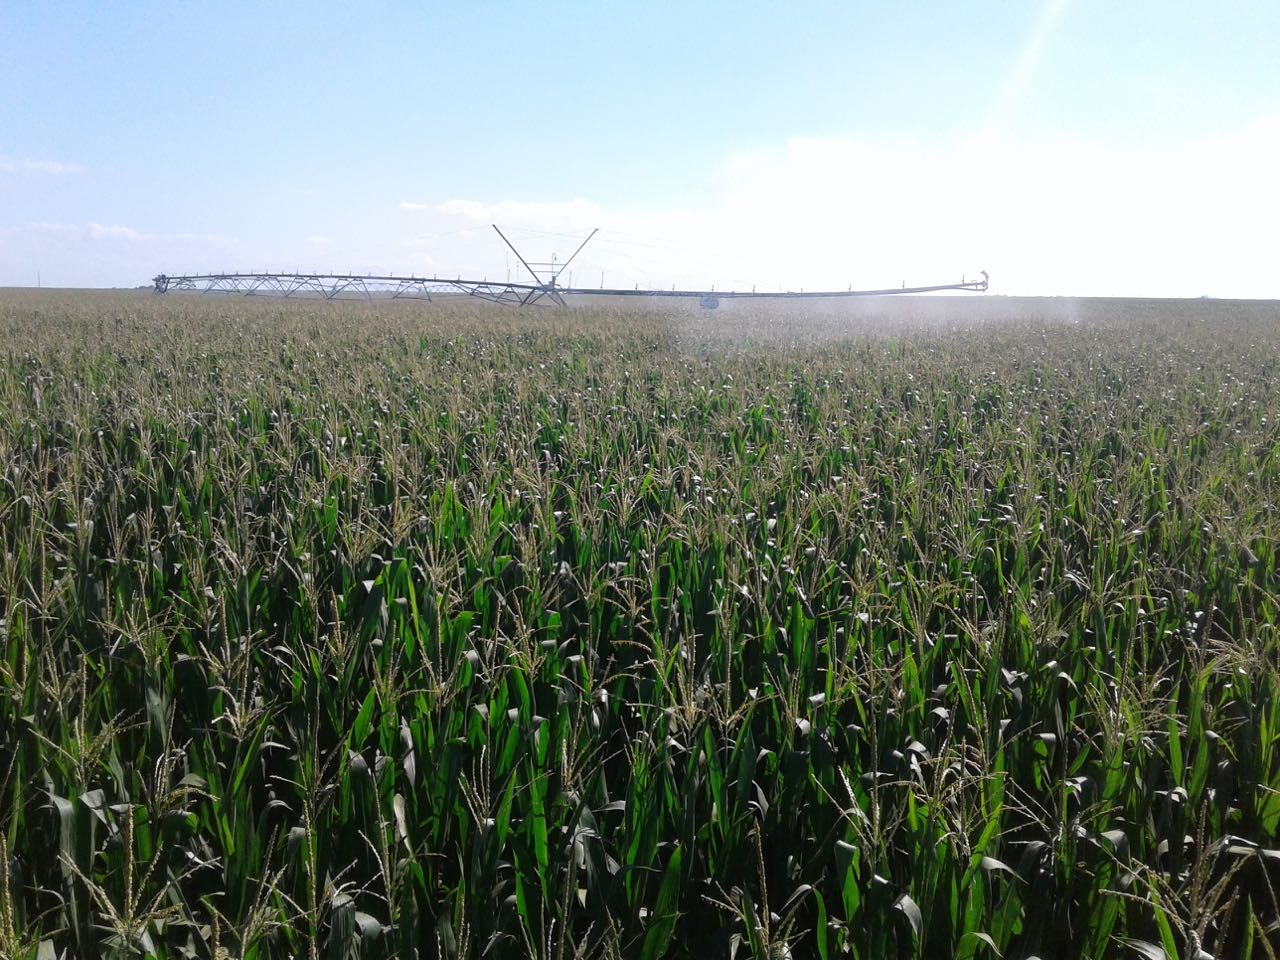
ISFS had 12 stations during GRAINEX, with the primary task to measure evapotranspiration (ET) representative of both irrigated and non-irrigated agricultural fields (corn and soybeans). Secondary goals were to measure other components of the water budget (precipitation and soil moisture), weather, and the total surface energy balance. The focus of GRAINEX was on two intensive periods, 30 May -- 13 June and 16--30 July. The sites collected data between these periods, though several stations had some type of failure during the period, primarily due to blockage of RF transmission as the corn grew and animal activity.
Document Version Control
| Version | Date | Author | Description |
|---|---|---|---|
| 1.0 | 29 May 2019 | Oncley, Paulus | Initial release |
| 2.0 | 28 April 2021 | Paulus | Corrected radiometer data for all sites |
Sites
There were 12 sites, arbitrarily numbered from west to east. Sites 1--6 were on pivot-irrigated fields, supplied from the Oglalla acquifer and Sites 7--12 were on non-irrigated fields.
| Site | Nearest Town | Latitude (deg N) | Longitude (deg W) | Fetch North | Fetch South | Flux Sensor Height (m) | Barometer |
|---|---|---|---|---|---|---|---|
| s1 | Benedict | 41.009669 | -97.541247 | corn (rad) | 6 | PTB220 | |
| s2 | York | 40.879614 | -97.541887 | soy (rad) | soy | 6 | PTB220 |
| s3 | Exeter | 40.66228 | -97.48460 | corn | corn (rad) | 6 | PTB220 |
| s4 | Beaver Crossing | 40.77854 | -97.33173 | soy | corn/soy (rad) | 6 | PTB220 |
| s5 | Friend | 40.662223 | -97.333542 | corn | corn (rad) | 6 | PTB220 |
| s6 | Wilber | 40.458504 | -97.028949 | corn (rad) | 6 | PTB220 | |
| s7 | Loma | 41.135725 | -96.974423 | corn/grass (rad) | soy | 4.5 | PTB220 |
| s8 | Panama | 40.57374 | -96.461773 | corn (rad) | corn | 6.5 | PTB220 |
| s9 | Elmwood | 40.82380 | -96.33517 | corn | corn (rad) | 6.5 | PTB220 |
| s10 | Unadilla | 40.645905 | -96.271274 | soy | corn (rad) | 6.5 | PTB210 |
| s11 | Unadilla | 40.693200 | -96.223161 | corn | soy (rad) | 4.5 | PTB220/Nano |
| s12 | Cook | 40.483095 | -96.202562 | soy | corn (rad) | 5.5 | Nano |
Instrumentation
All ISFS sites had nearly identical instrumentation. Three types of barometers were used (PTB220, PTB210, and nanobarometers), due to limited available sensors. The height of the sonic anemometer at each site was chosen to be sensitive to the fetch either closer to or further from the mast. The sensor heights were not changed during the project, causing the fetch to move closer to the mast as the crop (mostly corn) grew. With the taller corn in July, many of the TRH sensors measured inside the canopy and the radiometers were below the top of the canopy.
| Sensor | Model | Measurement | Height |
|---|---|---|---|
| 2D sonic anemometer | Gill WindObserver | Horizontal wind speed/direction | 10m |
| 3D sonic anemometer/Infrared gas analyzer | Campbell CSAT3A/EC150 | Fluxes of momentum, sensible&latent heat, carbon dioxide | 4--7m |
| TRH | NCAR TRH | Temperature/Relative Humidity | 2m |
| Barometer | Vaisala PTB220,PTB210; Paroscientific Nanobarometer | Pressure | 2m |
| Tipping Bucket | MRI | Rain | 1m |
| Integrated radiometer | Hukseflux NR01 | 4-component radiation | 2m |
| Tsoil | NCAR Tsoil | Soil temperature profile | 0--5cm |
| Qsoil | Decagon EC-5 | Soil moisture | 2.5cm |
| Gsoil | REBS HFT | Soil heat flux | 5cm |
| Thermal properties | Hukseflux TP01 | Soil heat capacity | 2.5cm |
2D sonic anemometer
These worked as expected -- no action was needed in post processing.
3D sonic anemometer
Anemometers at s5, s6, and s7 (and maybe s3?) claimed to have weak signals causing the sensor to report no data for long periods of time. In some cases, this was fixed by swapping in spare anemometers, in other cases it fixed itself for a while. We later learned that this was due to an internal parameter in the anemometer being set too conservatively by the factory -- an issue that since has been addressed. No action is possible in post-processing, since the data that are missing are gone.
H2O/CO2 gas analyzer
One sensor's (s6) heater was misconfigured during the first part of IOP1, causing it to reset about every 3 minutes with a resulting loss of data. Also, this instrument was set to use a fixed temperature of 25C, instead of the real air temperature, to compute density, until fixed on 11 Jun. (It is a bit mysterious why h2o and co2 values did not change after the temperature was corrected.) . Once the correct heater parameter was set on 12 Jun, this worked well along with the rest of the stations. The s6 data have been left in the archive, but should be used with caution. No action was done in post processing.
TRH
The TRH fan at s11 was found to be out at least between 4-7 Jun, the housing was replaced on 7 Jun, but we were unable to see any clear indication of this effect on the data and how long the fan had been out prior to 4 Jun. As such, we have retained the data during this entire period. During teardown, the TRH fan at s11 was found to be off again, however this impact was clearly evident and the data was removed after 29 Jul at 6 CDT. Other than these small issues, the TRH's worked well. However, we note that the TRHs at many of the corn sites were measuring within the corn canopy by IOP2.
Barometer
These worked as expected -- no action was needed in post processing.
Tipping Bucket
Mice built nests in many of these sensors (causing extra or no tips) and the funnel became blocked at other sites, despite a modest amount of checking by field staff. Various other issues were noted by field staff during the project and removed from the data when possible. The tipping bucket at s3 was not measuring anything until 1 Jun, due to a piece of foam left in the bucket. Additionally, the tipping bucket at s2 was knocked over (presumably by the wind) and was fixed on 5 Jun, but it isn't clear when this happened. The same sensor was found tipped over again on 11 Jun, thus the data during this period may be unreliable. Lastly, the tipping bucket at s4 often reported much larger values than surrounding sites and had many false tips removed. It's possible these excess values are due to irrigation making it into the bucket, but it is not clear whether that was possible based on the siting of the instrument. It's more likely that the ball joint on the base was loose and allowed the bucket to sway in the wind, resulting in many extra recorded tips. Either way, these data are a bit suspect and should be used with caution.
Due to limited deployment location options (to avoid impacting farm operations), some gauges caught irrigation (s5) in addition to rain, while some did not. In one case (s3) it was noted that the corn blocked the tipping bucket from seeing irrigation during IOP2, thus the response to irrigation was time dependent. Thus, working through these data was difficult. For data QC, we have deleted data showing tips when the wetness indicator showed that no rain or irrigation should have been present (false tips due to wind or animal activity). This procedure could not be applied at s2, where the wetness data were missing (presumably, a connection issue), so we used the wetness values from s1 instead.
Integrated radiometer
These mostly worked as expected. They were cleaned at least once each IOP, though most were slightly dirty at teardown. Note that the corn grew to be above the radiometers (mounted at about 2.3m) at all corn sites except s8. Cleaning events were removed in post processing, along with times that the wetness sensor showed liquid water to be present.
The radiometer at s4 apparently developed a loose connection on 4 Jun that was fixed a day later. Data have been removed during this bad period.
Hukseflux NR01 Issue First Documented Dec 23, 2020
An error was discovered in the NR01 radiometer measurements. Coefficients provided by the manufacturer and unique to each sensor were swapped for the Rsw.out (outgoing shortwave radiation) and Rpile.in (radiant heat within the radiometer dome) parameters. This also affects the derived parameters Rlw.in (incoming longwave radiation) and Rsum (the total of all 4 components) - refer to https://www.eol.ucar.edu/node/1935 for the calculation.
The coefficient errors only impacted certain NR01's, but in this case that included all sites at GRAINEX. The effect of the errors were small, but these measurements have now been corrected for the 5-minute averaged data files (version 2.0 and later), and are available at the EOL Field Data Archive.
NR01 QC flagging issue corrected in Apr 2021
During the process of correcting NR01 coefficients it was discovered that a bad data removal filter was incorrectly applied to Rsw.in (incoming sortwave radiation) and Rpile.in (radiant heat within the radiometer dome) during the original data processing. This process is intended to remove periods of precipitation and dew, when the domes of the sensor are contaminated by moisture. In this case it resulted in most good data being thrown out and bad data passing through the filter. Additionally, no filtering was applied to the outgoing components of Rsw and Rpile, allowing bad data to be included in the original data release. Both of these issues have now been corrected in dataset versions 2.0 and later.
Soil sensors
These were problematic at several sites, mostly due to animals chewing on or disconnecting cables, along with mote communication issues noted below. At s10, the entire set was destroyed between IOP1 and IOP2, with only the heat flux plate with a stub cable and 3 of the 4 wisard boards left. Spare Qsoil, Gsoil, and TP01 sensors were installed at the beginning of IOP2, but a spare Tsoil was not available. We will be considering ways to harden these cables against animals in the future.
At s2, field staff noted a disconnected cable and reconnected it, not realizing that there were in fact 2 disconnected cables until teardown. Thus, the data from the Tsoil and TP01 have been removed for the entire period following the original disconnection.
During teardown, several of the sensors were found to be installed quite close to the corn plants and in 3 cases (need to look up), the sensors were embedded in the stalk roots. This installation will affect the reported values.
Tsoil: There were lots of bad data to remove in post processing, and 4 sites were not reporting Tsoil at all for most of IOP2. Data in the initial data release (preliminary) were off by a factor of 2, but this has now been corrected. In addition, s5's Tsoil probe lost a reference resistor on 12 Jun and reported values that were far from correct. We have recovered these values in post processing. S7 may have experienced a similar problem, although this hasn't been confirmed, on 29 Jul and the data after that date has been removed. Additional problems were noted in the 1.9 cm temperature at s12 beginning in June and lasting throughout the campaign. The cause of this issue has not been identified and the data have been removed from this release. A similar issue was identified at 1.9 cm depth at s9 from 4-22 Jul and those data were removed as well. Finally, Tsoil data at 4.4 cm depth at s9 were removed from several periods during the first part of the campaign.
Qsoil: No problems were noted, other than the general soil comments above. A few low values before 16:35 were removed after a replacement sensor was deployed at s12 on 13 Jun. 3 or 4 gravimetric samples were taken at each site, though the comparison at s10 will only have 2 samples to compare to each of the 2 Qsoil sensors that were deployed there. (Need to sort out these sensor changes in the gravimetric comparison)
Gsoil: More than half of the sensors were found to be reporting inverted values, as though the sensor was installed upside-down. However, during teardown all were found to have been installed correctly. Thus, the cause of this problem it is not clear. However, the data have been corrected.
Thermal Properties: No problems were noted, other than the general soil comments above.
Data Acquisition
Pi-2 based DSMs were used at each site, saving data locally on one USB stick and transmitting the raw data stream to Boulder via cell modems. The cell signal became blocked in July by thick corn at s3 and s5, which was overcome by installing an external cell phone antenna at these sites. The local USB sticks had complete data to recover from this blockage.
More serious was a mouse-chewed USB cable (to the WT41) at s5. This cut off the WT41 data at 0300 on 16 June and caused the Pi to shut down entirely (by corrupting the USB buss) at 1400 the same day. Since this was during the lull between IOPs, s5 data logging was not restored until pre-IOP2 servicing on 14 July. This was unfortunate, since the landowner had hoped to see data during a wind event about 4 July that flattened some of his corn.
WT41 Bluetooth transceivers (from SCP) were used to connect the DSMs to motes mounted on radiation/soil tripods within the fields. This connection sometimes failed. Some WT41s stopped connecting to the DSM via USB during IOP1 and had to be replaced. Before IOP2, the Bluetooth signal became attenuated by the corn. At s1 and s3, the mote was remounted to be above the corn to restore this connection. Soil and radiation data were lost while this connection was broken. A few motes themselves did not behave normally after having Bluetooth issues and were replaced. At some sites, the motes were set to save the data locally after this problem was detected, which enabled the data to be recovered at s9.
This was the first use of our 2018-version wisard boards for soil and some NR01 sensors. All worked as designed.
