High Time-Resolution Wind Profiling with the NCAR/ARM MAPR
Stephen Cohn, NCAR/ATD
Chris Holloway, Institute of Telecomm. Science/NTIA
Richard J. Doviak, NOAA/NSSL
Introduction
Included as goals of ARM are the measurement of turbulent fluxes. Remote sensing has the advantage of characterizing these transports, such as sensible heat and momentum fluxes, as a function of height through the boundary layer. These fluxes are of first order importance in cloud forcing for single column modeling studies and for both initializing and evaluation ARMS's other modeling efforts.
The NCAR/ARM MAPR (Multiple Antenna Profiler) was developed with the objective of using new spaced antenna techniques to meet these goals. Presented here are results from the past year including high time-resolution winds (less than 30 seconds) validated in an in situ sonic anemometer, and unique full vector wind observations of a jet associated with the melting layer during rain.
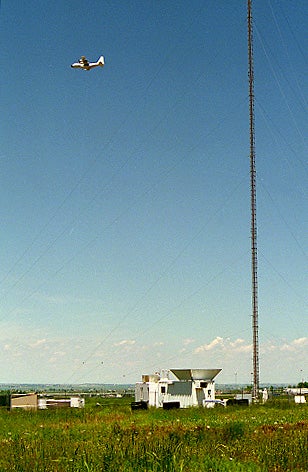
The MAPR participated in two field deployments in 1995. The first, in May, was next to the 300 m tower of the Boulder Atmospheric Observatory in Erie, Colorado (Figure 1).The tower was equipped with both sonic and propeller anemometers at several heights, allowing for direct validation of the remotely sensed winds. The second deployment in September, was near Bramen, Oklahoma, north of the central facility within the ARM CART site. These measurements were within a well characterized environment which will aide in their interpretation. In the course of this experiment observations were made showing boundary layer growth with good sigma to noise ratio, the passage of a strong cold front, an unusual gravity wave event (1 to 4 mb pressure changes lasting over several hours) and several nights of bird migration.
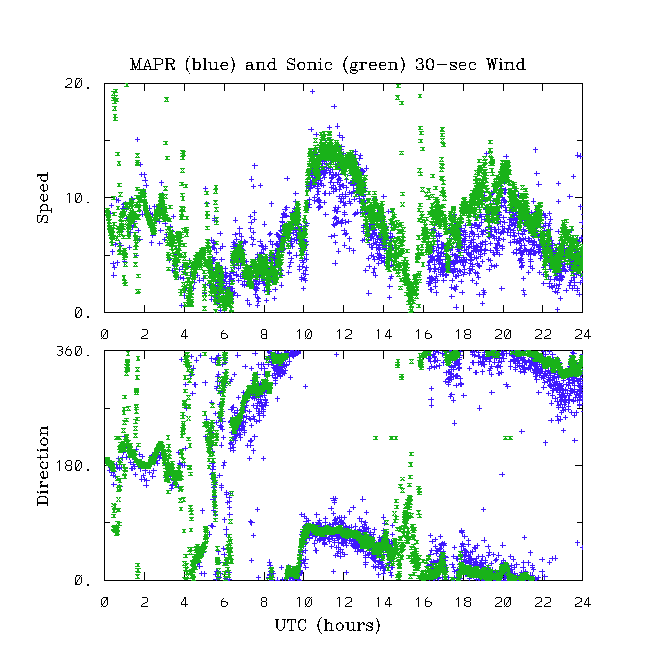
Comparison with Tower Winds
The plots in Figure 2 compare in situ winds measured on the BAO tower at 300 m with MAPR winds. Sonic anemometer measurements collected at 10 Hz were averaged to 30 seconds. MAPR winds are at 28-second intervals. Spaced antenna wind measurement techniques are described in the references. The MAPR winds were calculated using the lag of the auto-correlation and cross-correlation intercept. This dataset was collected on May 17, 1995, during rain of varying intensity. Gaps in th sonic data are present when rain interfered with its operation.
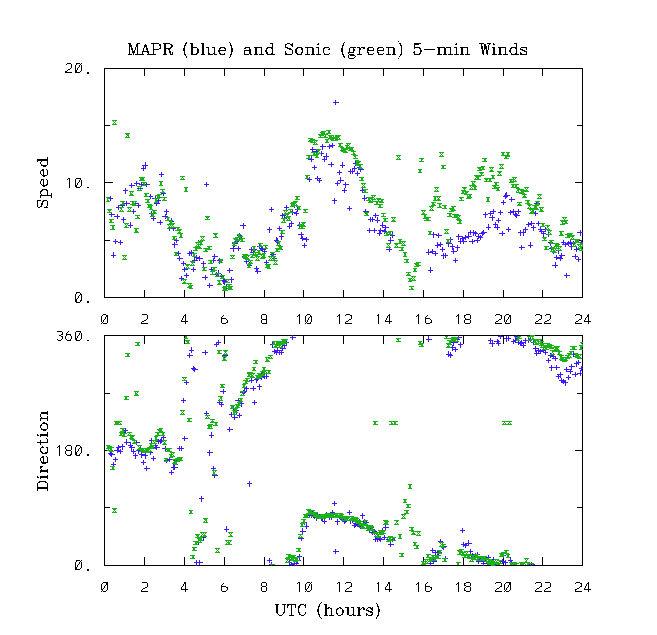
The plots in Figure 3 show the same data, but smoothed with a 5-minute median filter. These comparisons show good agreement between the averaged MAPR horizontal wind measurements and in situ data (rain-induced biases in the sonic anemometer data account for much of the visible discrepancies). However, the variability of the measurements are quite different. Theoretical predictions of the variance of spaced antenna measurements show the observed scatter to be about 3-times larger than expected. The source of this discrepancy is currently being investigated.
High Resolution Observations of a Jet and the Melting Layer
The high SNR of rain echoes made May 17, 1995 a good day for MAPR vector wind profiling. On this day spaced antenna data were collected surrounding a cold front passage, and a surprising wind maximum (jet) was observed. This maximum was apparently closely associated with the melting level (radar bright band), the height of at which snow or graupel aloft begins to melt into rain. The tower validation of the MAPR and radiosondes on the same day lead us to be confident that this jet in horizontal wind speed is true, and not an artifact of the strong reflectivity gradients or decorrelation within the melting layer.
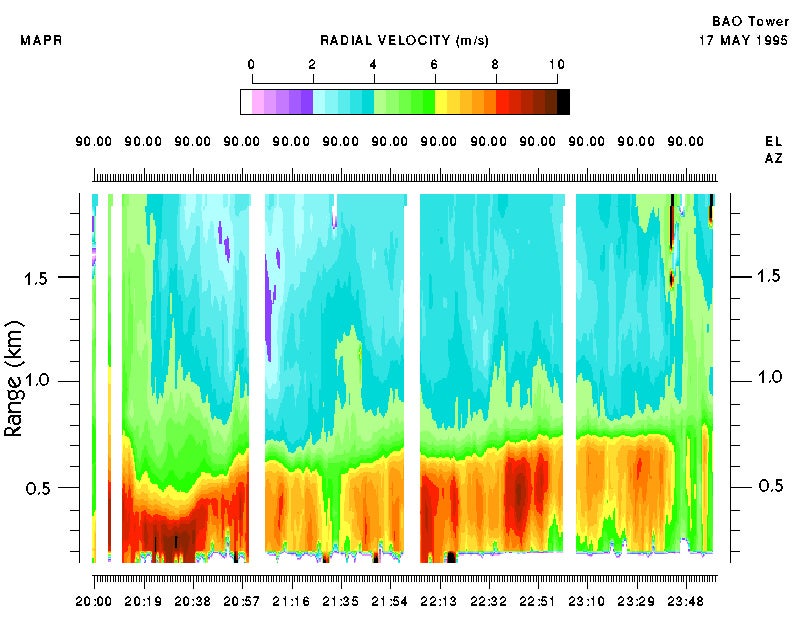
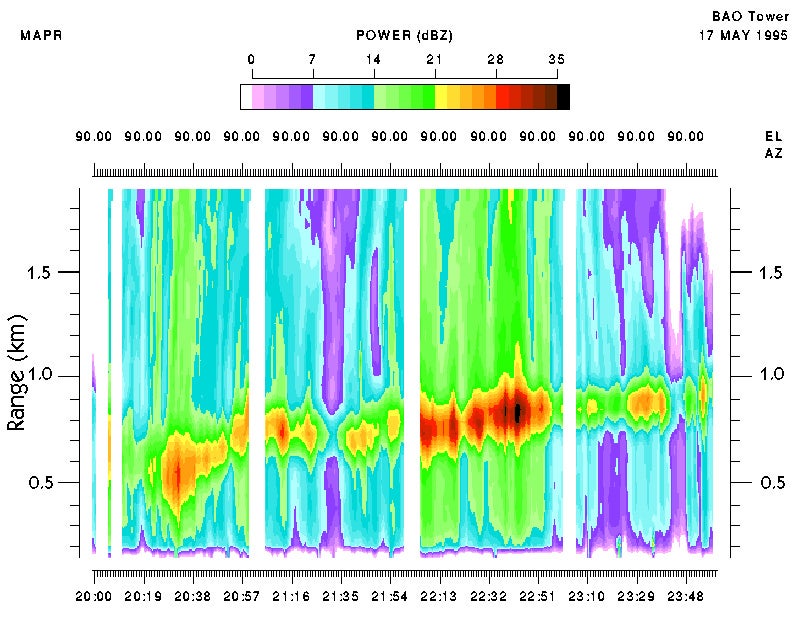
A series of products measured on May 17, 1995 is presented. The plots show 4 hours of data, from 20-24Z.
The plot of vertical velocity (radial velocity from the vertical beam, Figure 4) shows rain falling during the entire 4 hour period. Missing data occurred for 5 minutes every hour when RASS temperature profiling was in progress. The downward transition in fall speeds from blue to green to red (1 m/s to 8 m/s) is caused by snow melting into rain. The plot and the power plot in Figure 5 use 30-second time integration and the quantities (reflectivity and fall speed) can be obtained from a standard DBS profiler, as well as MAPR. The power plots shows radar reflectivity (dbZ). The radar brightband (associated with the melting layer) is seen as the dark red and black band between 0.5 and 1 km.
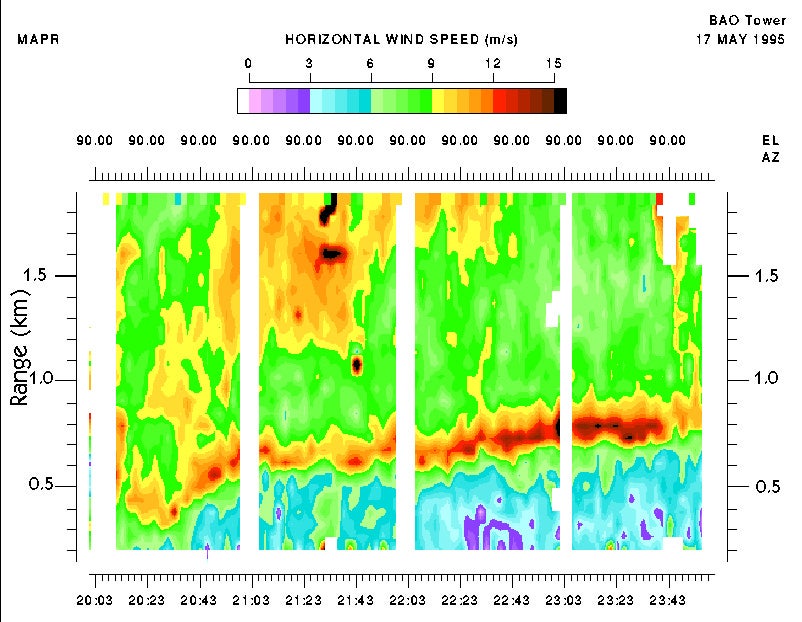
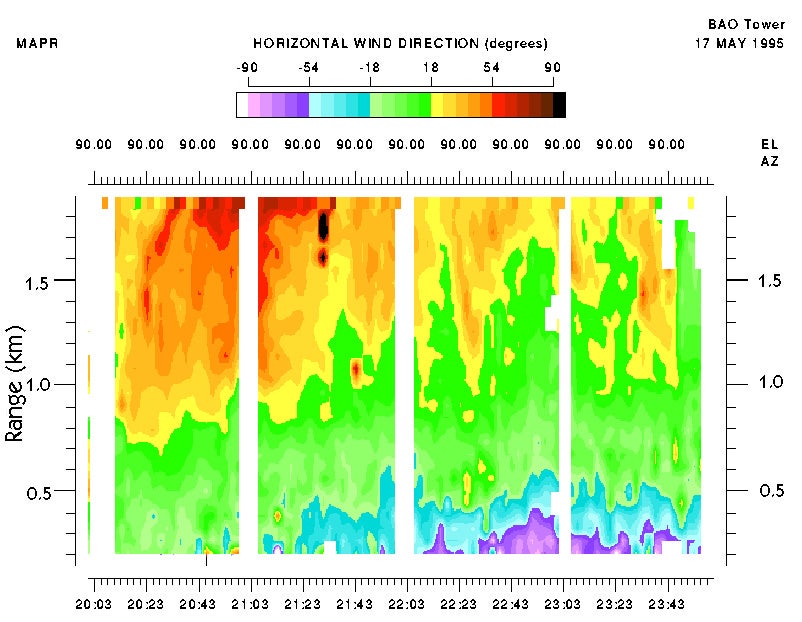
Figure 6 and Figure 7 show the horizontal wind speed and wind direction measured by MAPR. This data has a time resolution of 2.5 minutes, and altitude resolution of 60 m. Some averaging in time was necessary to improve the measurement precision. This plot is a good illustration of the high resolution wind measurements possible with MAPR. A standard DBS wind profiler could not provide this data.
The horizontal wind speed shows a strong jet rising from 0.4 km at 20:30Z to 0.8 km at 24Z. This jet has wind speeds of 10 to 15 m/s. It's most interesting characteristic is that the jet occurs immediately below the height of the radar bright band. An explanation for the formation of this jet and its association with the bright band is suggested in Atlas et al. (1969). They postulate that the isothermal layer created by melting snow causes a pressure perturbation. Air is accelerated by this perturbation, remaining in a gradient balance between the perturbed pressure and the Coriolis acceleration, creating the jet. With the 2.5 minute resolution measurements we not only observe the jet but also see considerable structure within the wind speed. We will continue to investigate this dataset and the interesting jet. It is just one example of the detailed structures we expect to see with the MAPR.
Conclusion
The past year has seen significant development in several areas of the NCAR/ARM MAPR, but most significantly in validation of wind measurements:
- Two field deployments, to the Boulder Atmospheric Observatory and to the ARM CART site, provided a wealth of raw data for validation and analysis.
- Theoretical development continued, yielding alternate methods to estimate winds from the cross-correlation of spaced antenna signal, and predicting the accuracy of the estimate.
- Validation against tower-mounted sonic anemometer shows good agreement in wind speed and direction. However, the variance of the MAPR wind measurement was large compared to the sonic wind and to theoretically expected values.
- Measurements in rain show details of structure in the vector wind with 2.5 minute resolution. The techniques have not been demonstrated in the low SNR clear air returns.
- Estimates of turbulent parameters such as eddy dissipation rate show promise.
- Software modifications have been initiated that will lead to real-time calculations of wind.
References
Atlas, D., R. Tatehira, R.C. Srivastava, W. Marker, and R.E. Carbone, 1969: Precipitation-induced mesoscale wind perturbations in the melting layer. Quar. J.R. Met. Soc, 95, 544-560.
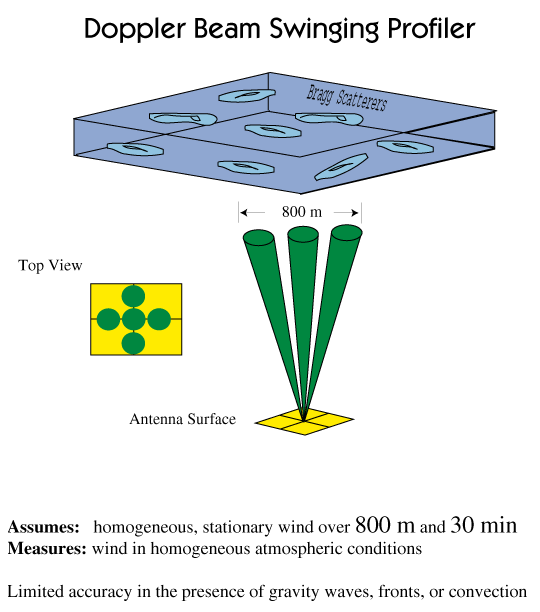
Additional Information - MAPR Shematics
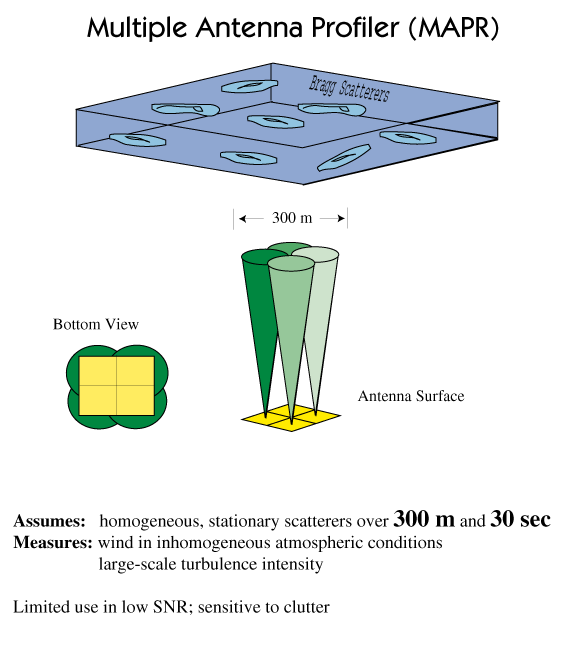
MAPR uses spaced antenna analysis techniques (Figure 8), observing motion of the diffraction pattern at the surface. This is fundamentally different than Doppler Beam Swinging Analysis (Figure 9), which combines radial wind measurements to observe the horizontal wind.


