HIAPER Cloud Radar (HCR)
Science
The HIAPER cloud radar (HCR) is an airborne, polarimetric, millimeter-wavelength radar that serves the atmospheric science community by providing cloud remote sensing capabilities to the NSF/NCAR HIAPER aircraft.
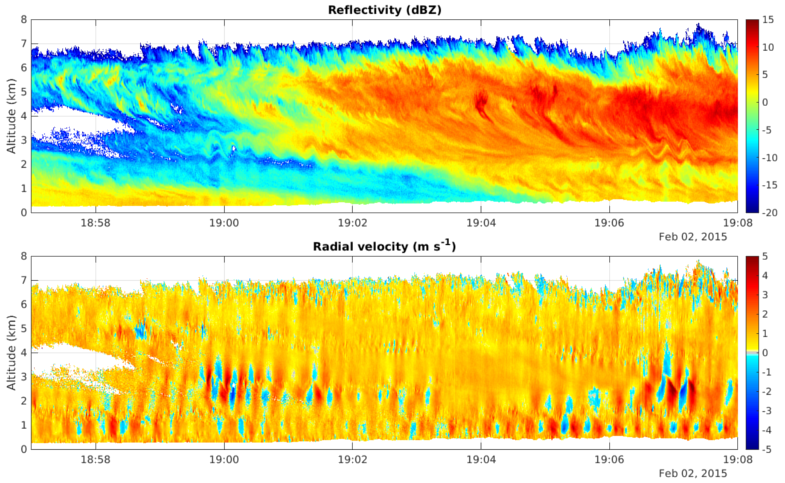
HCR provides unique observations of the formation and evolution of clouds. Its high sensitivity allows for the precise detection of liquid and ice clouds, aiding our understanding of the effects of clouds on the regional and global weather and climate. Derived scientific products, such as melting layer altitude, convective and stratiform echo type, or hydrometerorparticle identification, provide additional information on the observed cloud and precipitation processes.
Technical description
In a pod-based design a single lens antenna is used for both transmit and reception. The transceiver uses a two-stage up and down conversion super-heterodyne design. The transmit waveform, from a waveform generator, passes through the two-stage up-conversion to the transmit frequency 94.40625 GHz. It is then amplified by an extended interaction klystron amplifier (EIKA) to 1.6 kW peak power. System performance on transmit and receive paths is closely monitored using a coupler and a noise source. Both computed moments (reflectivity, velocity, spectral width, etc.) and raw in-phase and quadrature time series data are archived in HCR.
Data
HCR data are available in the EOL Field Data Archive.
Publications
- Vivekanandan, J., and Coauthors, 2015: A wing pod-based millimeter wavelength airborne cloud radar. Geoscientific Instrumentation, Methods and Data Systems, 5, 117-159, https://doi.org/10.5194/gid-5-117-2015.
- Romatschke, U., Dixon, M., Tsai, P., Loew, E., Vivekanandan, J., Emmet, J., Rilling, R. 2021: The NCAR Airborne 94-GHz Cloud Radar: Calibration and Data Processing. Data, 6, 66. https://doi.org/10.3390/data6060066
- Romatschke, U. Melting Layer Detection and Observation with the NCAR Airborne W-Band Radar. Remote Sens. 2021, 13, 1660. https://doi.org/10.3390/rs13091660
- Romatschke, U., Dixon, M., 2022: Vertically Resolved Convective/StratiformEcho Type Identification and Convectivity Retrieval for Vertically Pointing Radars. Journal of Atmospheric and Oceanic Technology, 39, 11, 1685-1704. https://doi.org/10.1175/JTECH-D-22-0018.1.
- Romatschke, U., Vivekanandan, V., 2022: Cloud and Precipitation Particle Identification Using Cloud Radar and Lidar Measurements: Retrieval Technique and Validation. Earth and Space Science Open Archive, https://doi.org/10.1002/essoar.10510625.1.
Noise source calibration
As an external, pod-mounted system, which is deployed in a wide range of altitudes from near surface to approximately 40,000 feet, HCR experiences large temperature variations. To maintain good system calibration, it is essential to monitor the radar system performance versus temperature. In order to ensure operational accuracy, a number of noise source calibration (NSC) events are performed during research flights and on the ground. During each NSC event, a known noise signal, which is invariant to temperature changes, is injected into the radar and then used to characterize the receiver gain changes by comparing the received power (DBMVC) to a temperature-corrected noise power.
As the low noise amplifiers (LNAs) are usually the components that dictate the receiver’s performance, they are outfitted with heater circuits to maintain their temperatures between 37 and 40 C in the bench test environment. During deployment, as the heaters cycle on and off, the received power level (DBMVC) directly correlates to the temperature fluctuations, leading to a sinusoidal pattern when installed in the system. In some extreme cases, the heaters of the LNAs cannot keep up with the heat loss to the environment, leading to a significant decline of the received power. Using the correlation between the LNA temperature and the received power level during the NSC events we calculated the correlation equation which we use (together with the calibration data obtained in the lab) to correct the reflectivity field (dBZ) for LNA temperature changes in the whole data set.
As mentioned above, the received power not only depends on the LNA temperatures but also on the pod temperature. After correcting for the LNA temperature changes we are able to establish a correlation between the pod temperature and the power output during the NSC events which is then again used to correct the whole data set. (Note that we define a mean of the Noise Source, EIK, Polarization Switch, and RF Detector temperatures as the “pod temperature”.) It is important to keep in mind that for the HCR dataset, only the reflectivity related fields are corrected using the above mentioned methods. The received power (DBMVC) field is left uncorrected for engineering purposes.
Ocean scan calibration
Based on the work of Li et al. (2005) we use the backscattering properties of the ocean surface as a calibration reference. Results from Li et al. (2005) indicate that near a 10° incidence angle, the normalized ocean surface radar cross section σ0 is insensitive to surface wind conditions and has a value of ~6 dB. To make use of these results, several ocean-scan calibration (OSC) events are performed during deployments over the ocean, which each consisted of ~4 minutes of cross-track scanning from 20° to -20° off-nadir. We use
to calculate the normalized radar cross section bias σ0 bias of HCR, where σ0 theory is 6 dB, Z is the measured reflectivity, c is the speed of light, τ is the pulse width, |K|2 is the radar dielectric factor, λ is the signal wavelength, la0 is the nadir atmospheric attenuation, and Θ is the elevation angle. Using data of 10° plus/minus 0.3° incidence angle, the mean bias for all OSC events is calculated which is generally ~1-2 dB.
The atmospheric attenuation was calculated using the methods of Liebe (1985) and the ITU Recommendation (2013). The results of both methods differ by ~0.2 dB.
Velocity correction
The radial velocity is corrected for platform motion using two different methods. The first corrects for platform motion using INS/GPS measurements (VelRaw->Vel). It is applied to all of the data and results in a significantly improved data set.
An additional correction is applied to the nadir-looking data only: The radial velocity of the surface, which is assumed to be 0 m/s, is used as a reference to correct the data (Vel->VelCorr) following Ellis et al. (2017). The velocity of the ocean surface, which is rather noisy, is filtered by first applying a 3 point running mean and then fitting a 3rd order polynomial over a running 10-20 second interval. The second step further improves the overall quality and gets rid of remaining biases.
Ground-based validation
The HCR transceiver was configured in a ground-based dual-antenna mode in order to verify the design and performance. Two coplanar 12-inch antennas were mounted on the top plate of a sea container. Both antennas had a matched beamwidth of 0.68° and gains of 46.21 dB. Custom designed antenna shrouds with millimeter-wave absorber were added to provide additional isolation between the transmit and receive antenna. Signal was transmitted from one antenna and received simultaneously by the other. A reflector mounted on top of both antennas was used to aim the transmit beam to the desired near-horizontal angle.
Comparison with NEXRAD
In order to compare measurements from ground-based HCR with the NEXRAD (KFTG) radar, measurements from clouds with low reflectivity values were selected. This criterion ensured Rayleigh scattering for which reflectivity is independent of radar wavelength. HCR collected vertical profiles while the NEXRAD was operated in clear-air mode on June 1, 2010.
Despite the minor differences in sampling volumes and times, this preliminary comparison indicates HCR reflectivity measurements are in reasonable agreement with NEXRAD observation.
Comparison with Wyoming Cloud Radar (WCR)
The phase-A, pod-based HCR was brought to the University of Wyoming for the collaborated engineering assessment. By comparing the HCR with the well-calibrated, mature Wyoming Cloud Radar (WCR), the deficiencies and performance of the HCR can be easily verified.
A 30-minute stratoform rain event was observed by both radars on September 27, 2012. To accurately evaluate the performance, minimum time and range interpolation was performed on the WCR data. The preliminary, aligned signal-to-noise ratio (SNR) from both systems are shown to the left. Similar patterns are recorded in both systems. Patterns in far ranges seem more skewed than close ranges. This suggests the two systems may not be perfectly aligned in the azimuth direction. The scatterer correlation was plotted and is shown to the right. The HCR shows good correlation with the WCR with approximately 0.5 dB offset in SNR.
When referencing the HIAPER Cloud Radar (HCR) in publications or proposals, please use the identifier 10.5065/D6BP00TP -- for example as a citation:
UCAR/NCAR - Earth Observing Laboratory. (2014). HIAPER Cloud Radar (HCR). UCAR/NCAR - Earth Observing Laboratory. https://doi.org/10.5065/D6BP00TP Retrieved December 20, 2016
Please be careful of line breaks when cutting and pasting the above text, and feel free to reformat to fit your document. Additional citation styles are available at DataCite or CrossCite.