BOMEX
Barbados Oceanographic and Meteorological EXperiment

The Barbados Oceanographic and Meteorological EXperiment (BOMEX) was conducted from 1 May to 28 July 1969 as a joint project of seven US departments and agencies with the cooperation of Barbados. Its primary objective was to measure the rate of exchange of the properties of heat, moisture, and momentum between the tropical ocean and atmosphere over a 500 km square domain in a trade wind regime.
Scientific Objectives
Data collection during BOMEX by ship, buoys, aircraft, radionsonde balloons and satellites was concentrated in four periods of two to three weeks each. During the first three periods (3-15 May, 24 May - 10 June, 19 June - 2 July) observations were concentrated in 500 km x 500 km square (Fig. 1) east of Barbados. During the fourth period (11-28 July) the ships and aircraft were employed in a more flexible manner (Fig. 2) to explore the structure of convective systems in the ITCZ and adjacent trades over the western Atlantic.
| BOMEX Ship Configuration | |
|---|---|
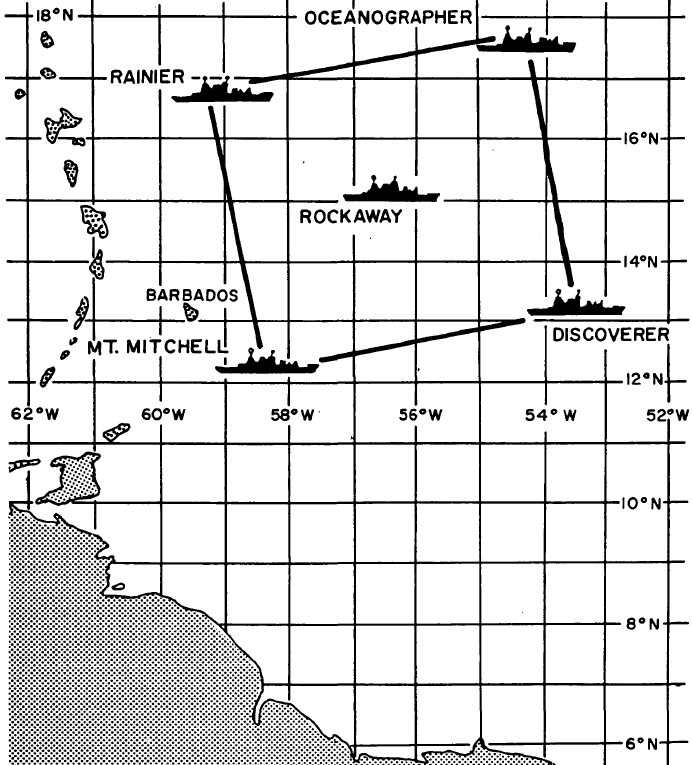 Fig 1. Periods 1-3 |
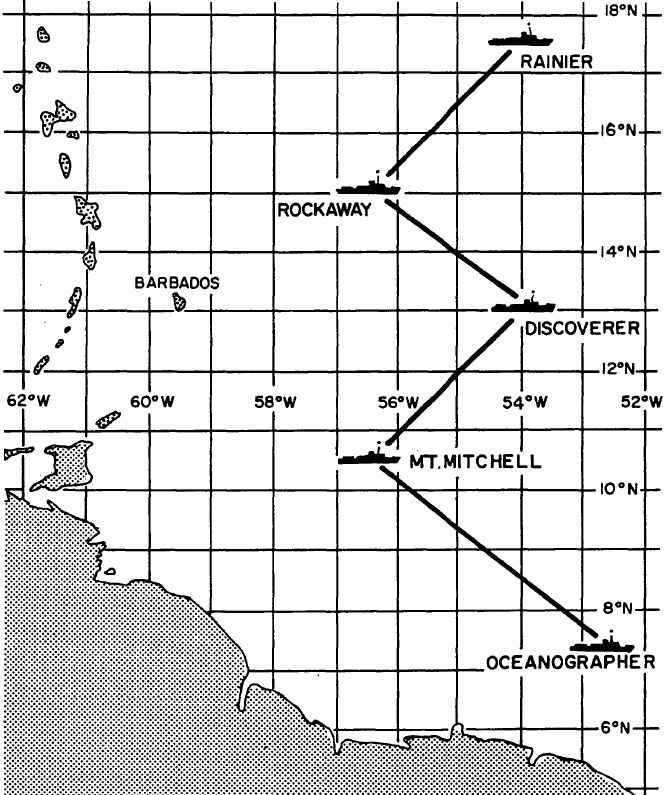 Fig 2. Period 4 |
|
Figures from NCDC BOMEX Data Documentation
(Click Images for Full Resolution) |
|
For the properties of heat, moisture and momemtum, intensive and sometimes redundant observations were made by several methods to obtain the following quantities:
- direct measurement of vertical eddy flux of the property in the atmospheric surface layer
- computation of the horizontal flux divergence of the property in the lower 600 mb of the atmosphere, integrated over the array area
- vertical transport of the properties through the top surface of this volume due to the mean vertical velocity
- local rate of change of the volume integral of the property; and
- internal sources and sinks (i.e., radiation, precipitation, stress).
Observations
 |
|
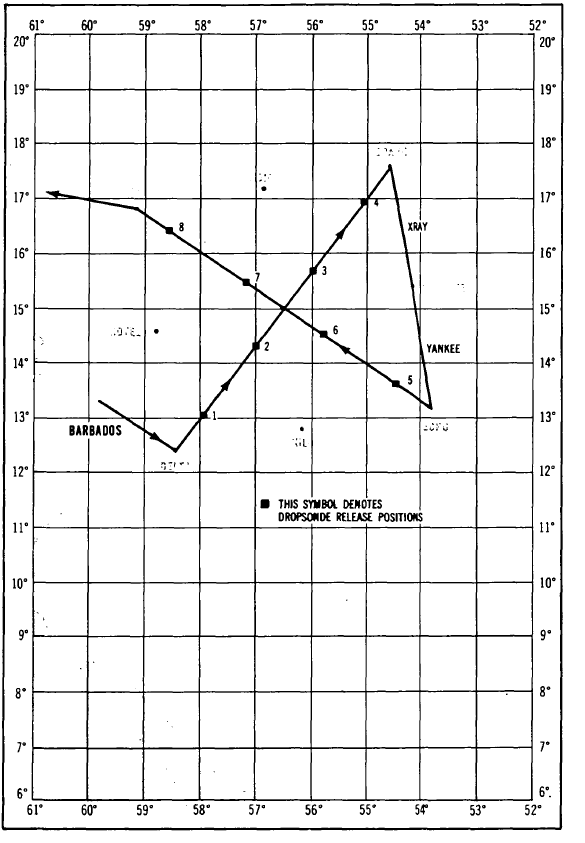
Example Dropsonde Flight Pattern
Figure from NCDC BOMEX Data Documentation (Click Image for Full Resolution) |
BOMEX observations were obtained primarily from rawinsonde data taken from five vessels in the BOMEX domain. During each of the periods (or phases), there was a least one day with down time (i.e., no sonde observations) for maintainence and calibration issues. During the intensive observation periods, rawinsondes were launched at 1.5 hour intervals (except for 0130 UTC) typically recording data up to 400 mb (or about 7 km). These ship sondes were supplemented with dropsonde observations from aircraft flying at around 6km. A variety of flight patterns were used, an example of which is shown in the figure. About 450 dropsondes launches were conducted during BOMEX.
|
|
|
|
|
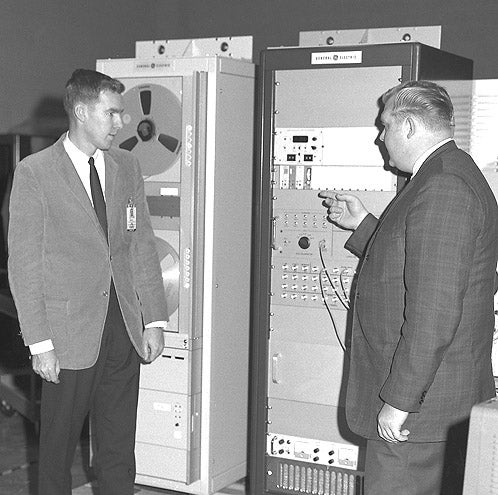
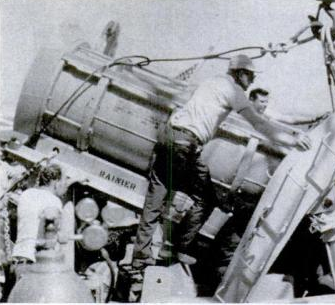
BOMEX Data Acquisition System
Photo courtesy NASA SP-4310, 1997. |
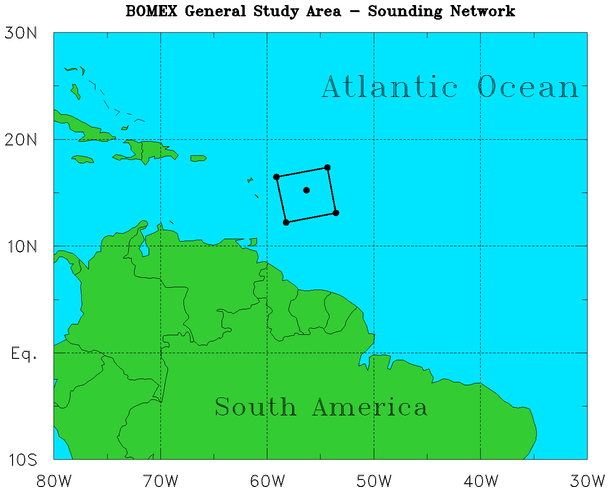
BOMEX Area Map
|
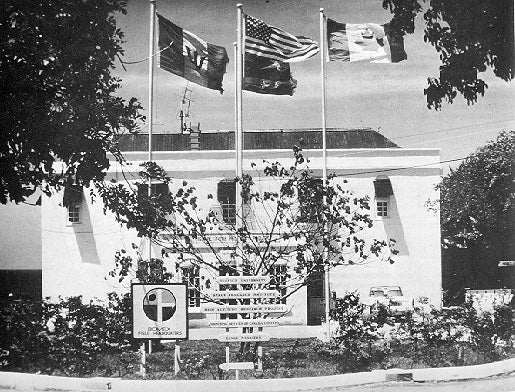
BOMEX Headquarters
Photo courtesy Atlantic Oceanographic and Meteorological Laboratory |
|
|
|
|
|
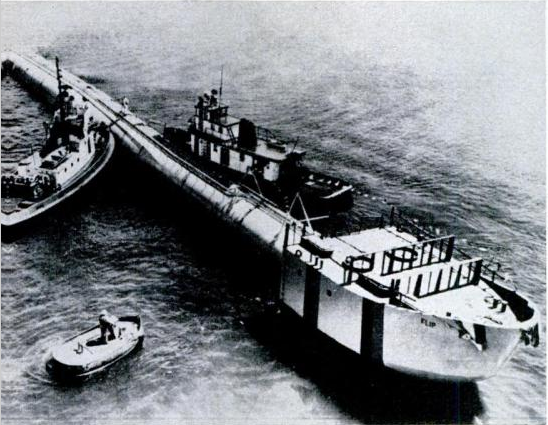
FLIP (Floating Laboratory Instrument Platorm)
Photos courtesy Popular Science, Vol. 195 No. 2, August 1969 |
BOMEX Ship Patch
Photo courtesy NOAA Photo Library |
|

All photos copyright University Corporation for Atmospheric Research unless otherwise noted.