BaSE CaMP II
Boundary Structure Experiments with Central Minnesota Profiling II
 Principal Investigator: Brian Billings & Rodney Kubesh
Facility: Mobile Integrated Sounding System (MISS)
Boundary Structure Experiments with Central Minnesota Profiling II (BaSE CaMP II)
Introduction
In the fall of 2012, Saint Cloud State University was visited by a Mobile Integrated Sounding System (MISS) provided by NCAR’s Earth Observing Laboratory. The deployment was termed Boundary Structure Experiments with Central Minnesota Profiling (BaSE CaMP). Within one week, the MISS was deployed to five different locations, was visited by forty-nine students, and collected datasets of features including a cold pool breakup, a subsidence inversion, a cold frontal passage, and a small graupel event. The first of these cases has been a subject of research by the PI and two students which was presented as a poster at the 2014 AMS Mountain Meteorology conference. Due to the success of BaSE CaMP I, a larger follow-up project for the MISS was requested, and BaSE CaMP II was funded for the Fall of 2014.
The method by which this second project was expanded was to add an additional three weeks of operations at a fixed-site, in addition to another week of mobile operations. Since the MISS was not moved after the first week, NCAR personnel were only required to remain in Saint Cloud for a similar amount of time as in the first project. The mobile phase of the project was closely modeled on the original BaSE CaMP, though some variations were required based on site availability. After this, the MISS would always be located on property occupied by the MN Highway Safety Research Center (MHSRC), which is part of SCSU. This report summarizes the results of BaSE CaMP II and discusses some of the future value of these observations.
 |
 |
 |
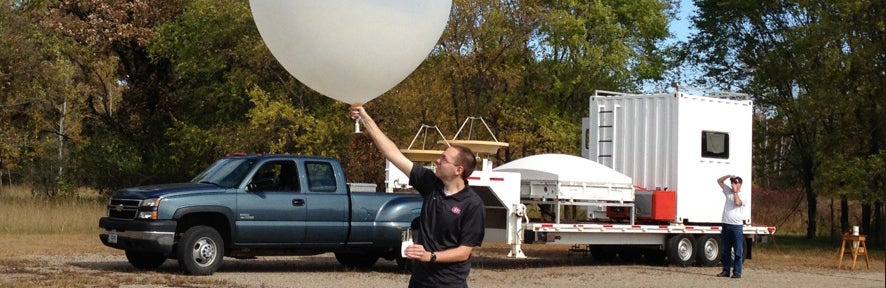
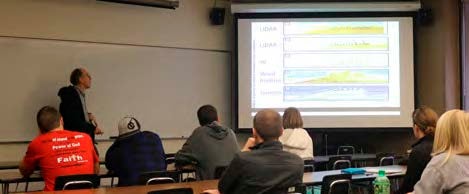
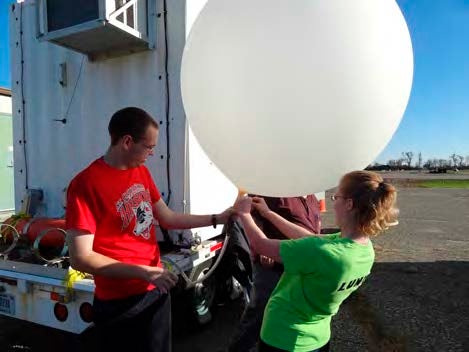
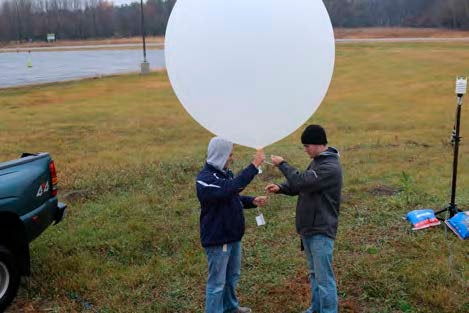
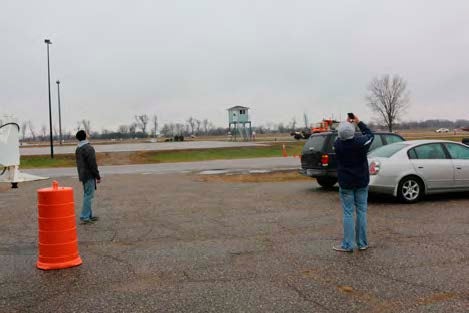
| Figure 1: Dr. Brown lectures on wind profilers to the Radar Meteorology class. | Figure 2: The Physical Meteorology class performs a weather balloon launch (bottom). | Figure 3: Teachers from nearby Sauk Rapids High School collect photos and data of a radiosonde launch for the spring’s meteorology course. |
Educational Outreach
Outreach activities for BaSE CaMP II actually began before the MISS arrived in Saint Cloud. On October 14-15, 2014 the department hosted its annual Northern Plains Winter Storm Conference at the local Holiday Inn. The keynote speaker was Dr. Greg McFarquhar of the University of Illinois at Urbana-Champaign who spoke on aircraft operations obtained during the PLOWS project. After the keynote address, Dr. William Brown of EOL spoke on the MISS’s involvement in this same project as well as other past and future projects (including PECAN) and other platforms being developed by the ISS group. In addition to SCSU students and faculty, the conference was also attended by individuals from Hennepin County Emergency Management, the National Weather Service, Environment Canada, and the University of North Dakota, all of whom were able to learn more about the instrumentation to be used in the upcoming field project.
Friday, October 17th was a convenient day to engage classes in two courses in the meteorology curriculum. First, Dr. Brown gave another talk to students in the Radar and Satellite Meteorology course on the principles of wind profiler observations. Aspects of this included refractivity and Bragg scattering, examples of phenomena which can be observed such as boundary layer evolution and precipitation melting layers, and more detail on the development of the modular wind profiler system. He also included some of the early observations of BaSE CaMP II which had been collected the previous day. In the afternoon, the Physical Meteorology class traveled to the south end of campus where the MISS was temporarily located to observe and participate in a radiosonde launch and toured the trailer’s instrument suite. Each student was required to write a short summary of what they observed, and nearly all will carry this experience forward to next semester when they take the department’s Instrumentation course.
Finally, the fall operations did not mesh well for the spring meteorology course offered by nearby Sauk Rapids High School. However, two teachers from that school were able to visit the MISS on the morning of Thursday, November 13th. The two learned about the instruments being used and the way operations were scheduled, took photographs of an actual balloon launch, and saw how to obtain plots from this sounding after the project was over. All of this material can be used in the classroom, and SCSU students who participated in the field work will also be available for future assistance.
Field Experiments
Due to lessons learned from the first BaSE CaMP, operations were less constrained to a strict evening schedule, but instead occurred during a variety of different times and days of the week. While this prevented any students from being involved in the entire campaign, it also allowed for enough flexibility that interested students were able to attend at least one field experiment. The following is a brief summary of the conditions during each Intensive Observing Period, any additional experiments which were conducted during the event, and the data collected for future use.
Intensive Observing Period Alpha
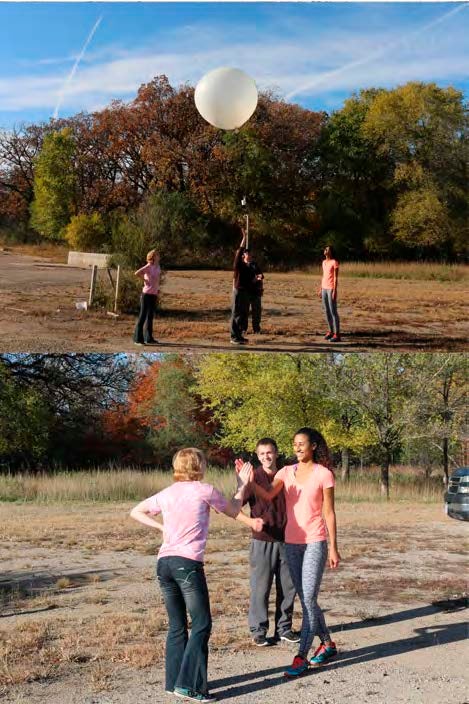 |
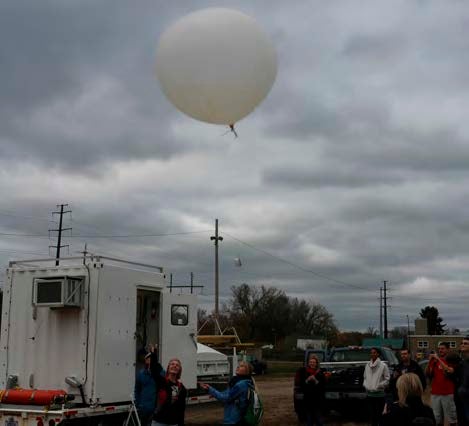
| Figure 4: Students launch (top) and celebrate (bottom) the final sounding of BaSE CaMP II’s first IOP after the trough passage. |
During the original BaSE CaMP, radiosondes were launched next to the 150 m KVSC radio tower which the meteorology program has instrumented at three different levels. One of the goals of this was to determine if there was a significant wake effect on the winds measured from the tower, since they have been used by students for wind energy resource assessments. However, the winds in this case were southerly, and the instruments are to the east of the tower. It is possible this effect would be more noticeable in a westerly wind. Consequently, when a trough passage on Thursday, October 16th was forecast to shift winds to westerly, MISS was again deployed to near the tower for the first IOP.
Based on the most recent forecast data from the night before, radiosondes were launched at 18 and 21 UTC. These proved to be excellent times, as the shift from southwest winds in the 18 UTC to west winds in the 21 UTC sounding was quite distinct. This was also captured by the winds from the profiler and the surface station at much higher temporal resolution. The radar also measured a gradual buildup in the height of the mixed layer starting after the trough passage, which again agreed with the two soundings. The temperature change with this feature was not dramatic, but the surface station did provide a nice illustration of instrument response as it adjusted to much higher temperatures outside the trailer.
Intensive Observing Period Bravo
During the first IOP of BaSE CaMP I, the MISS was deployed in a shallow basin along the Sauk River Valley SW of Saint Cloud to study the breakup of a nocturnal cold pool. This case has been the subject of ongoing research by faculty and students at SCºSU, with the early results presented at the 2014 AMS Mountain Meteorology conference. Due to the success of this site, the MISS was moved to the same location for the sole Saturday of the mobile field phase.
Similar to two years ago, a high pressure center was the main synoptic feature, but this time the center was not forecast to move over Minnesota until the afternoon hours. Prior to this, moderate northerlies were expected over the area, preventing an evening inversion buildup but allowing for possible leeside effects to occur off of the relatively steep northern sidewall of the valley. As in BaSE CaMP I, four radiosonde launches were scheduled, beginning at 1230 UTC and continuing at ninety minute intervals. Additionally, a student was given a handheld Kestrel anemometer to take measurements at various distances across the valley’s north sidewall.
The open exposure to the surroundings resulted in a large amount of non-meteorological returns in the radar, with a possible example being a radio tower located on the nearby hill. Due to this RASS was not operated during this IOP. However, the successive balloon launches did capture the evolution of the shallow cloud layer at the top of the mixed layer and particularly the effects of subsidence over the period. In the 1230 UTC sounding, the cloudtop inversion was 4.4°C and 175 m deep. By the final sounding, it had reached 6.6°C and 690 m deep.
Two other features were noticed during the deployment. The student measurements showed a relative maximum in the wind speed halfway up the slope of the topography. While this could represent some leeside enhancement, the road in this area also runs through more trees, which could produce increased winds through small-scale channeling. Also, prior to the 14 UTC radiosonde, the NCAR lead scientist noticed a darker band of cloud located to the north of MISS’s location over the higher terrain. After the balloon release (only four minutes later), the same band was observed to now be south of MISS’s location. Later examination of 1-km visible GOES imagery confirmed two strips of thicker cloud moving together as in a wave at this time. Determining what observations are related to this feature (a possible bore?) will require additional analysis.
 |
 |
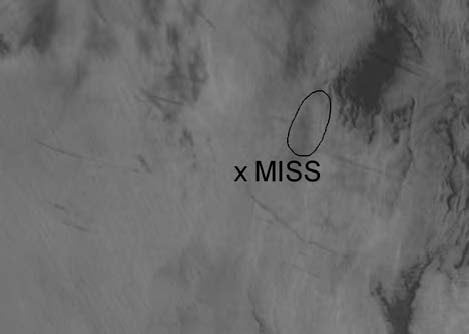 |
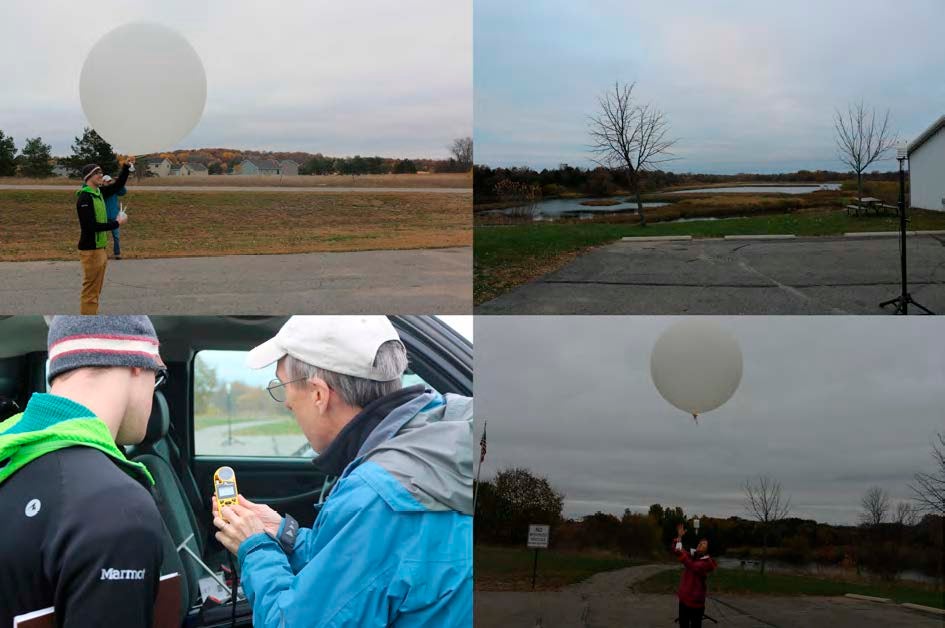
| Figure 5: The 14 UTC sounding is launched against the background of the north sidewall (top left) of the Sauk River Valley near Richmond (top right). A student also collected handheld observations (bottom left) between soundings until the end of IOP Bravo at 17 UTC (bottom right). | Figure 6: A fast moving cloud band (left) which passed over MISS during the 14 UTC IOP Bravo balloon launch could also be seen on visible satellite (right) due to a small shadow behind the crest. | |
Intensive Observing Period Charlie
Generally, a PI or NCAR technician would handle the operation of the radar and preparation of radiosondes. However, for one IOP, students were given the opportunity to do this hands-on work. To include all aspects of the system, RASS needed to be running, which operates better in lighter winds. Since wind speeds were not forecast to increase until that Tuesday, IOP Charlie was declared for Monday, October 20th for this purpose. This also allowed for an early test of the MISS at its eventual fixed location at the MHSRC.
 |
| Figure 7: Students take over the actual sonde and balloon preparations during IOP Charlie. |
Since much of the MISS system is automated, the main exercise before the sounding was a sample power down and restart. This actually required several steps, due to the number of separate components, including a UPS, profiler computer, RASS amplifier, radiosonde receiver, and display monitors. After this, the students were able to prepare their own radiosonde, which included entering information into a performance log file, reconditioning the humidity sensor and tuning the frequency, and checking the surface values to make sure all the instruments were functioning correctly. The students then filled and tied the balloon to the instrument package and released it at 21 UTC.
The resulting sounding proved to be an excellent example of conditions in Saint Cloud over the recent weeks, namely unseasonably warm temperatures due to higher than normal mixing depths. Specifically, the October 20th sounding was capped by an inversion at 852 mb, and the 6°C temperature seen at that level becomes 17.5°C when brought dry adiabatically down to the surface. The inversion layer was also characterized by a sharp dry intrusion with a minimum relative humidity of 2.2%. This type of layer was also sampled by several soundings during the original BaSE CaMP.
After the field project concluded, one of the participants in this IOP wrote the following: “I loved the fact that students were invited to do hands-on work with the MISS. Field research is something I’m striving to do in my career so to get some of that experience working with instruments is extremely invaluable to me. Noants in this IOP wrote the following: “I loved the fact that students were invited to do hands-on work with the MISS. Field research is something I’m striving to do in my career so to get some of that experience working with instruments is extremely invaluable to me. Not to mention it was really fun to work with!”
Intensive Observing Period Delta
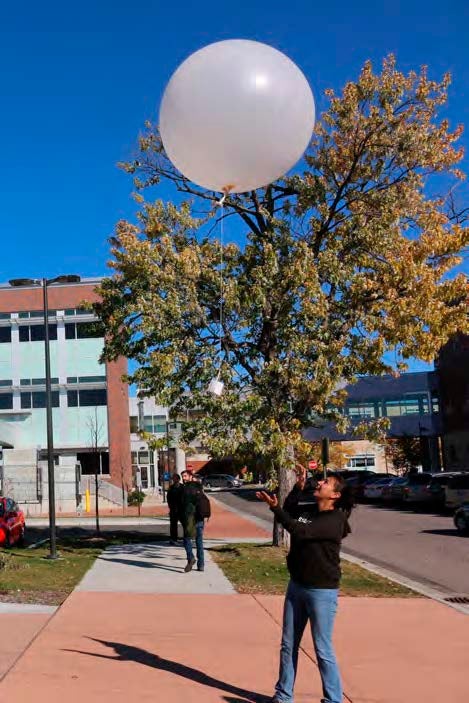 |
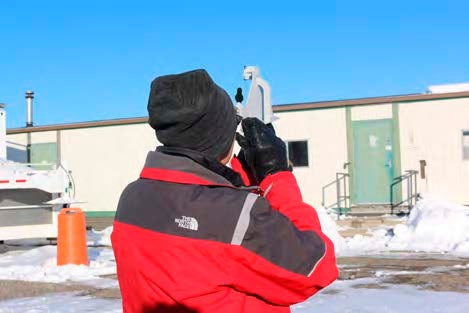
| Figure 8: The radiosonde launched during IOP Delta measured the surface layer of the winds flowing through the south side of SCSU’s campus buildings. |
In the spring of 2007, the meteorology program began using a low-cost wind tunnel with a large test section to perform anemometer calibration exercises for the Instrumentation course. Two years later, the tunnel also began to be used for flow modeling demonstrations in Atmospheric Dynamics and a student used a 3D printer to create models of islands to study their wakes. Finally, the new visualization lab on campus has created 3D computer models of all the buildings on campus for applications to search and rescue. Since this creates the future possibility of both physical and numerical modeling of flow through campus, the MISS was deployed in the middle of several large buildings on the south side of campus during a strong SSE wind on Tuesday, October 21st.
The lowest gate of the wind profiler is located at 150 m, well above the height of the buildings, but it was still valuable in showing how the larger scale flow was evolving over the two hour period. A single radiosonde launch at 16 UTC provided a vertical profile of the winds in the lower levels at and just above the campus buildings. Finally, the MISS’s surface wind observations were complemented again by teams of students who used handheld instruments to collect wind observations at other points in the general area. Some of the students were well-suited for this, since it was similar to an assignment measuring temperatures from the previous semester’s Instrumentation class.
The balloon’s overall trajectory was interesting. Initially, the crowd which had gathered watched it drift to the northeast, just to the southwest of the new Integrated Science and Engineering Facility. However, after a brief time, they could see it moving from left to right when they looked in the direction of this building. Finally, the balloon, still visible at an altitude of 2400 m, moved back to the south closing to within 300 m of its original surface position. This trajectory agreed with the radar retrievals. As expected, the extra surface observations showed variation across the campus. The NE sides of buildings were sheltered from the higher winds, while winds in parking lots along the Mississippi River were the highest recorded. The student who launched this balloon said the following: “I plan on going into research when I am done with school, so it was enlightening to see how data is collected in the field. Although I don’t have any ambition to launch another weather balloon (I’m terrified of balloons), it was a one-of-a-kind experience to be a part of.”
Intensive Observing Period Echo
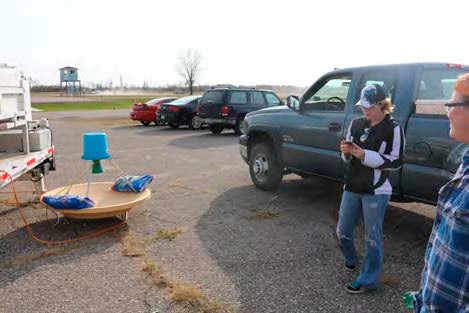 |
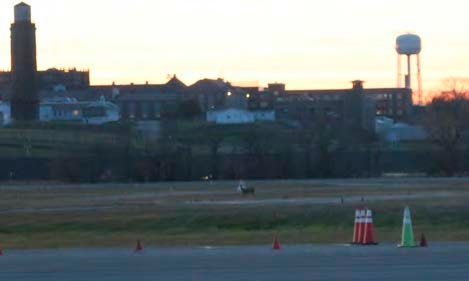
| Figure 9: Students pick new music to test while listening to the last experiment during IOP Echo. Also, a collision avoidance exercise is practiced by law enforcement. |
Wednesday, October 22nd was the last day that NCAR would be on-site until the MISS was collected at the project’s end, making it the last chance to repeat an experiment from 2012 where the RASS’s default audio signal was replaced with more pleasant musical selections. Those trials resulted in no usable profiles, but it was suggested at the time that more soprano could be helpful. Due to convection in the area, a single radiosonde launch was combined with this experiment and identified as IOP Echo, due to its order and not its focus on sound.
While convection with some moderate vertical development was observed in several different directions from the site, there was only a shallow cloud layer over the launch location itself. The sounding could be an excellent exercise for students on testing the stability of multiple parcels. While it appeared that some could be made unstable by lifting, careful analysis (by hand or with software) show this is not the case, which is consistent with convection occurring in the area but not at this point. The balloon release was followed by the RASS experiment, which tested four new audio files. While the amount of soprano varied (with Taylor Swift being the best example), once again no usable profiles were generated, and the search for an alternative to RASS’s audio continues.
Intensive Observing Period Foxtrot
After IOP Echo, MISS was left in place at the MHSRC for the remainder of the field project. Since the location was the same, the IOPs for the final three weeks had a greater focus on capturing specific weather events. However, the surface station, wind profiler, and RASS were left running at all times and documented some events even when an IOP was not in effect. As an example, the RASS data for the entire day of Thursday, October 23 was very complete, nearly always extending to 1 km. The primary feature of these profiles was a 5◦C temperature inversion in the lowest 400 m, which was rapidly heated out between 12 and 14 LST.
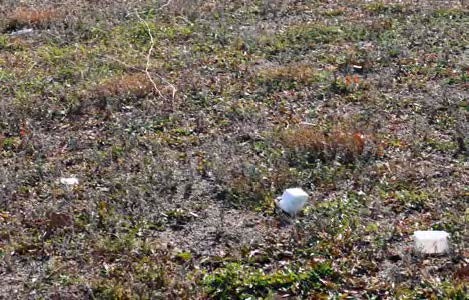 |
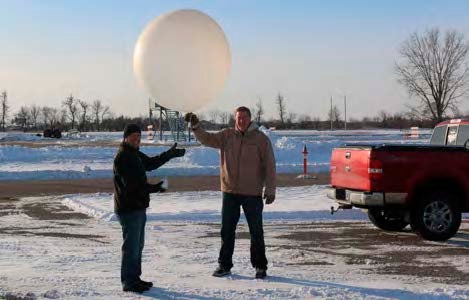
| Figure 10: The remains of the final radiosonde for IOP Foxtrot were recovered six days after its failed flight. |
While a strong cold front was observed during BaSE CaMP I and the first IOP of this project surrounded a surface trough, there was not a dataset showing the evolution of a post-frontal environment over a shorter time interval. Consequently, the goal of IOP Foxtrot was to launch three radiosondes at three-hourly intervals shortly after the forecast passage of an occluded front at 14 UTC on Monday, October 27th. While precipitation did not occur until well after frontal passage, moist processes were happening in the lower and middle level cloud layers, which provided very good returns for the radar, with data being measured at and above 6 km. This level was characterized by high SNR, moderate (≈ 1 m s−1 ) downward velocities, and higher spectral widths. While these values did not vary much over the course of the IOP, the level at which they were observed did descend rapidly to an elevation of 3.5 km between 11 and 13 LST.
Subsidence is also evident when comparing the first two soundings of the event. At 14 UTC, there are some small dry-adiabatic layers, but none are more than 50 mb deep. However, by 17 UTC, one dry adiabatic layer extends about 630 mb to 700 mb while a lower one is located between 730 and 830 mb. A small mixed layer has also developed at the surface, but only reaches 934 mb due to the sharp (4° in 50 m) inversion above it. Additionally, during the event, a band of echoes in the WSR-88D which had been moving eastward toward MISS began to dissipate when they approached within 40 km.
The surface station showed the increase in wind speeds as the front moved eastward. This caused problems handling the balloon while ‘securing’ the radiosonde to it. As a result, the 20 UTC radiosonde fell from the balloon after only a minute of flight and separated from its battery case, ending data transmission. This sonde was recovered later at the edge of the property by following the balloon’s line of flight and will still prove valuable even though a relaunch was not attempted. Next semester’s Instrumentation class will be able to use the sonde, and it was also lent to a Mechanical Engineering professor to show in the Process Measurement and Sensors class.
Intensive Observing Period Golf
Since the first BaSE CaMP was successful in documenting an inversion breakup under calm, quiescent conditions, it was hoped that a dataset could be collected during this project to show the buildup of the nocturnal inversion under the same conditions. Although the window of opportunity was narrow, a clear, calm night was forecast for the evening of Friday, October 31. The plan of operations was to launch three radiosondes at two-hourly intervals with the first one occurring just after sunset at 23 UTC (similar to the corresponding BaSE CaMP case).
This plan proved to work quite well, and although darkness was setting in quickly at the time of the first sounding, the skew-T still showed a well-mixed layer extending all the way down to the surface. Just two hours later, the nocturnal inversion was in place with a 4.8◦C temperature difference, though only in a layer 60 m deep. An extra thirty minutes was allowed to pass for the fi- nal launch at 0330 UTC, which increased the temperature difference to 7.1°C, but the depth only increased to 100 m. While this activity was entirely below the range of the wind profiler and RASS, the surface station did provide information at a higher temporal resolution, showing a fast drop in temperature in the first forty-five minutes after sunset and decreasing at a slower, less steady rate throughout the IOP and further into the night.
 |
 |
||
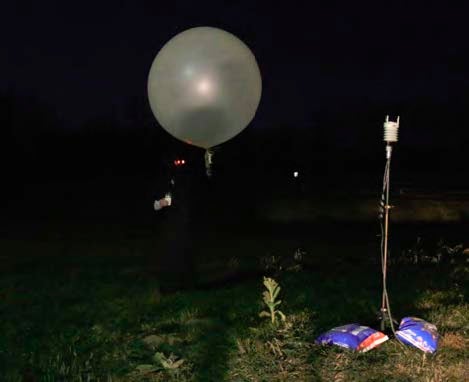
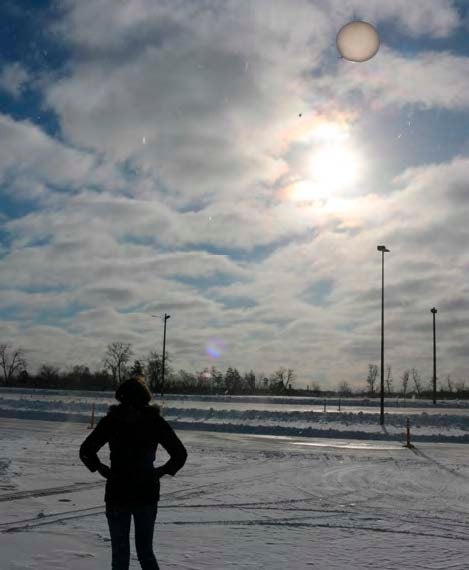
| Figure 11: While only spectators attended the initial radiosonde launch (left), a helper visited the project PI for the final launch of IOP Golf on Halloween night (right). | |||
Intensive Observing Period Hotel
While a wide variety of weather had been sampled up to this point in the project, what had been lacking up to this point were precipitation events. While rain had fallen while the radar was operating, such as on October 23rd, 27th, and 30th, the time of day or proximity to other operations did not make radiosonde launches convenient. However, a surface cyclone forecast to track from central ND to the MN-IA-WI border would bring significant rainfall on Wednesday, November 5th, so the radar observations were supported with three balloons in IOP Hotel. To allow comparisons with the 00 UTC NWS sounding, the launches were an hour ahead of synoptic times at 17, 20, and 23 UTC.
Unsurprisingly, radar returns were excellent for this event, which allowed for fine detail of the complex wind pattern. Above the lowest 1 km, the flow has a general west to east direction, but a vertically tilted trough does move through over the period. However, in the boundary layer, the winds are dominated by the closed cyclonic circulation, transitioning from south-southeastery through easterlies to north-northeasterlies within a nine hour period.
The vertically pointed beams also had great value, as they showed the classic cold-rain precipitation pattern. The bright band in the SNR values had a very distinct minimum directly underneath it, and the height of the melting layer varied considerably during the event, first rising from slightly below to slightly above 1 km and then dropping to just a couple hundred meters above the surface. This agreed with student observations of tiny ice crystals during the final radiosonde launch. The melting layer could also be seen in a transition from descending velocities of 1 m s−1 to velocities of 2-5 m s−1 and a transition from relatively narrow to very wide spectral widths, indicating the larger and more diverse terminal velocities of the rain drops.
While the radar made the melting layer clear, this does not reveal the temperature structure on its own, as made clear by the soundings for this IOP. As expected, the first and last, during the heavy rain, were deeply saturated, up to 710 and 630 mb, respectively. However, the 17 UTC sounding only exceeds 0°C below 810 mb, and the 23 UTC sounding is essentially isothermal at this temperature below the same level, indicating that there is a noticeable lag in the melting process. The middle sounding at 20 UTC is also interesting as it was taken when the rain had temporarily decreased in intensity. While many layers are still saturated, there are noticeable dry sections between 850 and 900 mb and again immediately below 900 mb. The nearby KSTC ASOS station would record 0.25 inches during this event, making the attempt to add a precipitation event to the dataset a success. One of the students involved noted: “This experience helped me better understand the field work that was required to be able to review past forecasts...”
 |
 |
||
| Figure 12: Students prepare the second radiosonde launch of IOP Hotel (left) and watch its flight into the cloud base (right). In the background, the MHSRC conducts an exceptionally well-timed snow plow training class. | |||
Intensive Observing Period India
While IOP Hotel had featured a precipitation event with rain and a very slight rain/snow mix, it was still hoped that a pure snowfall event could be documented in the last week and a half of the project, even if they were only flurries. On Friday, November 7, the 18 UTC NCEP models came into agreement on moving a major snow band further north into southern MN. Given the relative locations of MISS and the NWS Chanhassen office, it was thought that soundings from MISS could provide useful data to compare against a sounding within the heaviest snow. By the next 12 UTC model cycle, the band had been shifted further north directly over Saint Cloud. As this continued to be the model’s solution from this time, IOP India was enthusiastically scheduled for Monday, November 10th.
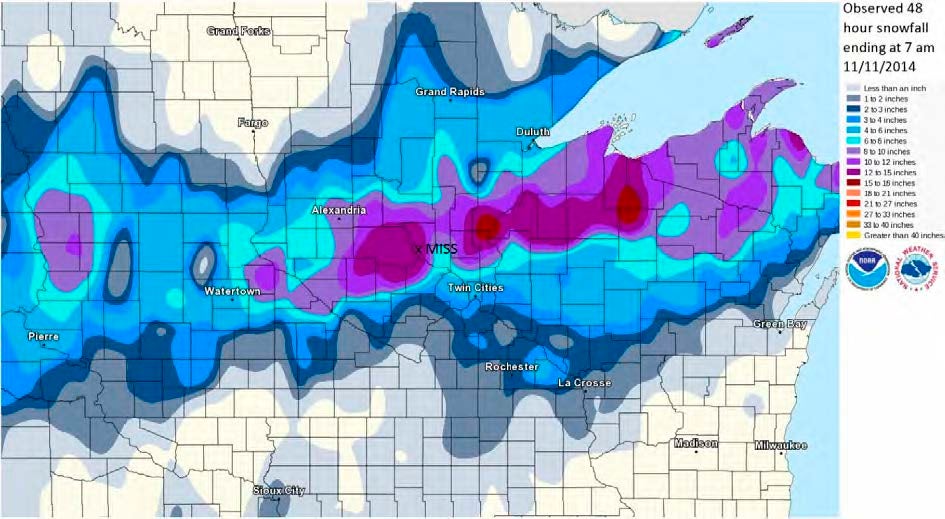 |
| Figure 13: An objective analysis of COOP and CoCoRaHS snowfall reports http://www.crh.noaa.gov/images/mpx/2014_Nov10_StormSummary.pdf. |
The first radiosonde launch occurred at for 11 UTC to allow for comparisons with the NWS sounding. While 1-2 inches had already fallen by this time, the snowfall rates were still relatively lighter. The lights and the buildings of the Saint Cloud Reformatory were still visible on the other side of Highway 10. For the next two balloon launches at 14 and 17 UTC, the snowfall rates had reached 1-2 inches per hour and whiteout conditions were in place at the field site. Nevertheless, all three launches were successful, and all three soundings show saturated or nearly saturated conditions through the entire depth of the troposphere. While all temperatures were below freezing, they remained above -10°C below 600 mb, suggesting a different growth regime from the classic dendritic was contributing to the rates, an idea which was emphasized in an NWS talk from the earlier winter storm conference.
The precipitation was again well sampled by the radar, but the wind directions showed less variation in this case with general westerlies dominating aloft and easterlies confined to the surface. However, the radar did show the rapid increase of this surface wind layer, which was topped at a few hundred meters at 06 UTC and increased to over 3 km by the time echoes diminished after the snow ended. The other radar variables showed the difference between liquid and solid precipitation very well. There was no bright band signature in the SNR values, the vertical velocities did not exceed 1 m s−1 , and early in the event the spectral widths were quite narrow below 3 km. This layer of hydrometeors with similar fall speeds remained in place throughout the day, but broader signal widths built up from the surface as rates increased, possibly suggesting an increase in riming and the presence of graupel. Fortunately, the Physical Meteorology has another assignment this semester where individual students must make observations of ice crystal habits and characteristics during snow events. All of the observations are collected into an “ice crystal diary” and can be used as a resource for this case when they are submitted.
By 20 UTC, the snowfall had mostly ended and good visibility returned, though blowing and drifting snow still remained a problem, particularly over the open tracks of the MHSRC. While morning classes were still held at SCSU, the deteriorating conditions forced an announcement that classes would be canceled and offices would be closed at noon. While the snowfall amounts over the southern half of the Twin Cities metro area ended up being less than forecast, the official Saint Cloud report from the previously mentioned reformatory was 13.5 inches for the entire day, breaking the single-day record for the month of November. One of the highest reports, of 16.5 inches, was made just eight miles to the south.
Intensive Observing Period Juliet
The goal of the project’s final IOP was to experiment with two new pieces of equipment. First, SCSU’s Environmental and Technological Studies department loaned three NODE+OXA gas sensors from Variable, Inc. Secondly, during the first BaSE CaMP, students performed an experiment where they attempted to track the balloon as a pibal using a simple instrument with a compass and slope indicator. They could then compare their measurements with the GPS values. Based on this experiment, the ISS group purchased a Davis sextant to be carried with MISS for this project and for future educational outreach opportunities. To track the balloon for a longer time required a day with clear skies. The only day this occurred following the major snowstorm was on Friday, October 14th. Since the wind would not be blowing from the direction of a nearby power plant (and a possible source of SO2), the focus of the air quality measurements was to be on comparing concentrations of NO2 and CO before and after the breakup of the nocturnal inversion. Radiosonde launches were therefore scheduled for 15 and 21 UTC. However, a power issue at the field site resulted in the device used to tune the sonde’s frequency being unavailable in the morning, so only the afternoon sounding was made.
While no sounding was available, the overnight temperatures that dropped below -15◦C suggest that an inversion did form, though the increase in surface wind speeds after 14 UTC likely means that the inversion had already started to heat out by the time of the planned morning sounding. The afternoon sounding did establish the presence of a surface mixed layer extending to a height of 900 mb. While the focus of this IOP was on the boundary layer, the sonde was allowed to collect data at some higher levels, revealing a second prominent inversion between 500 and 600 mb. While a few measurements were made of the afternoon balloon’s track, it was determined that the lack of magnification on the sextant made it difficult to keep the balloon in sight over long distances, though visiblities that day were some of the best during the project. Also, the NO2 sensor did not seem to be functioning and the CO sensor did measure a large distance between morning and afternoon, but did show some variation with distance from the highway. As a more dramatic test, the sensor was placed behind a Ford Explorer while the engine was turned on and off and responded accordingly.
 |
 |
|||
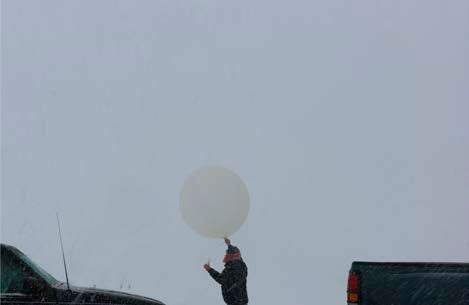
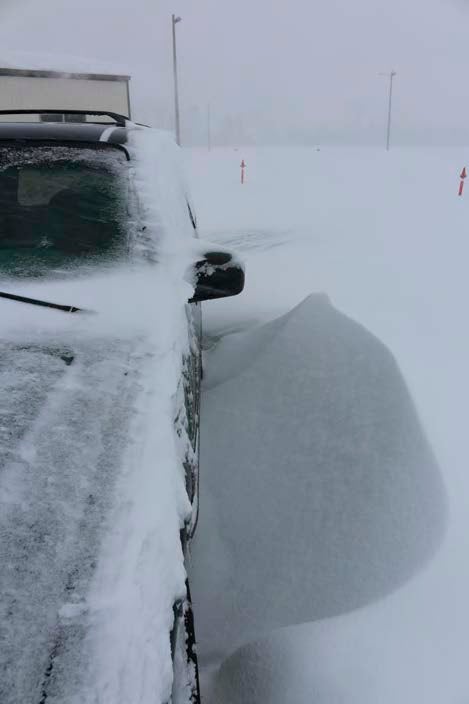
| Figure 14: The 17 UTC radiosonde launch for IOP India occurred during some of the highest snowfall rates (left). Leeside snowdrifts and icing over a ‘97 Ford Explorer (right). | ||||
 |
 |
|||
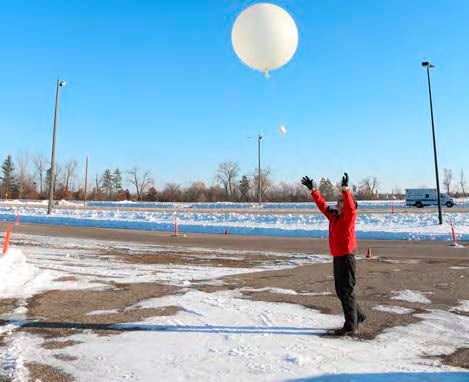
| Figure 15: A radiosonde to determine the mixing depth is launched in IOP Juliet as ambulence drivers are trained in the background (left). This balloon was also tracked from the ground with MISS’s newest instrument (right). | ||||
>> Summary Plots from BaSE CaMP II
Operational Logistics
As mentioned previously, the first week of operations where the MISS was moved from site to site was based on the plan used for BaSE CaMP I, which helped a great deal in making everything run smoothly. Locations near Richmond and for short-term storage on campus had previously been scouted two years earlier, and a new location near the KVSC radio tower was found in the same general area. There was a new site in the middle of campus, but fortuitous timing allowed the MISS to take a spot usually reserved for a science education trailer. Also, the airport location from the first BaSE CaMP was deemed unnecessary, since the relatively remote MHSRC site allowed for full-time RASS operations after the mobile phase of the project ended. This also meant that RASS did not need to be used during the mobile phase.
There were virtually no technical issues during the course of the project. Excepting the two failed launches mentioned earlier and a general reduction of radar returns as the weather turned cold and dry, the main data issue was related to the surface station wind measurements. Shortly after IOP Hotel concluded, the station begin reporting unrealistically high wind speeds, which were likely due to the moisture on the instrument turning to ice. A warning about this had been given for wet snow events. The second problem with the wind directions occurred intermittently throughout the project. At a distinct time (such as 1345 UTC October 30th), the sensor would begin reporting wind from a number of different directions besides the predominant one. These other directions were quite consistent resulting in observation points forming a series of horizontal lines across the time series. While a test was recommended to diagnose the problem, it could not be carried out during the project, and the cause of this instrument error is a subject for future investigation.
The remaining issue was communicating when operations would be occurring. While some of this could be done with in-class announcements, to reach the widest audience a Facebook page was created specifically for this field program. The majority of posts involved announcing IOPs. An initial assessment of a possible event would be made based on 2-3 day forecasts, and a fi- nal plan of operations would be posted the night before the IOP. Additionally, students could comment on these posts to let the PI know they would be available for certain sounding times and request more information. There were also posts on other topics, for example, giving links to more information on the MISS and the previous field experiment, updates on the number of sondes used and remaining, and instructions on how to make plots from the original data files. This page will remain as an archive of project operations, even after the announcement of the final report is made.
 |
||
| Figure 16: A screenshot of the BaSE CaMP II Facebook page: www.facebook.com/scsubasecamp |
 |
| Figure 17: The final radiosonde of BaSE CaMP II’s allotment was launched on the last day of operations under very different weather conditions from the project’s start. |
Additional Research and Classroom Use
Since two years had passed since the original BaSE CaMP, the vast majority of the students who were able to visit and observe the MISS in operation were seeing it for the first time. The senior class was particularly well represented, taking advantage of this opportunity in their fi- nal year at SCSU, but as mentioned earlier the bulk of the junior class would have been part of the sounding launch for Physical Meteorology, which will allow the instruments to be referenced in the following semester’s Instrumentation course and the data to be used for projects therein. Also, the initial BaSE CaMP soundings proved to be a valuable tool in Atmospheric Dynamics for doing homework and projects on roughness lengths and Richardson number profiles, and the new data will be incorporated into the spring course.
In addition to the real-time plots available on EOL’s website, many of the department’s students will already be in a good position to visualize the data collected on their own. The Meteorological Analysis Software course that was first offered the semester of the first BaSE CaMP was offered again the following year and had a heavy focus on Unidata’s Integrated Data Viewer (IDV). Much of MISS’s data, including the radiosonde profiles and wind time-height series, are compatible with the IDV, and in fact, BaSE CaMP I data was used to illustrate the program in these two classes. In addition, MATLAB has been used in many of the department courses, including Atmospheric Dynamics and Atmospheric Thermodynamics. In the latter, students had to construct the background lines for an emagram, which is a useful first step for plotting their own overlay soundings.
Once again, there are high hopes for this dataset in terms of student research. The Student Research Proposal course is held every spring, where students develop an idea for the following year’s Senior Research Project class. Apart from summer internships, it is a rare occasion where students collect their own field data, but they will have this opportunity using the BaSE CaMP datasets. Even excluding the required project, there is still the possibility to work with faculty and other individuals from external affiliations on a more formal project, as with the first BaSE CaMP. Some events suggest more obvious opportunities, such as working with NWS forecasters on an IOP India study for the next Northern Plains Winter Storm Conference, but any case from these two programs is a potential opportunity for a future student.
Acknowledgments: The department would again like to thank the scientists and technicians from EOL for participating in this visit, as well as NSF for providing the funding, and various local residents of St. Cloud and the surrounding area who allowed their property to be used for deployment sites. We are particularly indebted to the MN Highway Safety Research Center for the use of MISS’s fixed deployment site. The staff here was incredibly helpful with choosing the site, coordinating transport through the track during training sessions, solving power issues, and last, but certainly not least, for extracting one of the PIs from a ditch as he attempted to leave after the IOP India snowstorm.
Data Manager
EOL Archive, NCAR/EOL/DMS