| Version | Date | Description |
|---|---|---|
| V1.0 | 28 Feb 2020 | First release of final data |
| V2.0 | 20 Jan 2021 | Corrections to the NR01 radiometers. See below |
Overview
ISFS supported the Hydromet research for RELAMPAGO and, as such, was operational for the EHOP, scheduled for 1 June 2018 -- 15 April 2019. Due to some delay in shipping ISFS and RAL equipment, the first week of June was the "burn in" period, during which some sensors were not functioning correctly.
Sites
All sites have instrumentation for basic meteorology, radiation, and soil heating and moisture. In addition, seven of the sites have eddy covariance fluxes with a 3D sonic anemometer and H2O/CO2 IRGA, enabling calculation of the entire surface energy balance. Ten of the sites have optical disdrometers (Ott Parsival2), recording the particle size distribution every minute.
It should be noted that, since all site owners generously volunteered their land, the exact tower placement was not determined completely by scientific requirements, so the flow exposure often was not ideal. Sites were arranged to optimize fetch for North and Southwest winds. Users are urged to examine the site photographs when interpreting these data.
(This ISFSkmz file has these locations.)
| Number | Location | Remarks | Type | Sonic height (m) |
Disdrometer? |
Latitude | Longitude | Altitude (m) |
|---|---|---|---|---|---|---|---|---|
| s1 | Rio Primero | Basic | Y | 31° 19.876'S | 63° 38.470'W | 253 | ||
| s2 | El Tio | Basic | N | 31° 23.144'S | 62° 48.789'W | 124 | ||
| s3 | San Francisco (Col Marina) | Flux | 4 | Y | 31° 17.094'S | 62° 21.652'W | 111 | |
| s4 | Esperanza | School | Basic | Y | 31° 23.501'S | 60° 54.689'W | 25 | |
| s5 | Canada de Gomez | Butterfly | Basic | Y | 32° 48.355'S | 61° 26.105'W | 96 | |
| s6 | Marcos Juarez | Test plot | Flux | 6 | N | 32° 43.518'S | 62° 5.085'W | 114 |
| s7 | Marcos Juarez | Old Alfalfa | Flux | 3 | Y | 32° 42.970'S | 62° 4.492'W | 112 |
| s8 | Ordonez | Causeway | Flux | 3 | Y | 32° 48.216'S | 62° 57.615'W | 147 |
| s9 | Villa Chacay/Las Albahacas | Mountain site | Flux | 4 | N | 32° 51.988'S | 64° 53.194'W | 1104 |
| s10 | Laborde | Vet | Flux | 6 | Y | 33° 9.304'S | 62° 49.414'W | 121 |
| s11 | La Carlota | 4 posts | Basic | N | 33° 18.287'S | 63° 21.279'W | 157 | |
| s12 | Alejandro Roca | Dog and son | Basic | N | 33° 24.207'S | 63° 38.183'W | 190 | |
| s13 | Alto Durazno | Insolente | Basic | Y | 32° 10.541'S | 64° 48.550'W | 1111 | |
| s14 | Berrotaran | Met Observer | Flux | 5 | Y | 32° 28.334'S | 64° 23.708'W | 631 |
| s15 | Pilar | SMN | Basic | Y | 31° 40.057'S | 63° 52.977'W | 334 |
Communications/Data Flow
Two sites, s11 and s13 were found to have poor cell phone coverage during site survey and will use satellite modems for real-time data transmission and remote login. The rest of the sites will use cell phone modems. Through these connections, 5-minute average statistics computed on site will be transmitted to Boulder, where they will be assembled into one data file and used to create data plots in near-real time. Raw sample data will be archived onsite and downloaded manually during site visits every 2 months. If the cell modem data bandwidth permits, raw sample data may be transmitted in real time from the sites using them.
Site servicing
To avoid excessive staff travel time, site visits were scheduled for every two months. In between, staff from the University of Cordoba generously volunteered their time to fix problems as they occurred. Nevertheless, this approach resulted in some sensor data outages for several weeks. All sensor-related events are listed in this link.
Data Archive
5-minute Average Surface Fluxes: https://doi.org/10.26023/ZPHJ-JW9W-2B0Y
High Rate Surface Flux Data: https://doi.org/10.26023/DRYV-VC3P-CK0Q
OTT Histogram Data Archive: https://doi.org/10.26023/8EJ0-7ZZ8-QC0C
Data Quality Processing
Radiometers
Hukseflux NR01 Issue First Documented Wed, 23 Dec 2020
An error was discovered in the NR01 radiometer measurements. Coefficients provided by the manufacturer and unique to each sensor were swapped for the Rsw.out (outgoing shortwave radiation) and Rpile.in (radiant heat within the radiometer dome) parameters. This also affects the derived parameters Rlw.in (incoming longwave radiation) and Rsum (the total of all 4 components) - refer to https://www.eol.ucar.edu/node/1935 for the calculation. The plot below is a test example from the CHEESEHEAD campaign with the upper left Rsw.out and upper right Rlw.in before correction, and the bottom row after correcting for this switch.
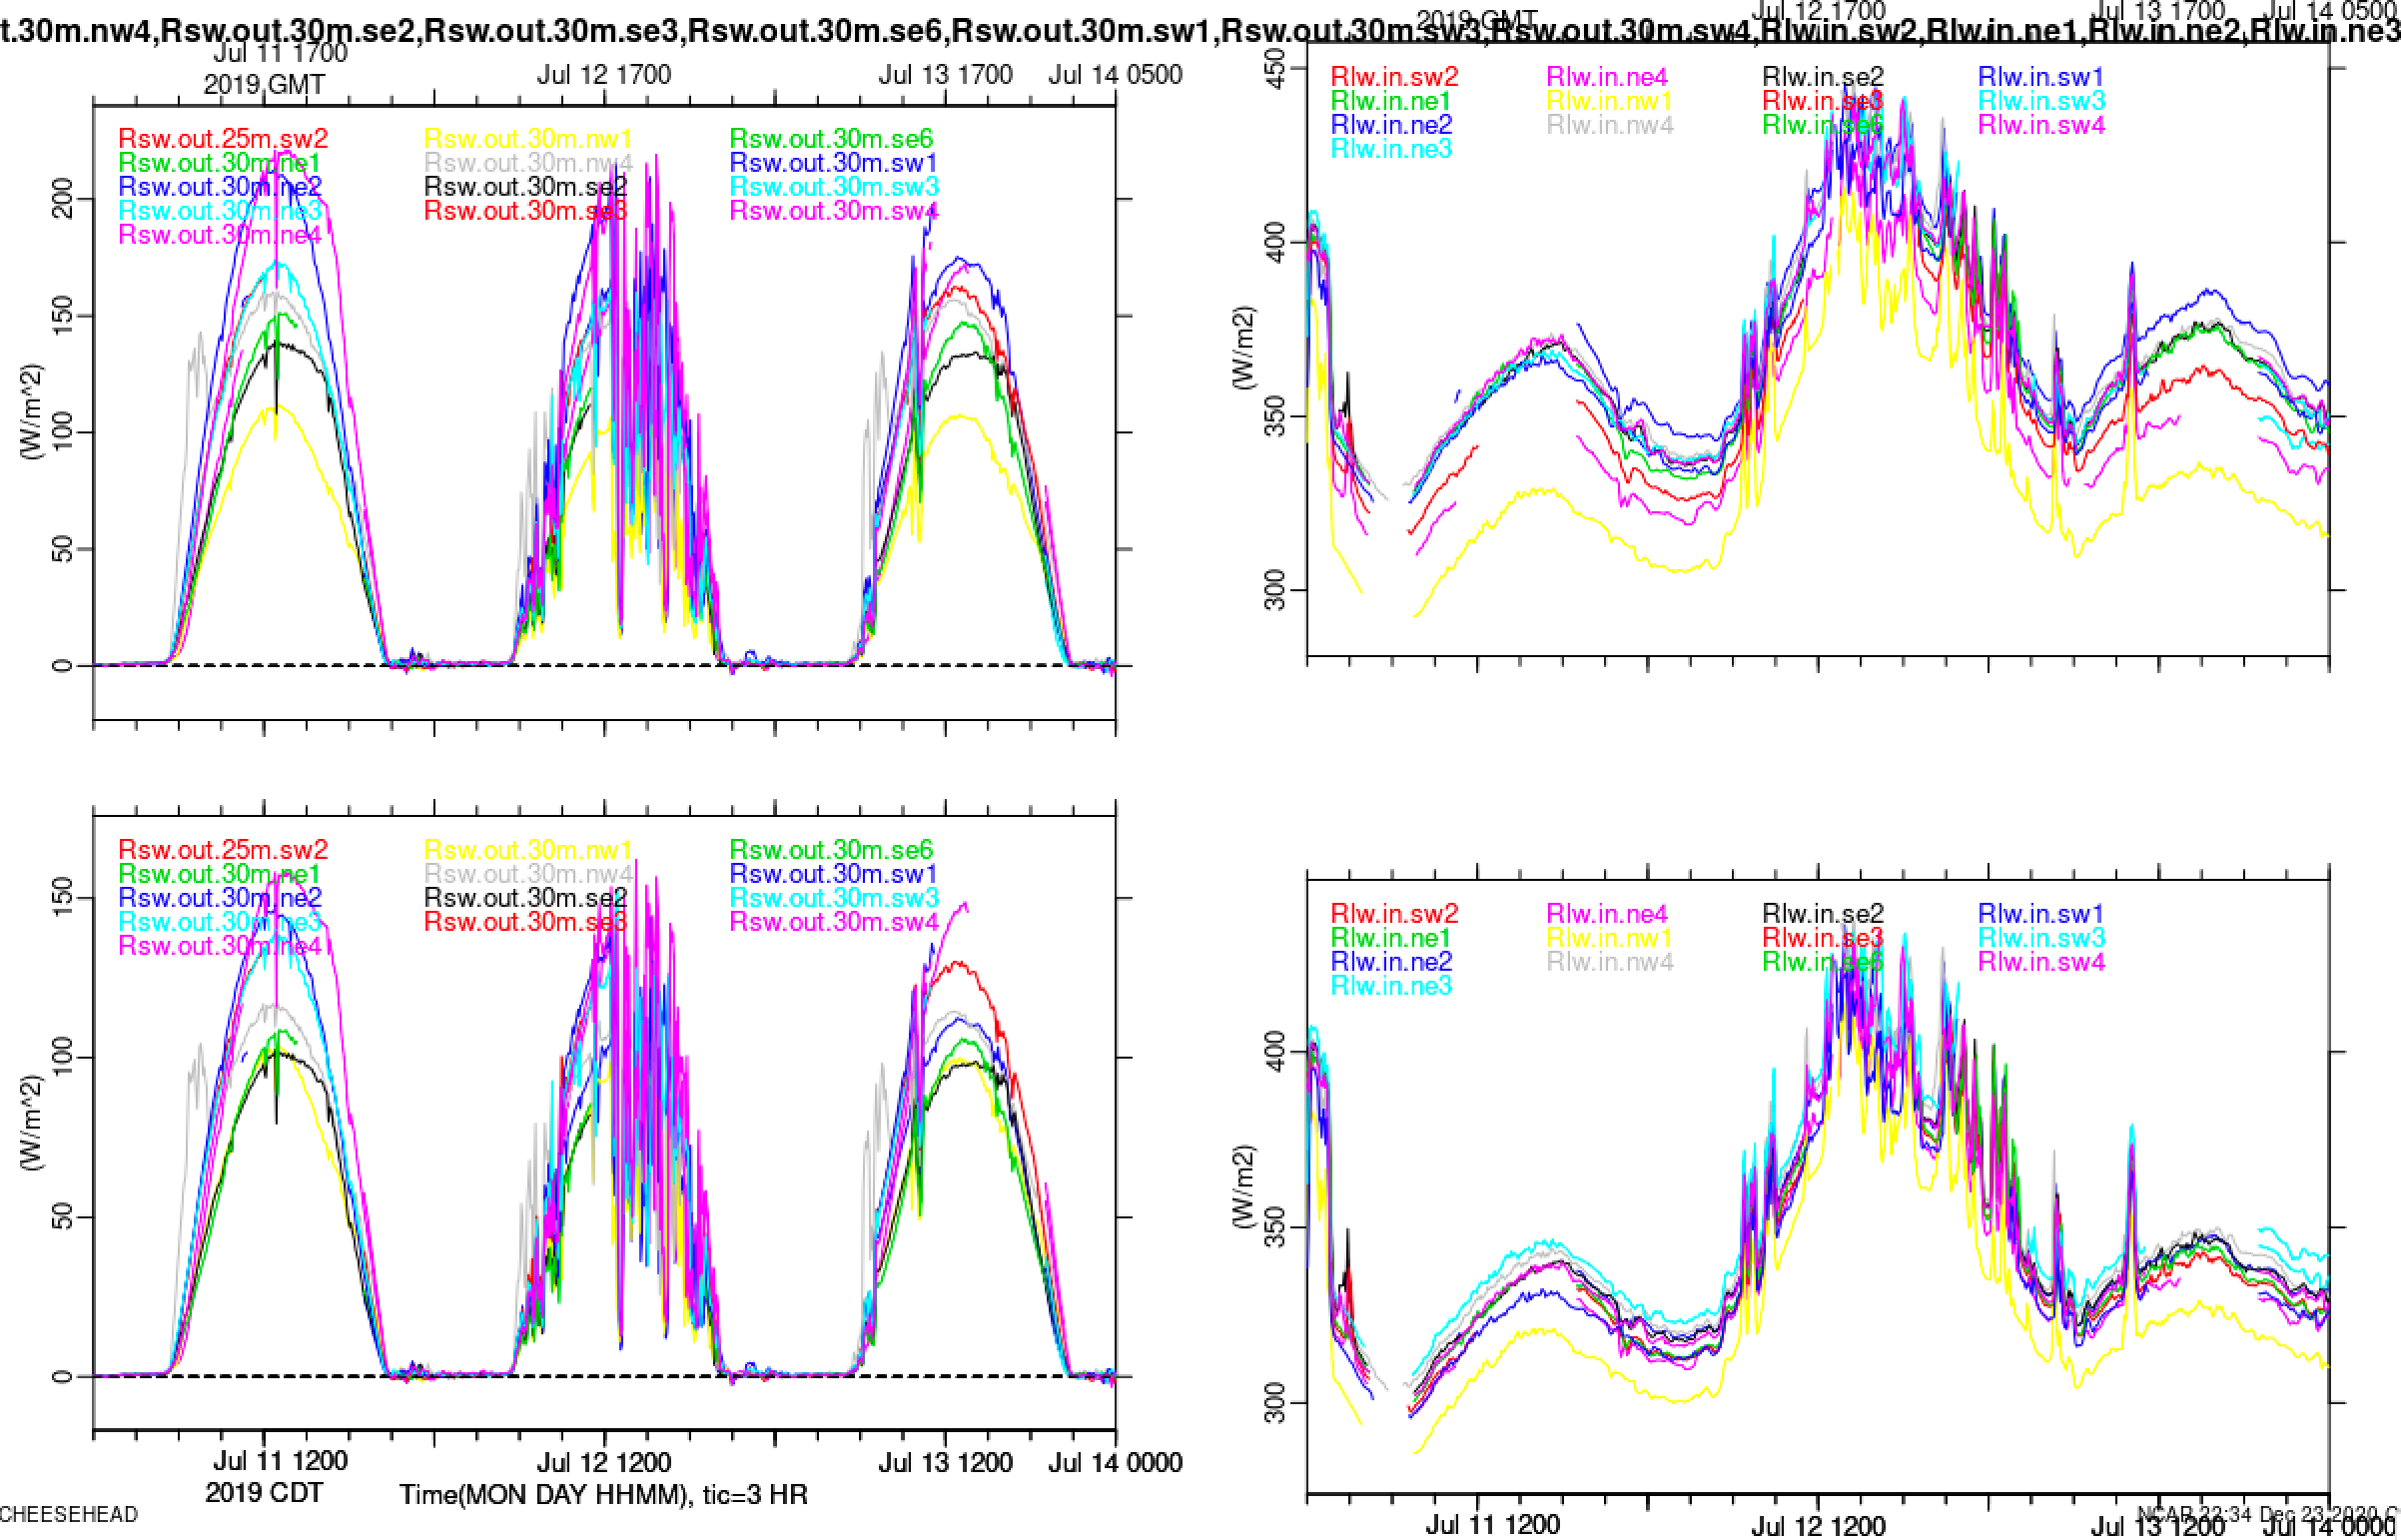
Sensors with serial numbers greater than 14 are affected and require correction, i.e. apply the correct coefficients for Rsw.out and Rpile.in parameters and update the measured values, including derived Rlw.in and Rsum. Refer to the Table below for a list of the site, associated NR01 serial number, and whether corrections are required.
These measurements have been corrected for the 5-minute averaged data files (now version 2.0), and are available at the EOL Field Data Archive: https://doi.org/10.26023/ZPHJ-JW9W-2B0Y
| Site | NR01 Serial No. | Replacement Date |
Requires Coefficient Correction? |
|---|---|---|---|
| s1 | 7 | -- | No |
| s2 | 3 | -- | No |
| s3 | 8 | -- | No |
| s4 | 1 | -- | No |
| s5 | 10 | -- | No |
| s6 | 9 | -- | No |
| s7 | 6 | -- | No |
| s8 | 12 | -- | No |
| s9 | 16, 15, 26 | 2018 11 17 20:04:54, 2019 01 17 15:08:22 |
Yes, Yes, Yes |
| s10 | 11 | -- | No |
| s11 | 14 | -- | No |
| s12 | 5 | -- | No |
| s13 | 2, 25 | 2019 01 18 18:43:07 | No, Yes |
| s14 | 13 | -- | No |
| s15 | 4 | -- | No |
Several NR01s died during the project and were replaced. These were cleaned during service visits, but of course also were rinsed by rain events. Several of the tripods they were mounted on were noted to have shifted position (not level) during operations. We'll note these periods here, but keep the data, in case they are still useful (such as to qualitatively determine when there were clouds).
In general, observed data gaps in the time series unaccounted for below were due to network connectivity and animal damage (pulled/damaged cables).
For Site 4, the data gap between June – July was due to vandalism.
For Site 9, the data gap in Jun 15-21 was due to heavy winds that knocked down the solar panels. Data gaps between July-October and November were due to cell communication issues.
For Site 12, the data gap between August and October was due to damage to the radiation stand and mote, likely caused by baby pigs or sheep that are able to fit under the 3 wire fence. Around Nov/14 the radiation stand was moved ~.5m closer to the fence, so it has a better view of the field on the other side. No discontinuities or discrepancies apparent in the time series.
For Site 14, the data gap between July and November was due to bad Tcase sensor.
We have added Tsfc derived from the downward-looking infrared radiometer and Rsum derived as the signed sum of the 4 radiation components to the average statistics.
Sonic anemometers/H2O/CO2 gas analyzers
Sonic anemometers and H2O/CO2 gas analyzers were deployed at 7 sites, primarily to measure net evapotranspiration. No problems were noted during operations. These instrument -- especially the gas analyzers -- are affected by rain. An internal sensor diagnostic flag was used to remove most rain-related errors, though we have noticed cases where a few samples are missed at the beginning and end of these events. Data during rain are to be used with caution. We also applied maximum and minimum value filters to the H2O and CO2 measurments to remove large spikes in the data.
We have added the variable w't' and corrected the variables w'h2o' and w'co2' using the WPL and spatial separation corrections as described here to the average statistics.
2D sonic anemometers
No problems noted during operations. No problems were found during QC processing.
Temperature/Relative Humidity sensors
Occasional issues with fans or sensors dying that were replaced.
Barometers
PTB210 barometers were used at all sites to measure the station pressure. One failed at s14 and was replaced. Another failed at s8 and was replaced with a PTB220. No additional problems were noted during QC processing.
Soil sensors
A set of soil temperature profile sensors, moisture, heat capacity, and heat flux sensors were deployed at each of the 15 sites to measure the soil heat flux term of the surface energy budget. Several sites had damage due to animal (both wild and domestic) activity as well as exposure due to flooding at one site that washed away soil from the measurement plot. In addition, several sensors died. Even more, the Binder cables to these sensors (or the mote that collected their data) became unplugged. As a result, there are many extended periods (up to 3 months) without soil data.
Temperature: Some probes reported bad values and were replaced. There also may be some calibration issues. During one set of post-cals, temperatures were off by as much as 0.3 degC.
Moisture: These were initially installed at 2.5cm. However, GRAINEX data suggested that this is too shallow, allowing an influence (lower moisture) of the surface. Thus, during the mid-November site visits, Qsoil sensors at all sites were moved to 5cm. At most sites, the calibration did not appear to have changed significantly due to this action. Gravimetric soil comparisons were made at all sites. (We are grateful to Pablo Bolletti of INTA for his help weighing these samples!) . Based on these observations, a bias of up to 13% has been added to about half of the sites. (The others had a bias near zero.)
| Site | Dry Soil Density (g/m^3) | Qsoil bias (%vol) |
|---|---|---|
| 1 | 0.88 | 0 |
| 2 | 1.14 | -12 at first; -7 after replacement |
| 3 | 1.24 | 0 |
| 4 | 1.14 | -6 |
| 5 | 1.24 | 0 |
| 6 | 1.27 | -12 |
| 7 | 1.17 | -13 (for both before and after replacement) |
| 8 | 1.20 | -7 at first; -10 after replacement |
| 9 | 1.42 | -8 |
| 10 | 1.12 | 0 |
| 11 | 1.24 | 0 |
| 12 | 1.04 | 0 |
| 13 | 1.63 | 0 |
| 14 | 1.00 | 0 |
| 15 | 1.19 | 0 |
Heat capacity: Probes at sites 5 and 15 failed and were replaced. Data while these were not working have been removed. From the response to rain events, it appears that probes at sites 2, 6, and possibly more, may have been installed horizontally, rather than vertically, allowing water to pool on the upper surface of the sensor. (This misorientation was not noted, even by personal recollection, by the tear-down crew.) These data have not been removed, since the data after the soil dried may be usable.
Heat flux: No issues noted during operations, other than cable, mote, and sensor exposure as noted above. Some evidence of midday shadowing of the soil plot by the radiometer is visible in the data for, especially s9, where there was essentially no vegetation that added its own shadowing.
We have added the calculation of heat capacity and surface heat flux (measured at 5cm plus the soil heat storage term) to the statistics, folllowing the procedure here.
Precipitation
Tipping buckets were used at all sites, except site 6 where the amounts should be the same as site 7 (1.4km away). In addition, Ott optical distrometers were deployed at 10 of these sites (see site table above), both for comparison and to measure the precipitation size distribution. Size distribution data (available every minute) are not part of standard ISFS data processing, but have been created as separate data files and will be available as a companion dataset.
During many station visits, tipping buckets were found to be clogged. Thus, we expect precipitation amounts from these sensors to be underreported. We manually removed data from the sites with tipping buckets only (not sites with both tipping buckets and Ott disdrometers) when we found strong evidence of the bucket being clogged and later cleaned during a site visit. This has resulted in a few periods of missing precipitation data.
We also removed tipping bucket data at points when the Ott disdrometers measured above a specific precipitation threshold while the tipping buckets recorded values of zero. This had the effect of removing points when we suspect the tipping bucket is clogged, but only during precipitation events (thus the data will still report zero when it is not raining, despite the bucket having likely been clogged). This was only possible at sites with both Ott's and tipping buckets.
In addition, "false tips" were identified in the tipping bucket data. Several of these were test tips, as they were done as part of station servicing. In some cases these were due to animals that had taken up residence in the gauges, while in others a loose ball joint may have allowed the gauges to wiggle in high winds. However, in many cases we suspect that the buckets were mostly clogged, allowing some water to trickle through the funnel so that precipitation was recorded hours or days after actually occuring. We have removed these false tips as much as possible, by comparing against either the Ott disdrometers or the wetness sensors at each site. This was done for all sites.
Finally, several of the tipping buckets had periods of extreme precipitation rates that we suspect were due to an unidenitified fault with the electronics of the sensor. Data during these periods were manually removed; except in the case of site 3, for which we removed all of the tipping bucket data due to this issue persisting for much of the project despite repeated attempts to fix the issue in the field.
In contrast to the tipping buckets, no isssues were found with the Ott data. Thus, their values are to be preferred when available.
----------
We have provided a companion dataset that includes particle size and fall speed histograms measured by the disdrometer every minute.
OTT Histogram Data Archive: https://doi.org/10.26023/8EJ0-7ZZ8-QC0C
The output of each minute looks like:
2018 07 06 12:59:02.1573 60.01 8, 14 4142 410949;0000.089;51;19831;007;20665;00177;0;000;000;000;000;000;000;000;000;000;000;000;000;000;000;000;000;000;000;000;000;000;000;000;000;000;000;000;000;000;000;000;000;000;000;000;000;000;000;000;000;000;000;000;000;000;000;000;000;000;000;000;000;000;000;000;000;000;000;000;000;000;000;000;000;000;000;000;000;000;000;000;000;000;000;000;000;000;000;000;000;000;000;000;000;000;000;000;000;000;000;000;000;000;000;000;000;000;000;000;000;000;000;000;000;000;000;000;000;000;000;000;000;000;000;000;000;000;000;000;000;000;000;000;000;000;000;000;000;000;000;000;004;000;000;000;000;000;000;000;000;000;000;000;000;000;000;000;000;000;000;000;000;000;000;000;000;000;000;000;000;000;000;001;001;001;000;000;000;000;000;000;000;000;000;000;000;000;000;000;000;000;000;000;000;000;000;000;000;000;000;000;000;000;000;003;001;000;000;000;000;000;000;000;000;000;000;000;000;000;000;000;000;000;000;000;000;000;000;000;000;000;000;000;000;000;000;001;002;000;000;000;000;000;000;000;
where each record has a date/time stamp and the "8," in the first line shows that this is from station 8. Not the station ID will always be before the comma. The (mostly) 000 values starting at about column 44 of the second row are particle counts in the histogram.
