Introduction
This document gives an overview of the measurements taken using the Integrated Surface Flux System (ISFS) and conditions during the CASES99 field experiment.
NCAR ISFF data for CASES-99 from the main tower and 6 surrounding stations are available in the following forms:
- 5-minute averages of first and second-order moments
- Sample-rate data from the main tower and 6 stations
Field Logbook
Also available is a computer-readable logbook of comments noted by ISFF personnel.
Status of 5-minute Statistics
Update Feb 11, 2005: Long-wave radiometer values during operations were added along with Tdome and Tcase values corrected for the various problems mentioned on the WWW page.
On May 11, 2001 new versions of the 5-minute statistics were made available on the web in NetCDF and ASCII form. The following corrections were applied to the new statistics.
- Wind data from sonic anemometers has been corrected for sonic tilt and bias. More information on the sonic tilt correction can be found at NCAR ISFF Sonic Anemometer Tilt Correction
- Wind vectors from sonic anemometers have been rotated from instrument coordinates to normal meteorological coordinates (+u is wind TO the east, +v is wind to the north).
- Brian Skelly@UCONN reported some incorrect wind vectors in the 5 meter campbell sonic data at the main tower. The problems have nicely disappeared in the new version. Apparently a wrong rotation was applied to the previous statistics which were computed in the field.
- Until October 5th, the long wave radiometers were deployed on an intercomparison stand, south of the main tower. During this period, the radiometer variable names now have an ".ic" suffix.
- The latitude, longitude and altitude values in the NetCDF files for the six outlying stations were wrong. Corrected on May 16, 2001.
Location
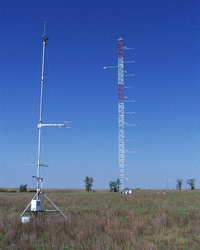
ISFF operated 6 10m towers and one 55m tower in a tightly spaced array (sites 1, 2, 3, 4, 5, 6 and 55 shown in the Site Plan). These were in the NE corner of section 2, T28S R6E (the corner of 120th and Ellis Rd), about 5 km SE of Leon, Kansas (about 50 km W of Wichita, Kansas). The approximate locations of all sites were:
- 55m tower: 37 deg 38.88'N (37.64800 deg), 96 deg 44.14'W (96.73567 deg), 433.7m
- Site 1: 37 deg 38.9359'N (37.64893 deg), 96 deg 44.1044'W (96.73507 deg), 435.9m (100m at 65deg from 55m tower)
- Site 2: 37 deg 38.8501'N (37.64750 deg), 96 deg 44.1881'W (96.73647 deg), 433.1m (100m at 185deg from 55m tower)
- Site 3: 37 deg 38.9368'N (37.64895 deg), 96 deg 44.2308'W (96.73718 deg), 432.5m (100m at 305deg from 55m tower)
- Site 4: 37 deg 38.9895'N (37.64983 deg), 96 deg 44.3219'W (96.73870 deg), 435.9m (280m at 305deg from 55m tower)
- Site 5: 37 deg 38.7570'N (37.64595 deg), 96 deg 44.1862'W (96.73644 deg), 433.1m (300m at 185deg from 55m tower)
- Site 6: 37 deg 38.9809'N (37.64968 deg), 96 deg 43.9994'W (96.73332 deg), 438.6m (300m at 65deg from 55m tower)
I think that the 55m tower location was from hand plotting on a map and the site 1-6 locations were from the last GPS value on tear-down. However, the radial positions should be more accurate. GPS positions noted during the experiment were:
- Site 1: 37 deg 38.9398'N (37.64900 deg), 96 deg 44.1133'W (96.73522 deg), decl 5.1W
- Site 3: 37 deg 38.9298'N (37.64883 deg), 96 deg 44.2320'W (96.73720 deg), decl 5.3W
- Site 4: 37 deg 39.0100'N (37.65017 deg), 96 deg 44.3267'W (96.73878 deg), decl 5.1W
Since the two GPS positions for site 1 appear to agree well, we can adjust a grid to agree with it. A set of values which are centered on the GPS position for site 1 and are consistent with the radial positions from the 55m tower are:
- 55m tower: 37.64855 deg N, -96.73610 deg W
- Site 1: 37.64893 deg N, -96.73507 deg W
- Site 2: 37.64766 deg N, -96.73620 deg W
- Site 3: 37.64907 deg N, -96.73703 deg W
- Site 4: 37.64999 deg N, -96.73870 deg W
- Site 5: 37.64587 deg N, -96.73640 deg W
- Site 6: 37.64969 deg N, -96.73302 deg W
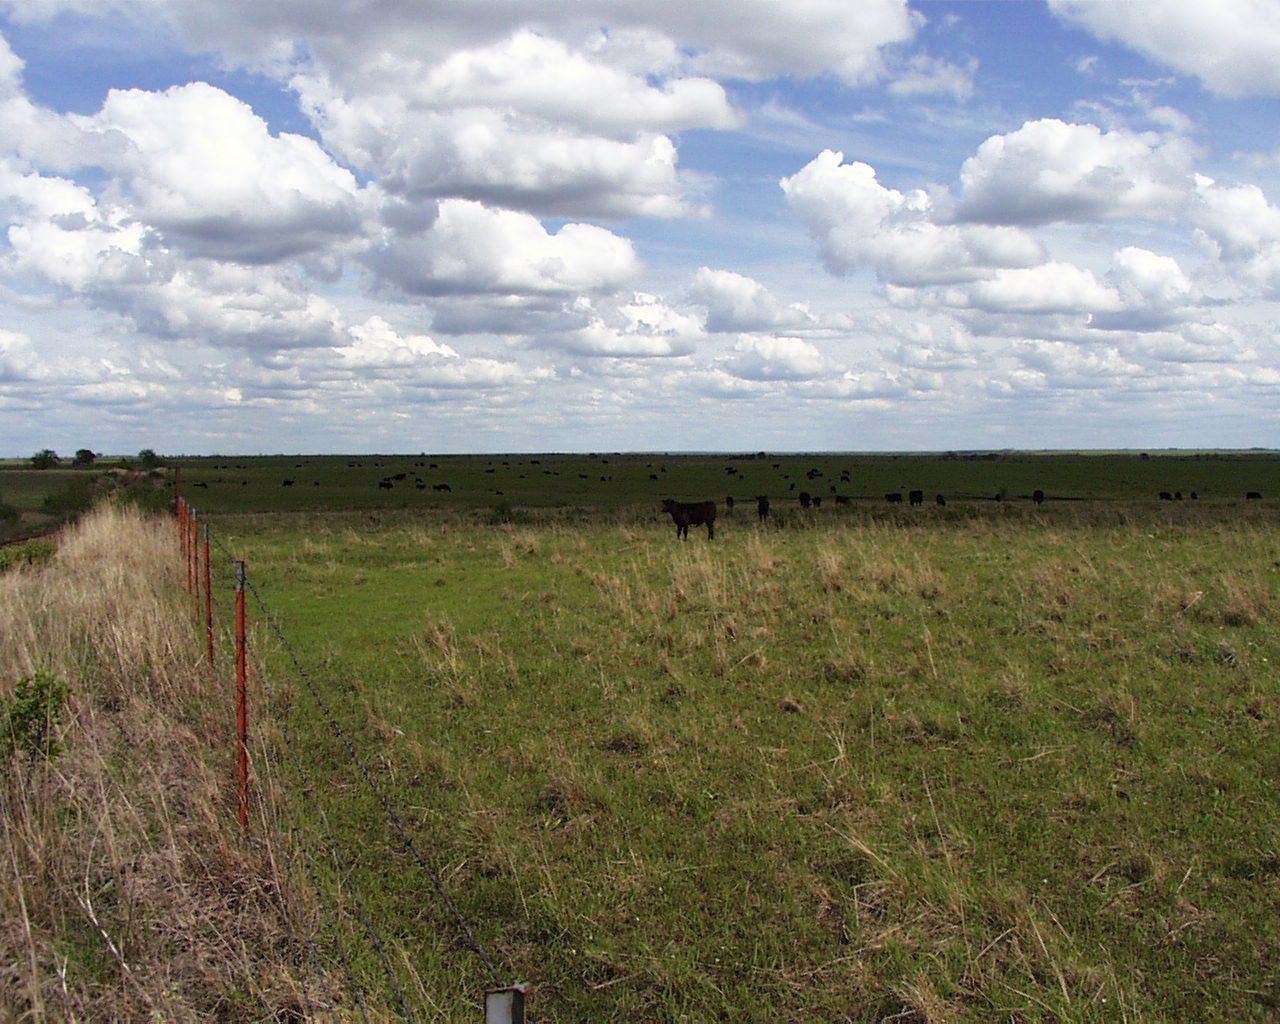
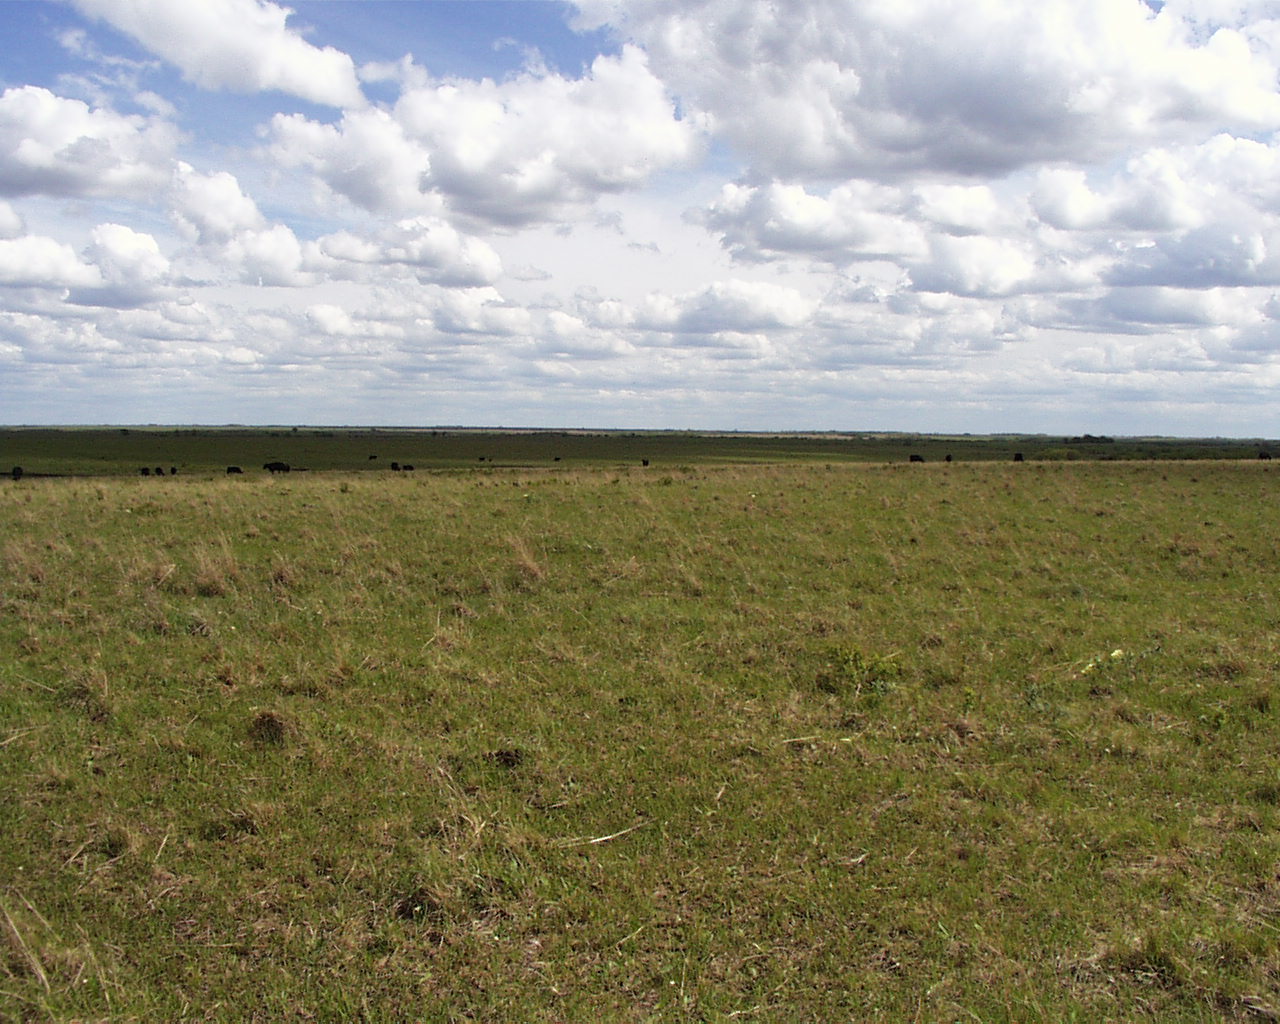
This array was developed to identify the length scales in three-dimensions of events, such as drainage currents, which may pass through the array. The surface was grass rangeland, which was relatively short since cows grazed it until 2 weeks prior to field operations. Prior to the experiment, the view from 1/2 mile west of this corner was: ENE, ESE, and SE.
The base trailer was located at the NW corner of 120th and Ellis, in the yard of an abandoned house.
Sensors
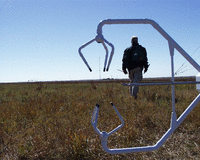
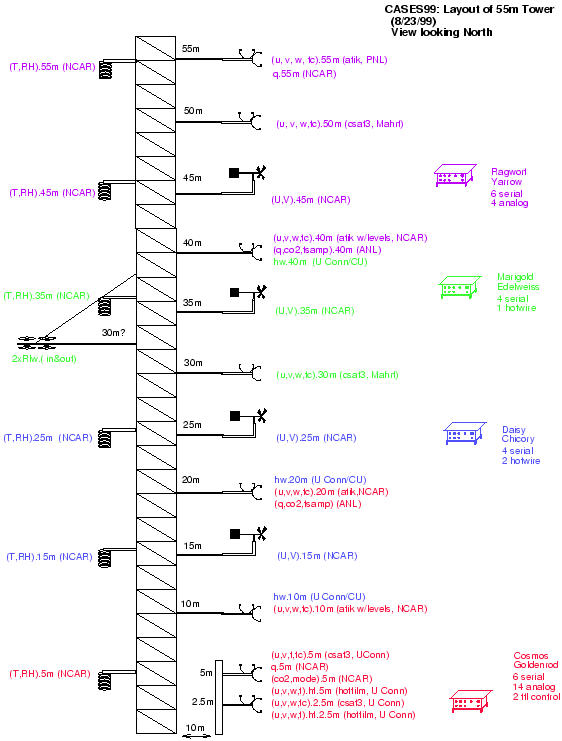
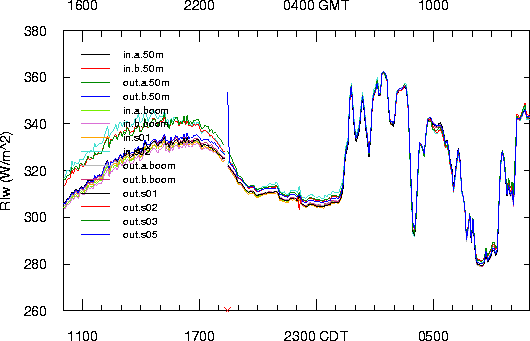
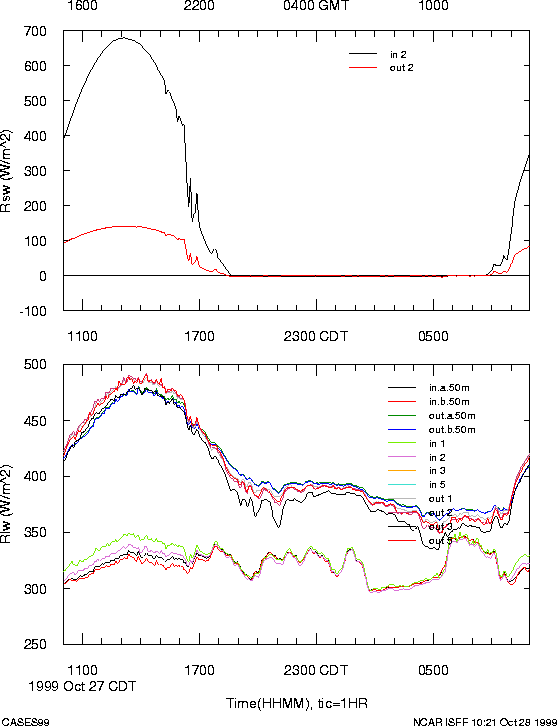
A diagram of the sensors on the 55m tower is available. Generally, there is a wind and temperature measurement every 5m, with turbulent wind, temperature, and humidity measured at least every 10m. A boom mounted at 47m has a pair each of upward and downward-looking longwave radiometers. These measurements will be combined with those from similar radiometers mounted on 4 stands near the surface to attempt to measure the radiative flux divergence at night.
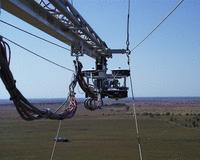
We are acquiring data from several user-supplied sensors on the 55m tower:
- Hot-wire anemometers at 10, 20, and 40m, sampled at 9600 samp/s. The equipment is supplied by David Miller (Univ. Conn.) and operated by Julie Lundquist (Univ. Colo.)
- Hot-film anemometers/ Cold-film thermometers at 2.5 and 5m, sampled at 200 samp/s. These are supplied and operated by David Miller.
- H2O/CO2 open-path IR sensors at 20 and 40m, sampled at 20 samp/s. These are the NOAA/ATDD design, owned by ANL.
- Microbarographs at ?, 30, and 50m reporting at 20 samp/s. These are owned and operated by Joan Cuxart (INM, Spain).
- The CSAT sonic anemometers at 30 and 50m were supplied by Larry Mahrt (Oreg. State Univ.)
- The CSAT sonic anemometers at 2.5 and 5m were supplied by David Miller. These actually were mounted on a separate 5.5m tower 15m to the East of the 55m tower base.
- The ATI sonic anemometer at 55m was supplied by Chris Doran (PNL)
We also are acquiring data from microbarographs owned by Carmen Nappo at tower sites 4, 5, and 6.
A thermocouple array will be deployed on the 55m tower by Jielun Sun, with a self-contained data system.
Table of Variables
This table lists all variables that were sampled by the ISFF system during CASES99.
Known Instrument Problems
These are the general comments from sensor summaries which are at the end of the logbook. Refer to these logbook entries for more details.
Sensor Maintenance
The sonic anemometer booms on the main tower were raised for sensor maintenance from time to time. Maintenance on the 6 PAM stations may have required that the mast be lowered. Either of these actions rotates the sonic anemometer so that the w axis has a large horizontal component. The obvious signature of these periods are anomalous sigma-w (variable w'w' in the 5 minute data). These periods have not been edited from the data, in either the 5 minute statistics or the high rate data. Most of the maintenance periods are documented in the field logbook but probably not all. If you see questionable sigma-w, check the field logbook for entries concerning maintenance of the sonic anemometer, fast water vapor or CO2 sensors, or hot wire anemometers.
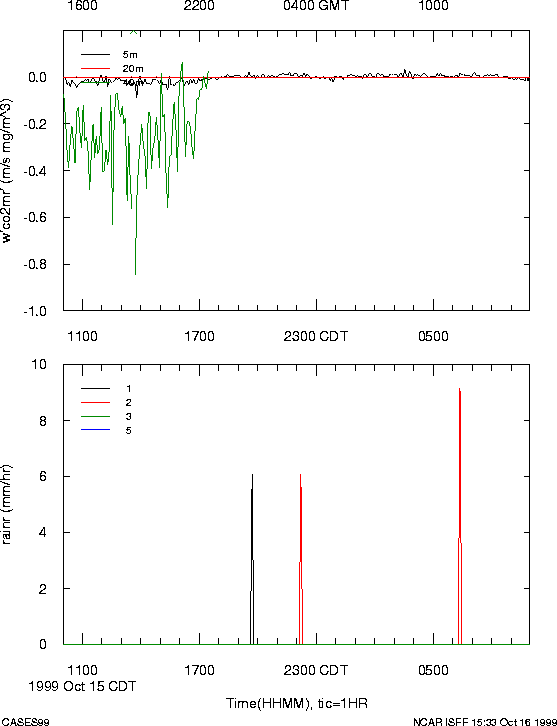
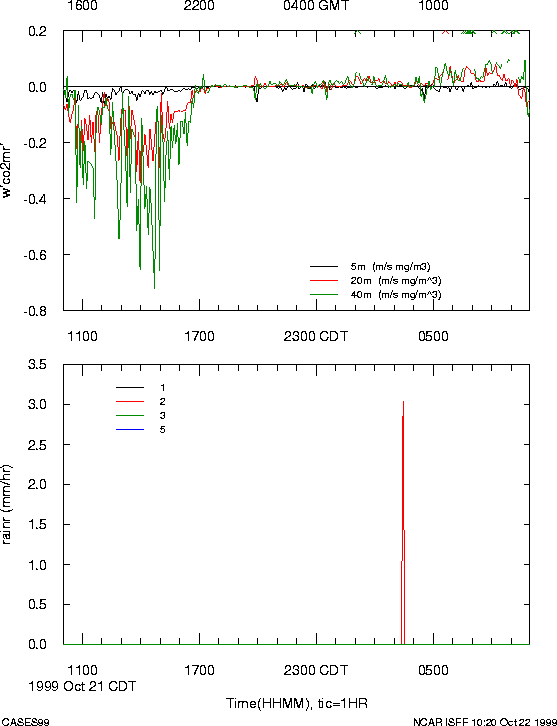
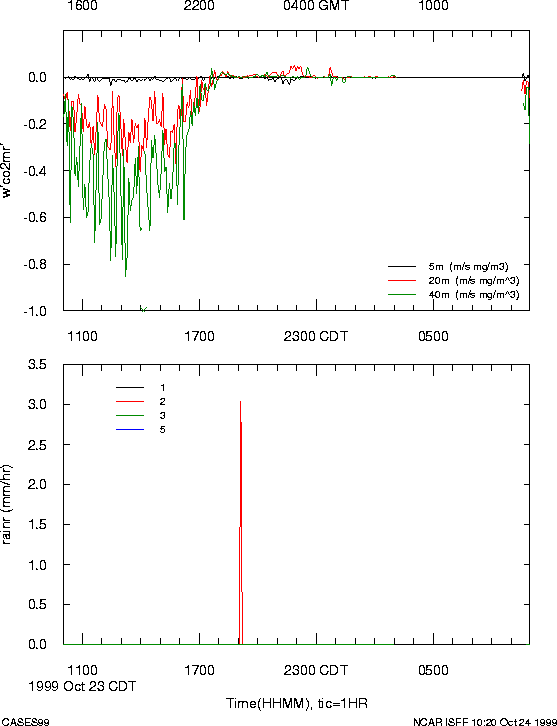
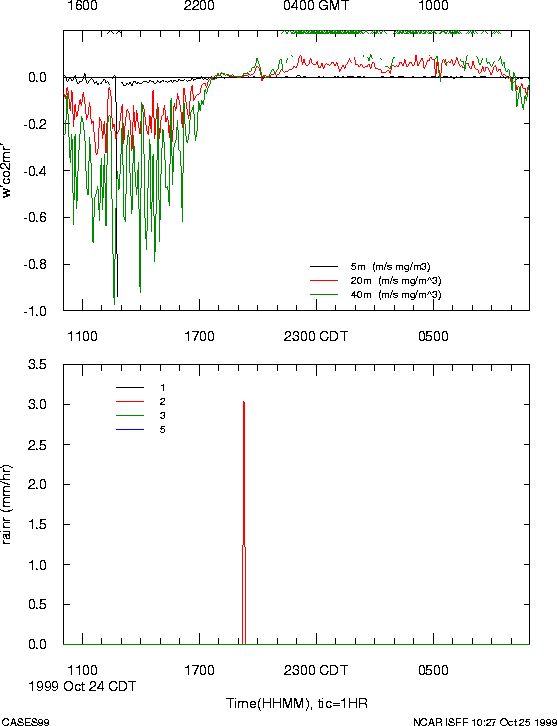
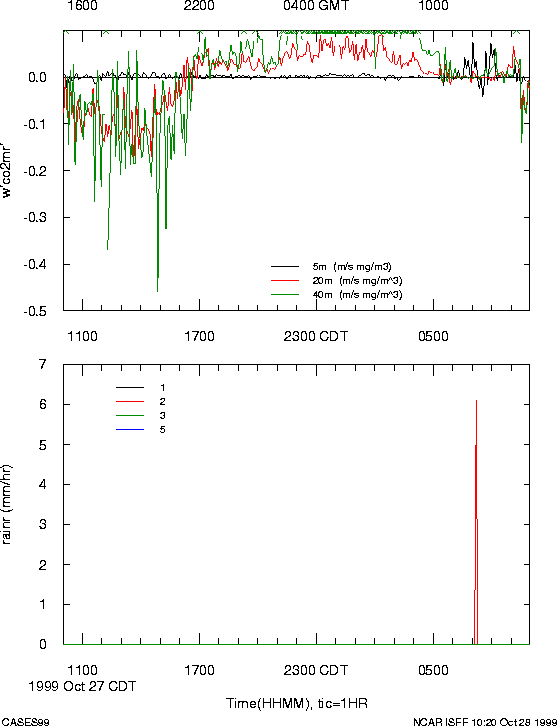
Rain
From the logbook, there appear to have been 3 significant rain events during CASES99:
- Morning of 13 Sep
- Night of 27-28 Sept
- Night of 29-30 Oct.
During the September events, our gauges were not connected to our data system since their data loggers were in use for the radiometer intercomparison. The October event wasn't seen in the data, possibly because the storm stopped our data systems. The data from stns 1&2 show small events earlier in October, but these may be spurious. Thus, the entire rain gauge data set probably is useless.
Sonic Anemometers
We had several configuration, electronics, and transducer problems with the sonics. Of the 9 NCAR sonics deployed, only 4 were never changed. The most serious probably was the 10m ATI which was misconfigured to report like a UW array and was used until 10 Oct. We might be able to recover these data.
All of the sensors used from other institutions (4 CSAT3s and 1 ATI K-probe) worked normally.
T/RH
Two sensors had problems during CASES99. Stn3 was noted to have had a bad fan from 29 Sep-9 Oct (possibly due to the rain on 28 Sep). 15m had a weak fan and old RH probe, which were replaced on 12 and 20 Oct, respectively.
Stn 5 died due to cable problems which were fixed 4 Oct. The data that are present should be good.
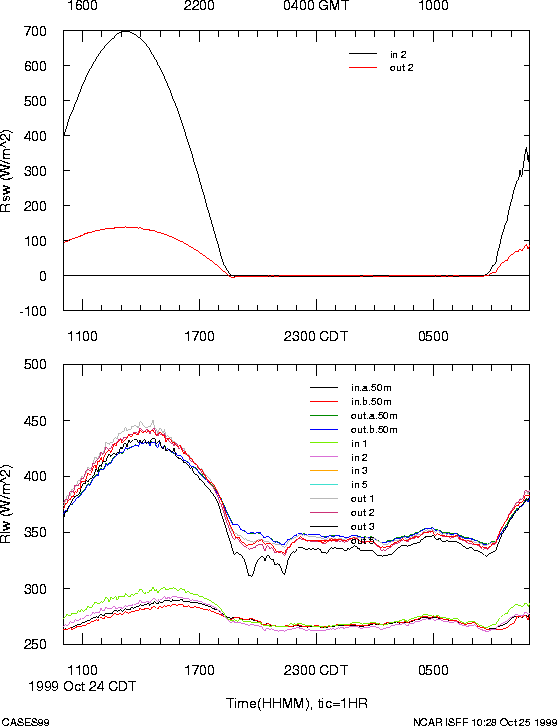
Radiometers
A complex set of radiometers was deployed during CASES99 to attempt to measure heating in the nocturnal boundary layer due to the flux divergence of longwave radiation. Unfortunately, there were several problems in this deployment:
- Radiometer sets intended for stn 1 were put at stn 2 and vice versa during the change from the "intercomparison period" (all sensors looking up on the same radiometer stand) to the "operations period" on 8 October.
- Radiometer sets intended for stn 3 were put at stn 5 and vice versa during the change from the "intercomparison period" to the "operations period".
- A bad coefficient was loaded (manually) into pyrgeometer S/N 31975.
- Coefficients loaded manually during the experiment apparently were entered with a leading 0.
- The CR10x data logger truncated all the Tdome and Tcase coefficients in the pyrgeometers (see Report).
Fortunately, all of these are correctable in post-processing, though this has not yet been done (6/02).
Prop-vanes
There was one prop failure noted during CASES99 (probably due to rain) which caused a loss of most data from 15m on the 58m tower between 28 Sep and 9 Oct. Station 5 lost data due to S-bus cable problems (I think) which were fixed 4 Oct.
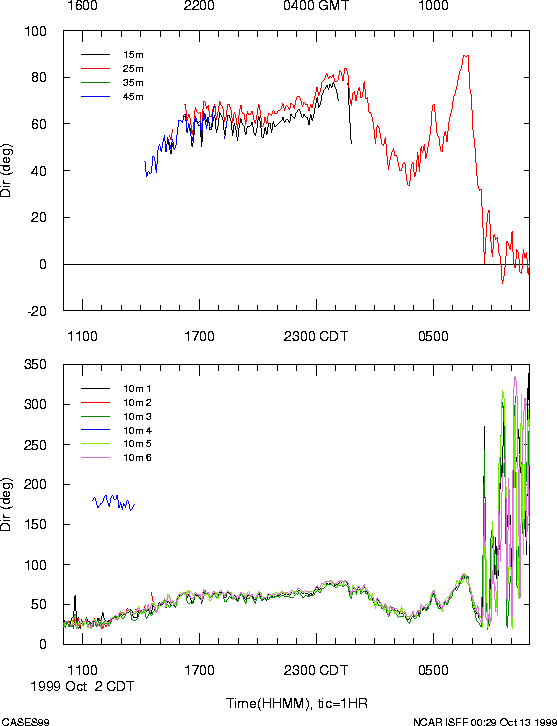
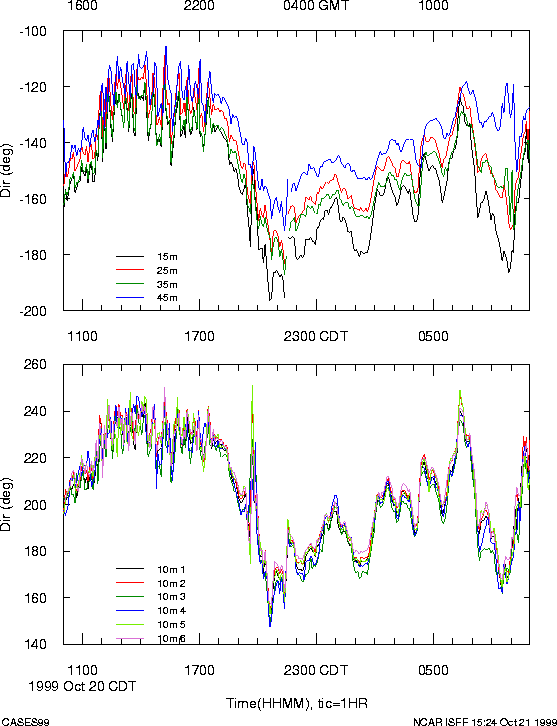
Wind directions from the tower appear not to have been very accurate. However, the boom angles were shot twice and differed by only 37 minutes at worst.
Wind directions from sites 1-6 were better behaved, with differences typically less than 3 degrees. Site 3 was the worst, with directions consistently about 3 degrees counterclockwise from the average of the rest. It is possible that this difference is real (since it was close to a gully). [Though it was site 2's boom angle that was different by 3 degrees during the two shoots.]
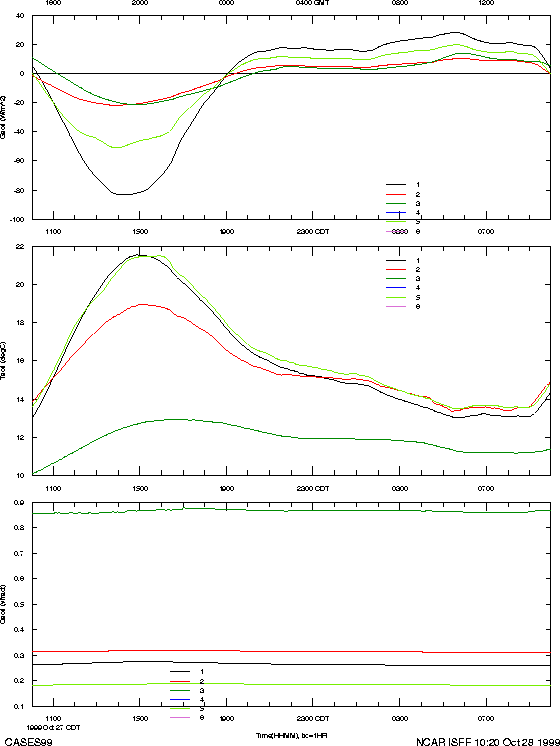
Everest Infrared Surface Temperature
The Everest at stn 3 died during the rain on 27-28 Sep. It was replaced 29 Sep.
Chronology
Day: Action
- 8 Sept: Base installed.
- 23 Sept: All sites reporting data.
- 1 Oct: Official start of operations.
- 31 Oct: Official end of operations.
- 10 Nov: Estimated end of tear-down.
Data Processing Notes
Time Jumps
Our data systems synchronized periodically to GPS time, as per the agreement between CASES99 investigators and our standard practice. The EVE data systems used for stns1-6 synchronized every 3 hours to GPS. The ADAM data systems on the 58m tower synchronized every 4 hours to our base computer, which in turn synchronized periodically to GPS. This has the potential to have time run "backwards", though we usually hope that the update rate is fast enough to make the clock update less than one sample period (50ms).
However, for the files on Oct 14, 00:00 UTC, our data show that some of the stations had "extra" samples, indicating that the EVE clocks were running fast and that the update rate was not sufficient. On this day, the number of extra samples at 20 samples/s was:
| s1 | 3 samples |
| s2 | 5 samples |
| s3 | 2 samples |
| s4 | 3 samples |
| s5 | -1 samples |
| s6 | 5 samples |
| cosmos (1.5-20m) | 755ms |
| daisy (10,20m hotwire; 15,25m props) | 801ms |
| marigold (40m hotwire; 30,35m anem.) | -176ms |
| ragwort (40-55m) | 1163ms |
This is only one example of the time differences and drift amounts were different at other times. In general, these drifts can be expected to change at least as a function of temperature.
For flux computations, it is only important that data be synchronized within a particular data system to better than one sample period, which is always the case for the CASES99 (and other ISFF) data sets. Therefore, we haven't attempted to "fix" these time tags. However, those investigators looking at event propogation between data systems or high-rate time series across the 3 or 4-hour boundaries to sub-second accuracy need to be aware of these time jumps.
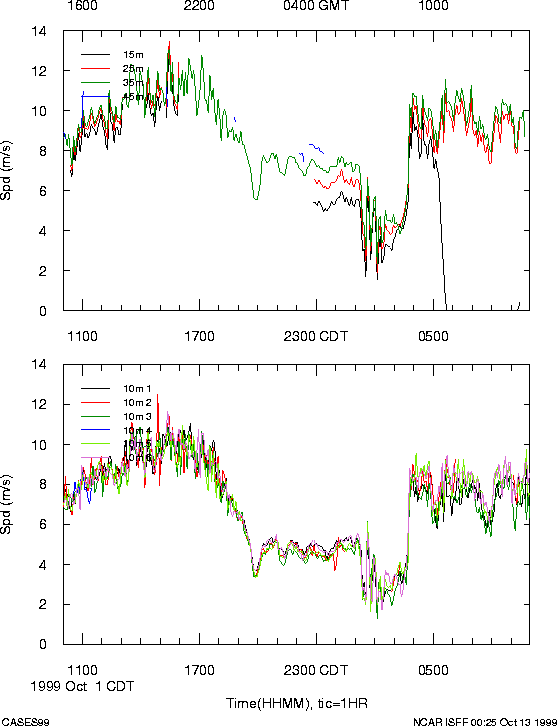
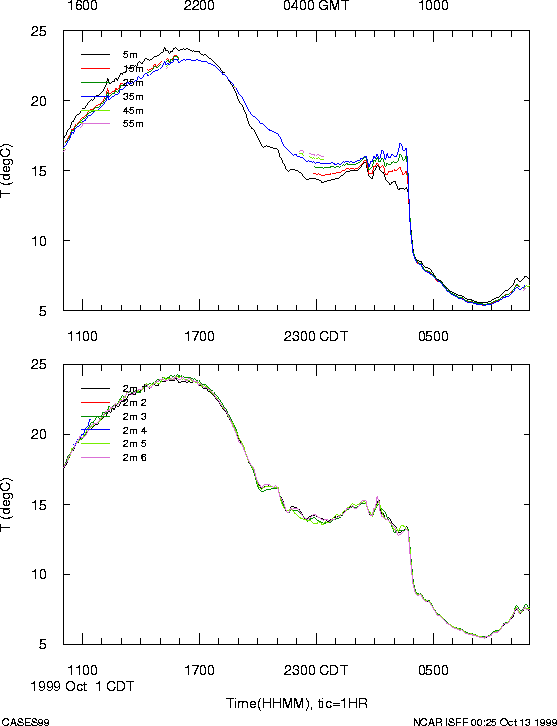
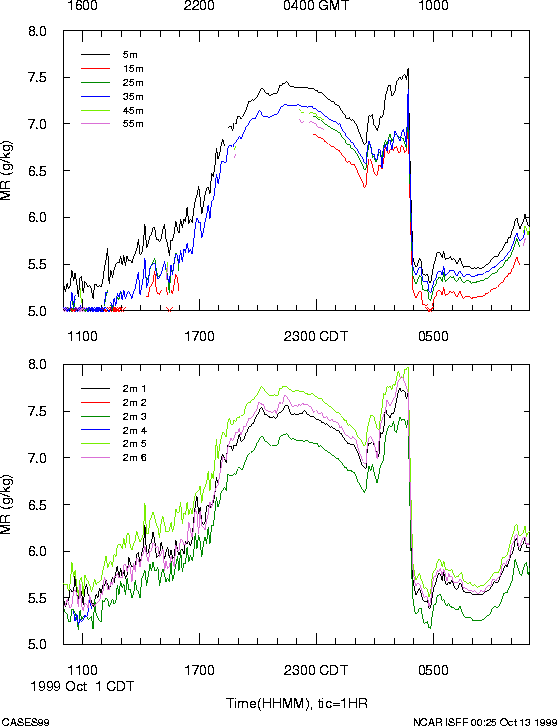
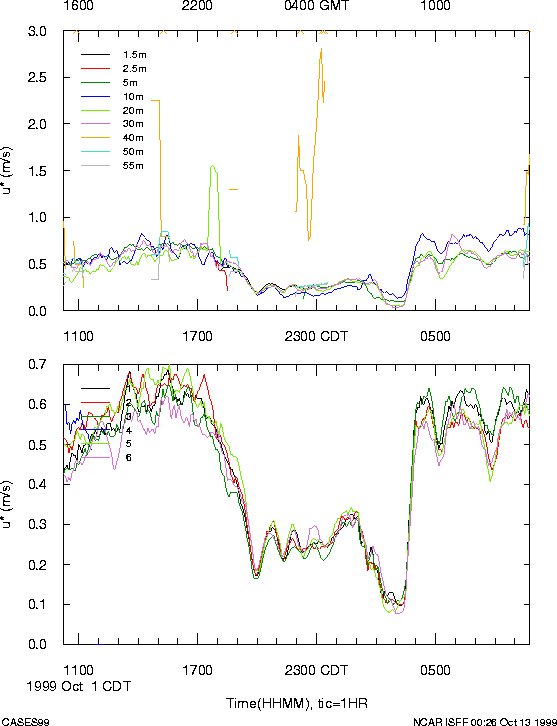
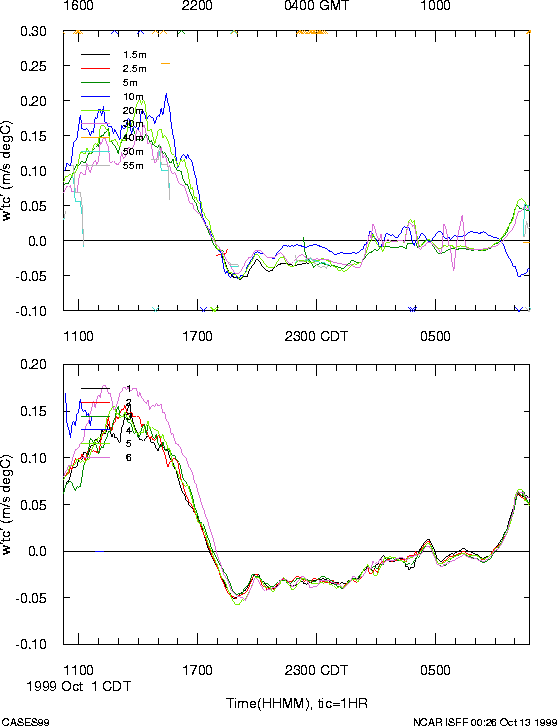
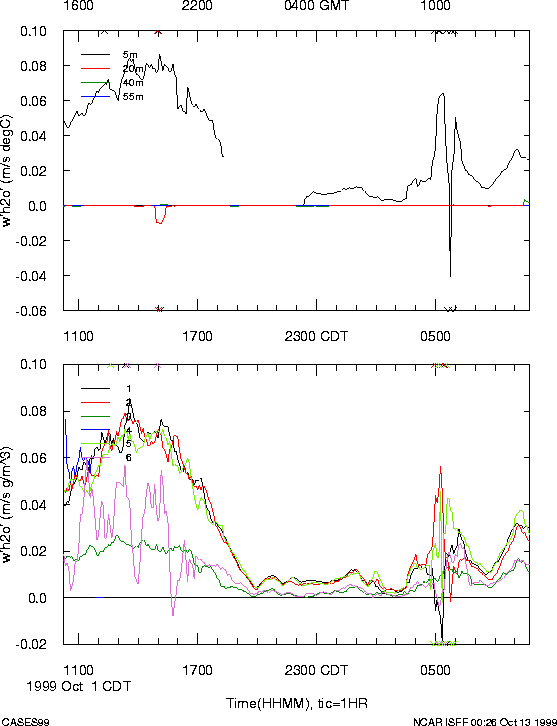
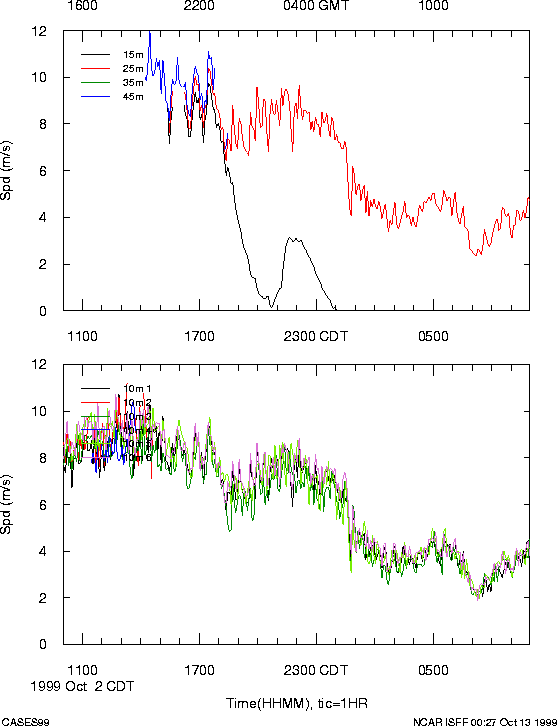
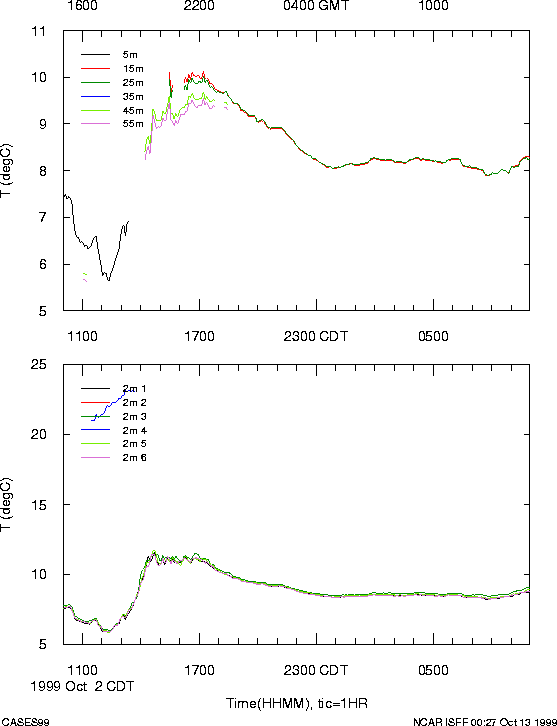
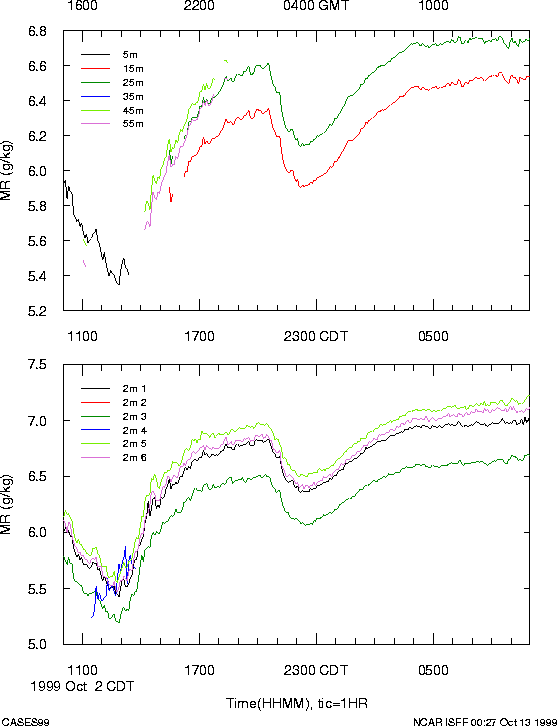
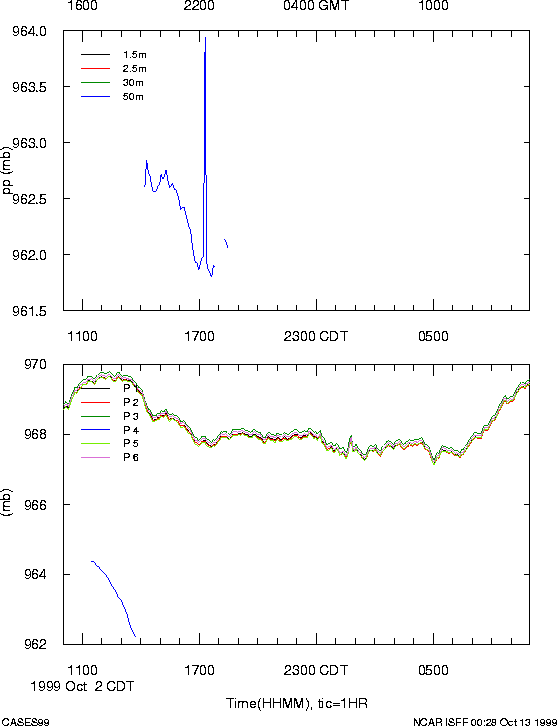
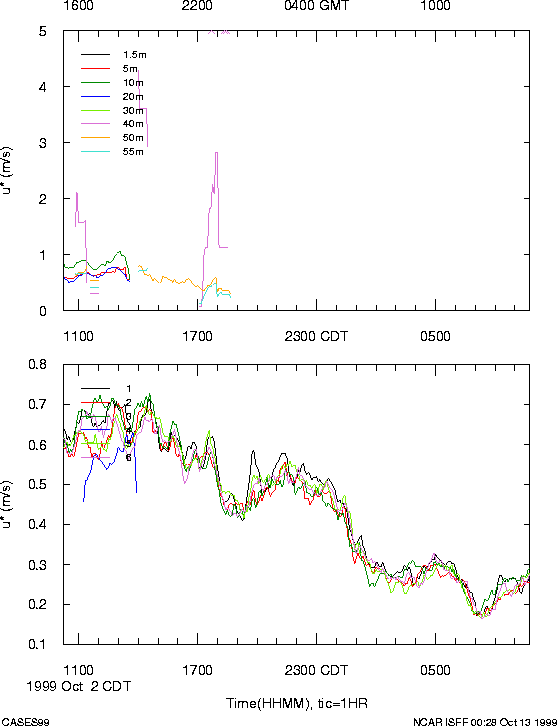
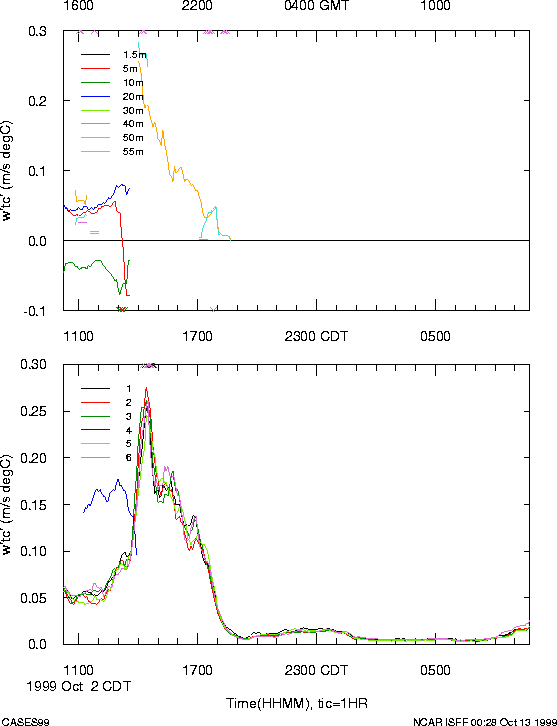
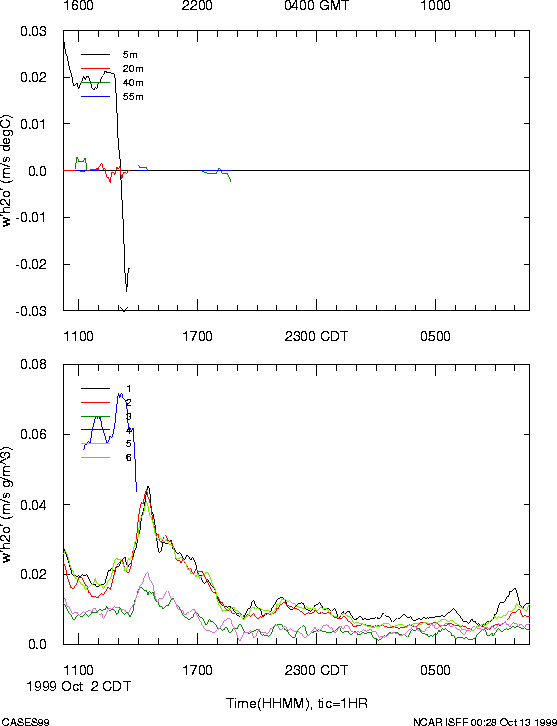
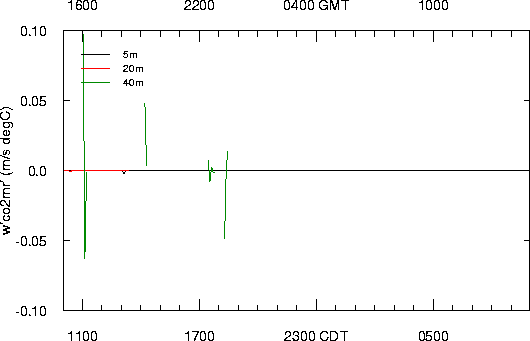
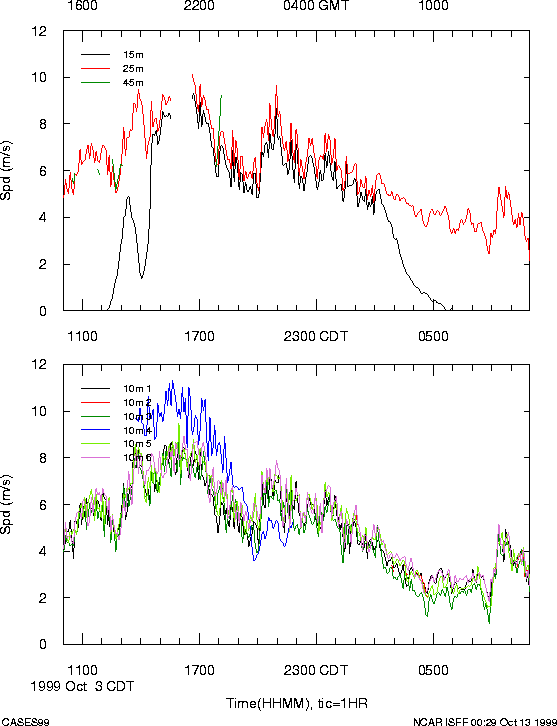
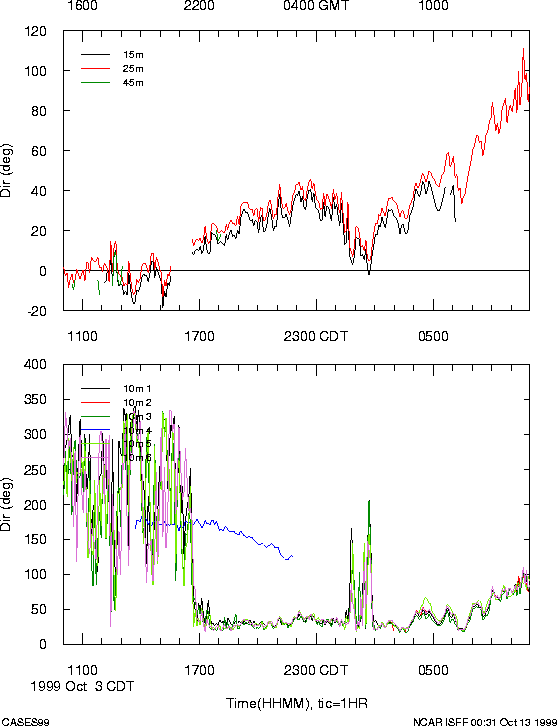
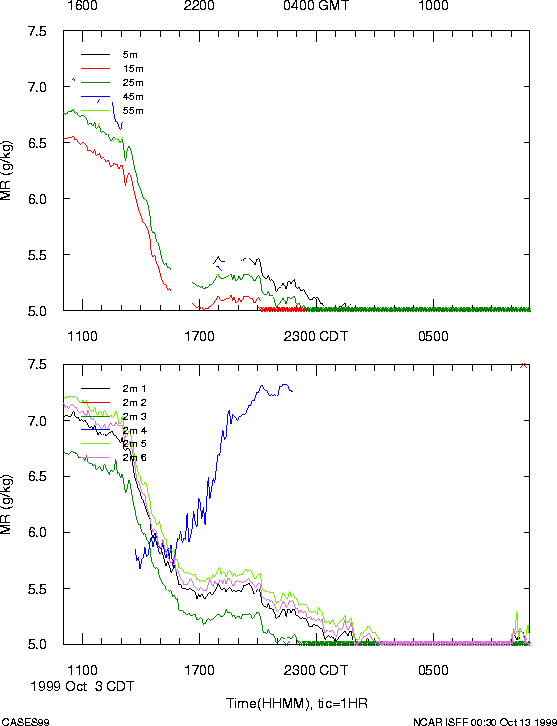
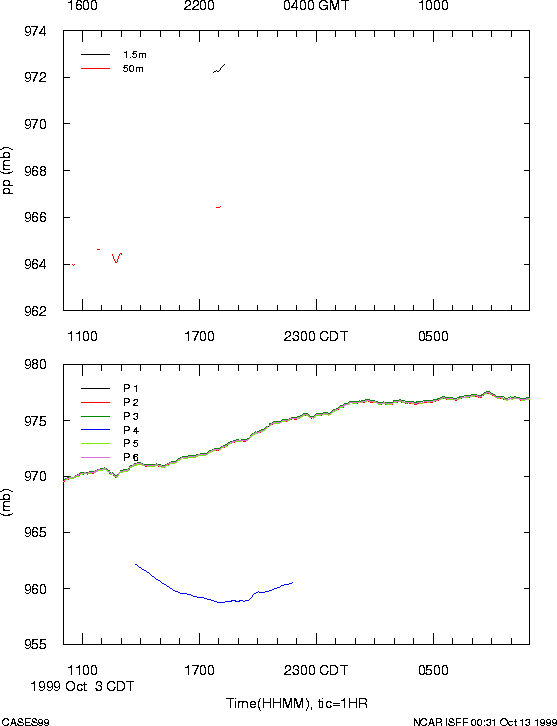
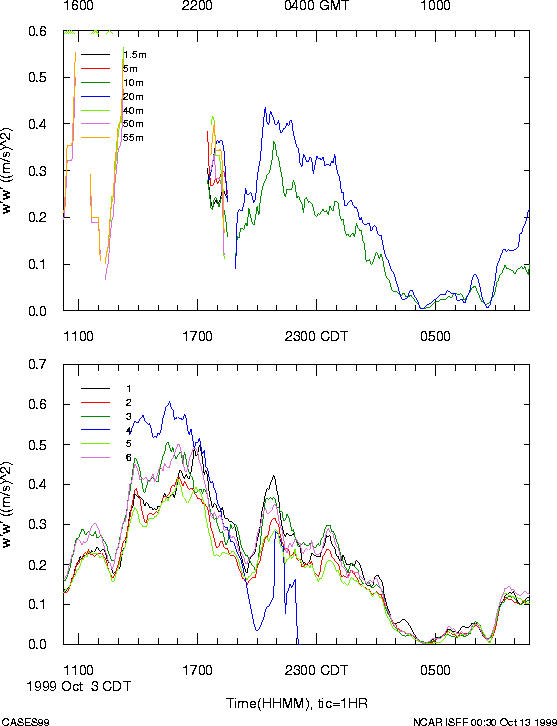
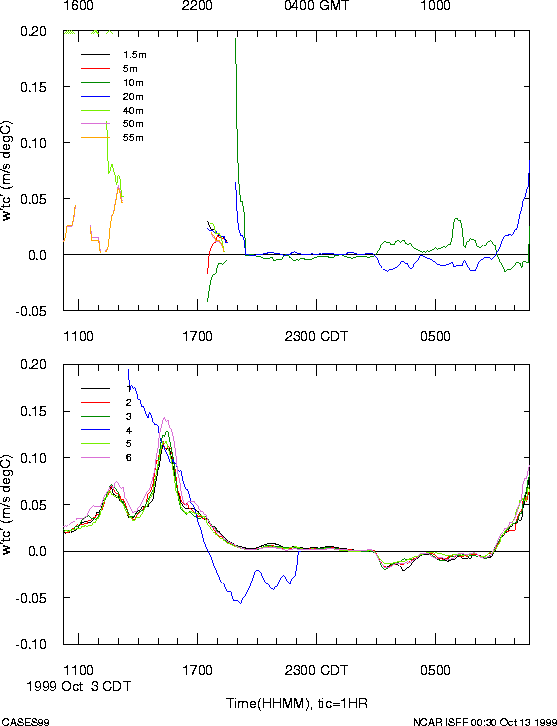
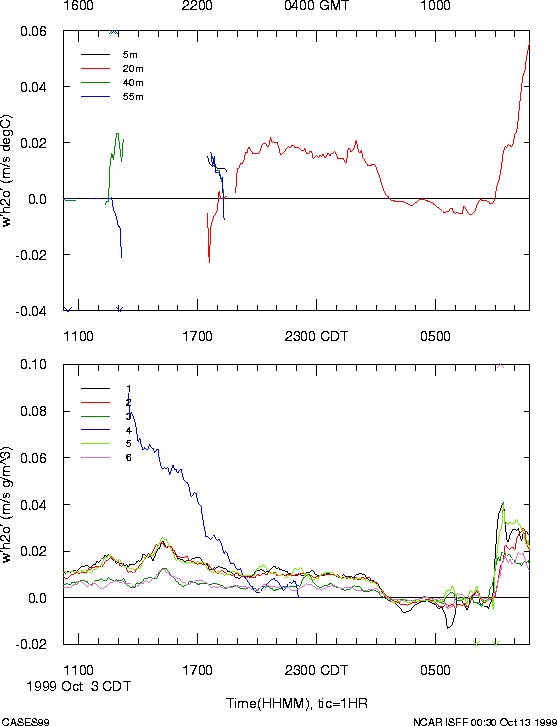
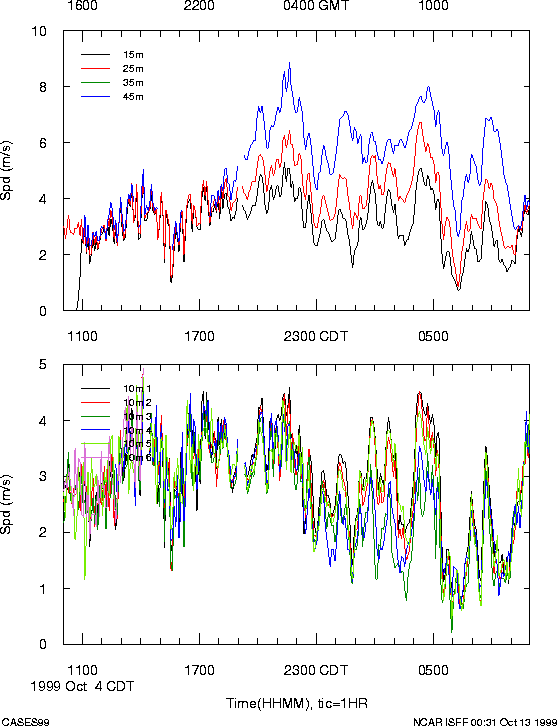
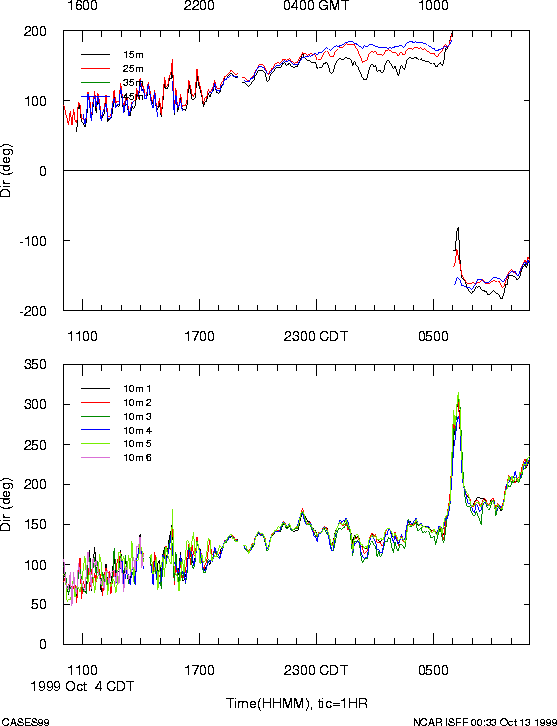
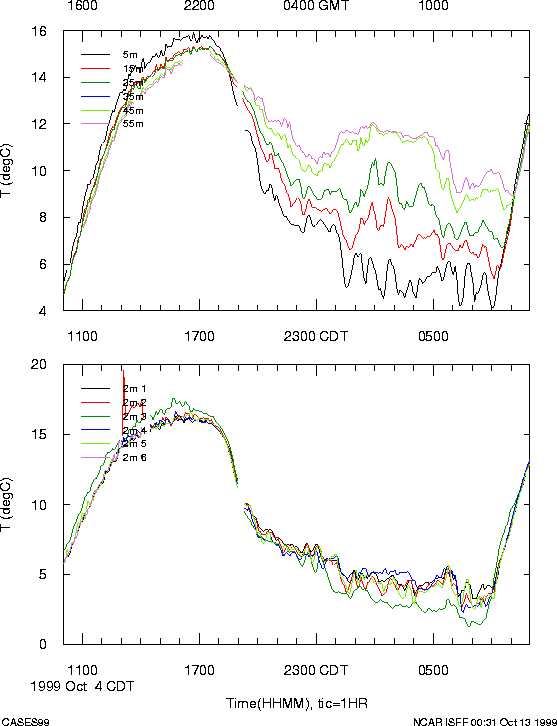
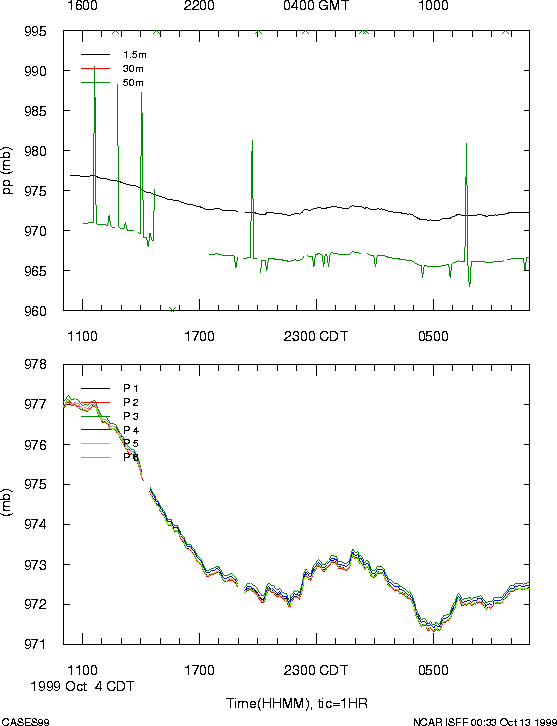
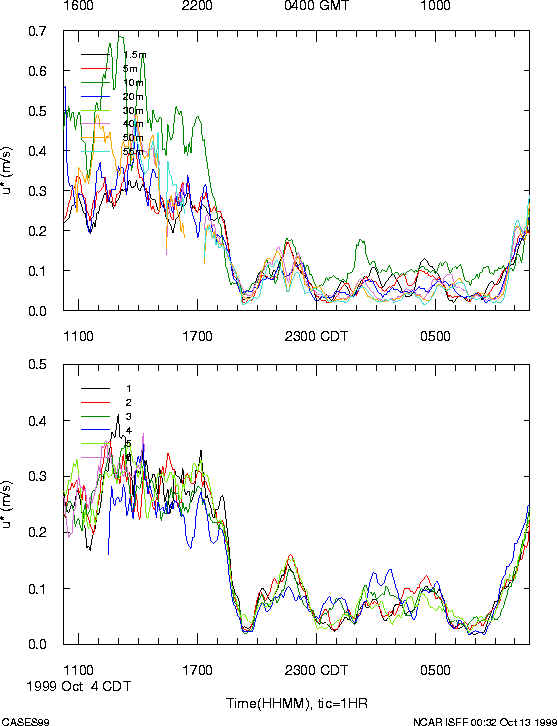
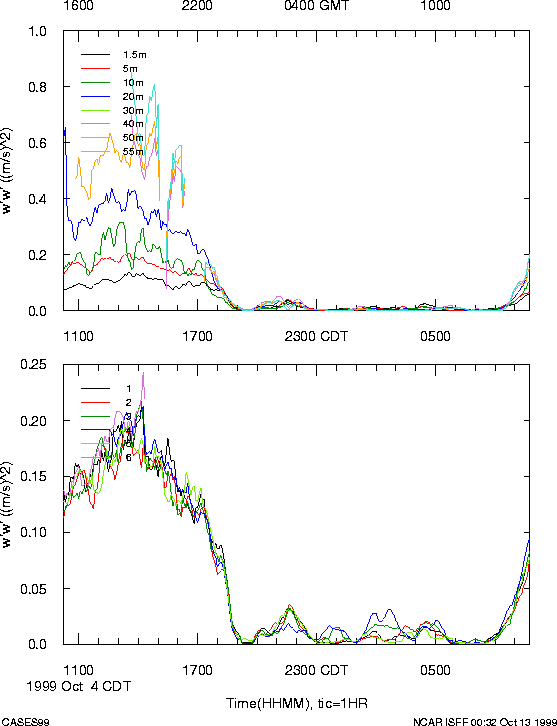
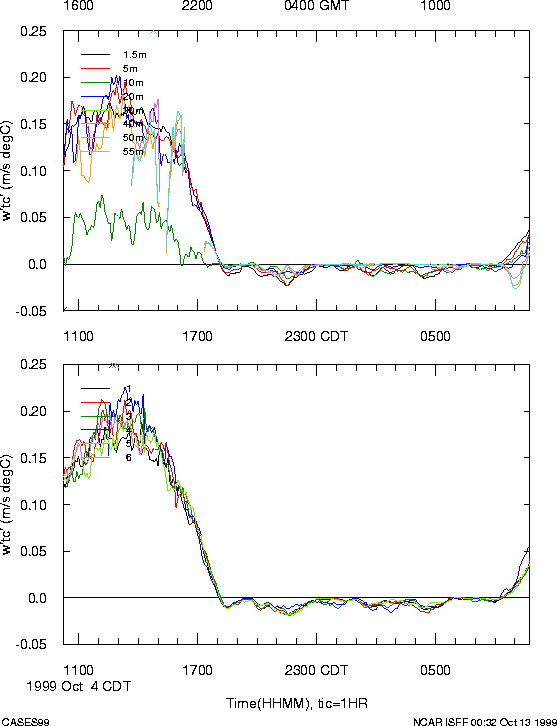
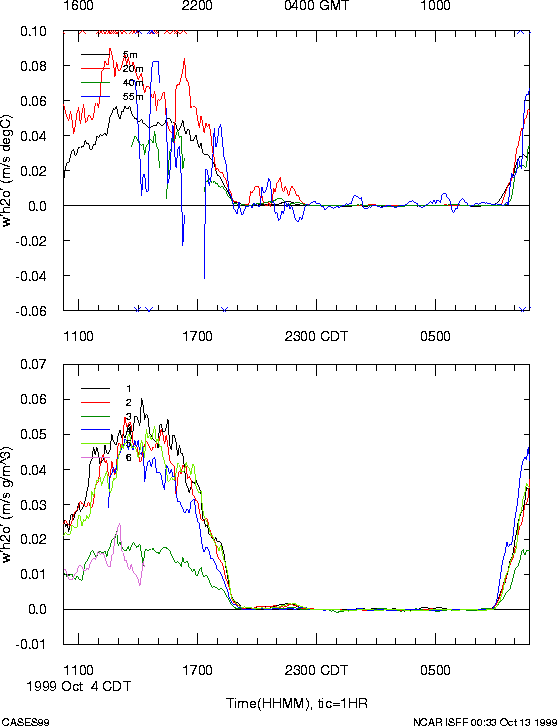
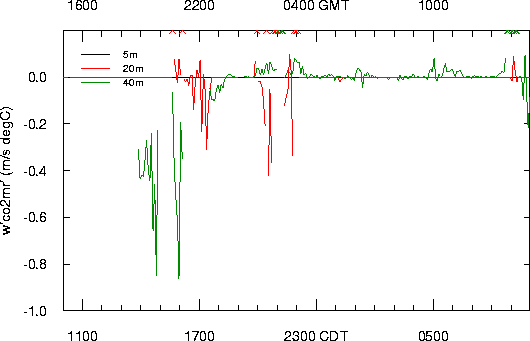
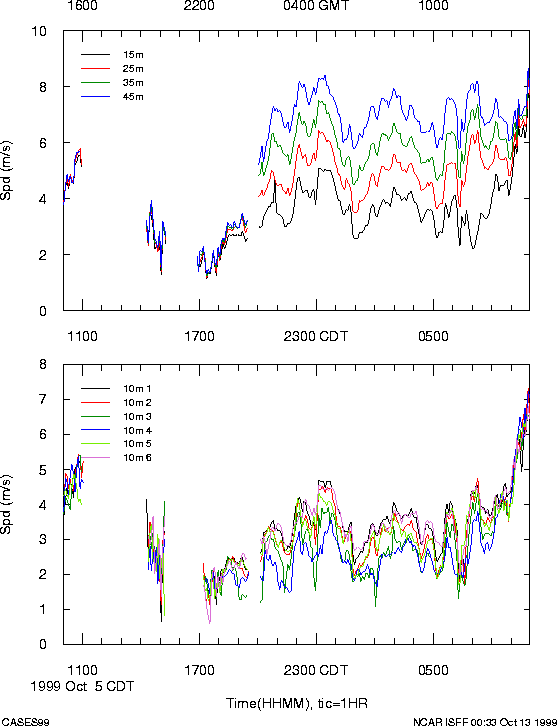
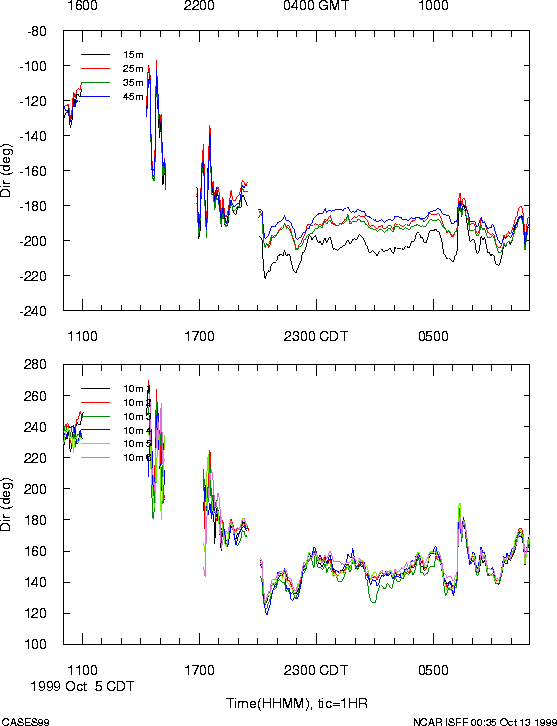
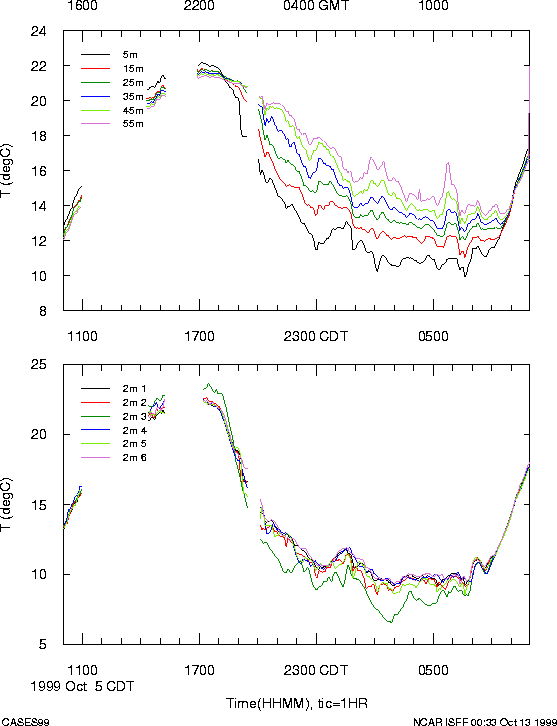
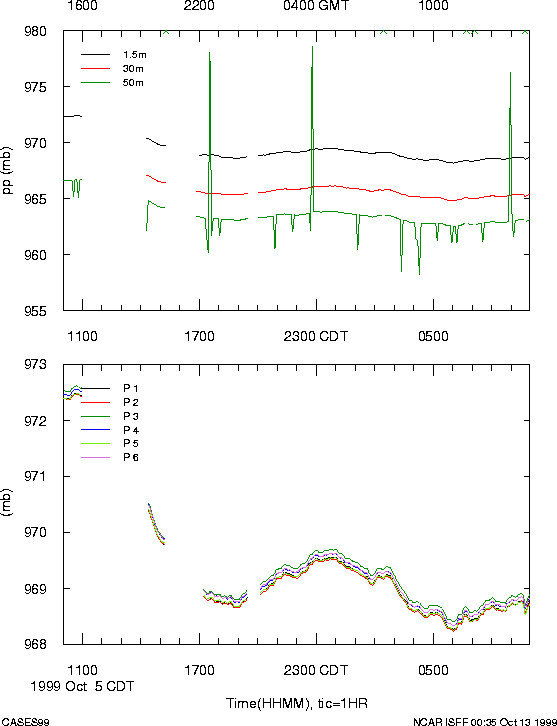
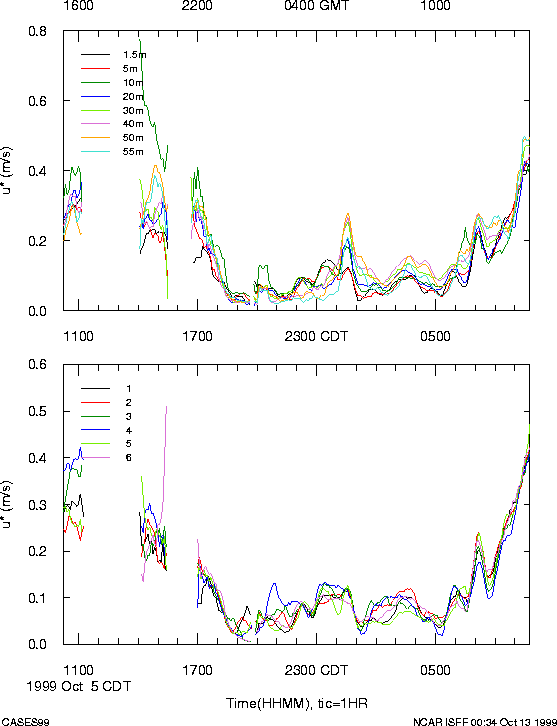
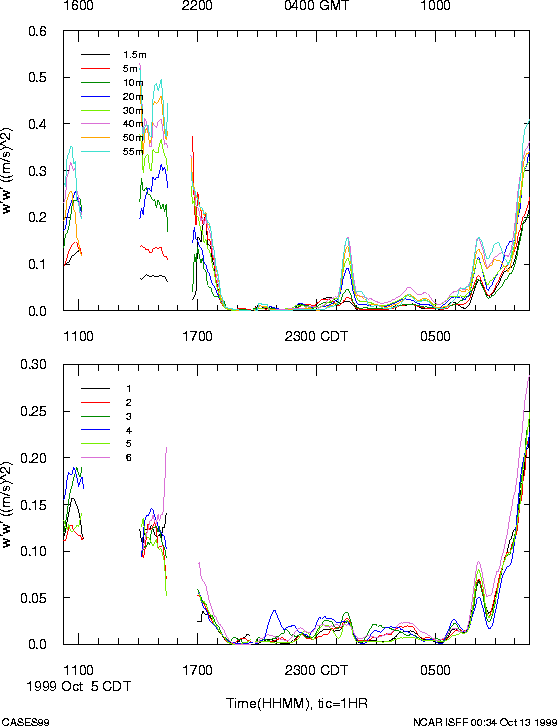
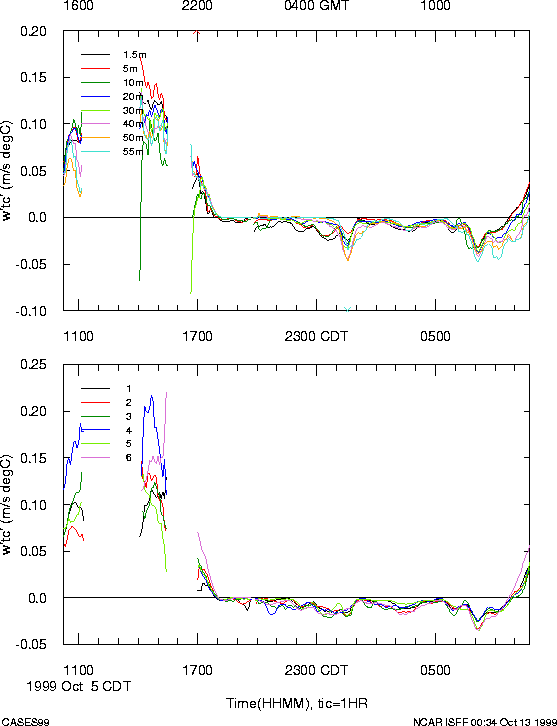
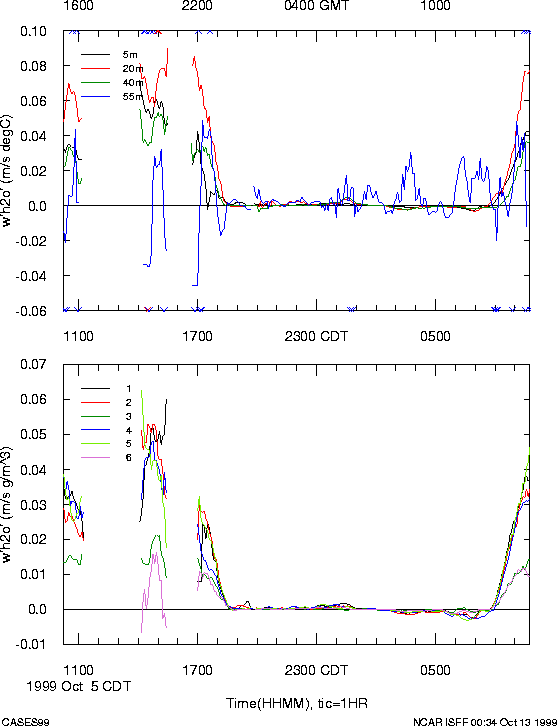
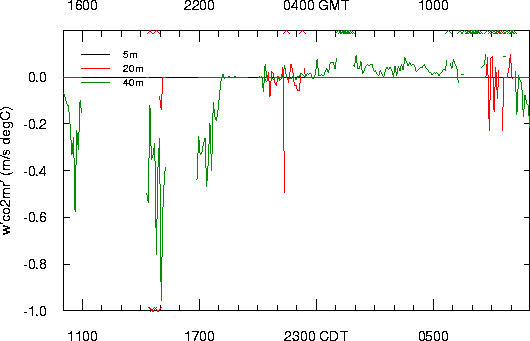
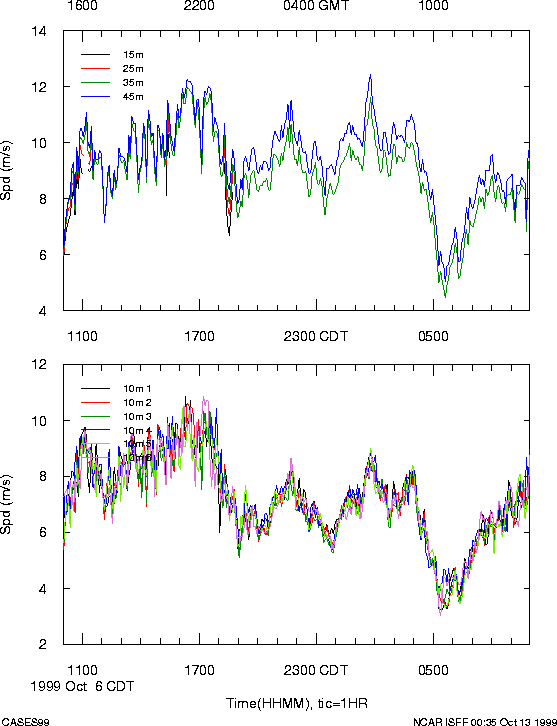
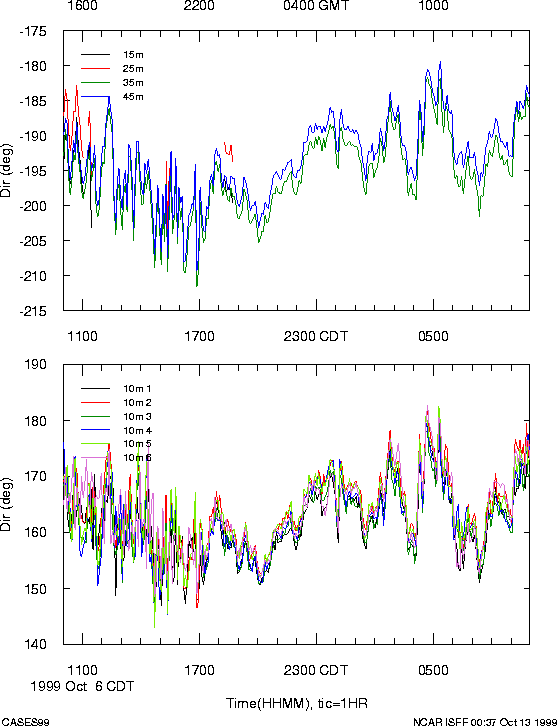
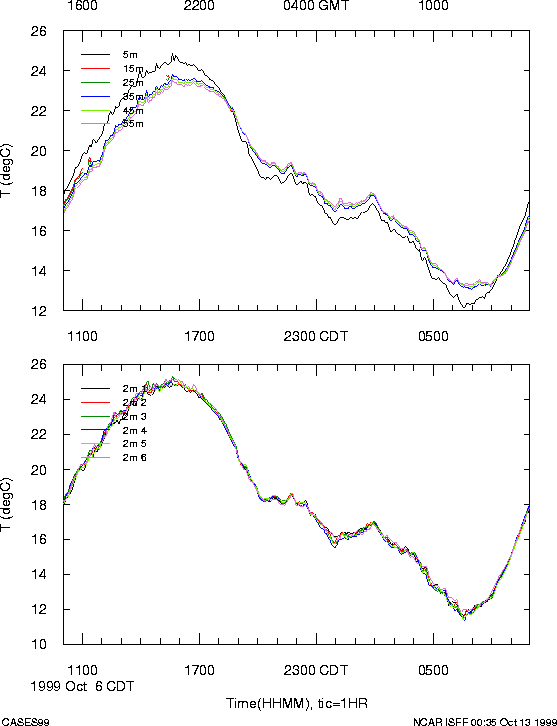
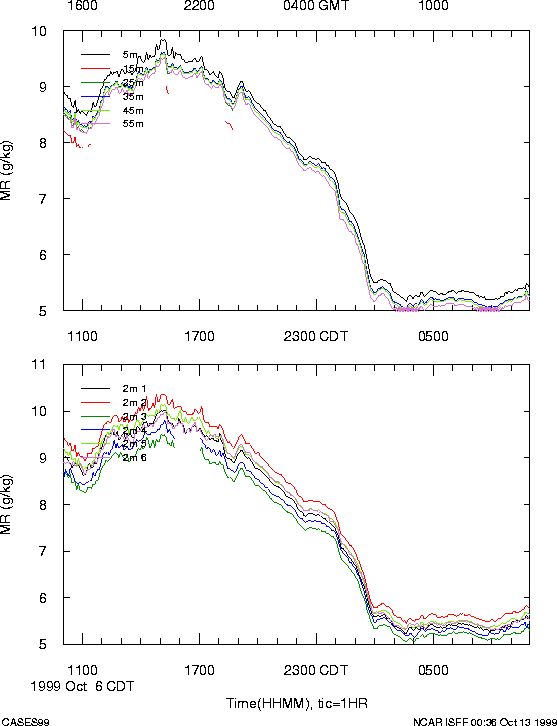
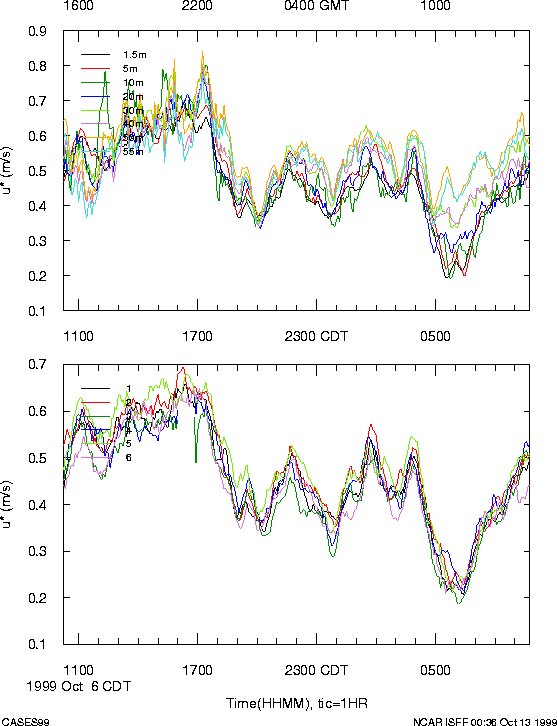
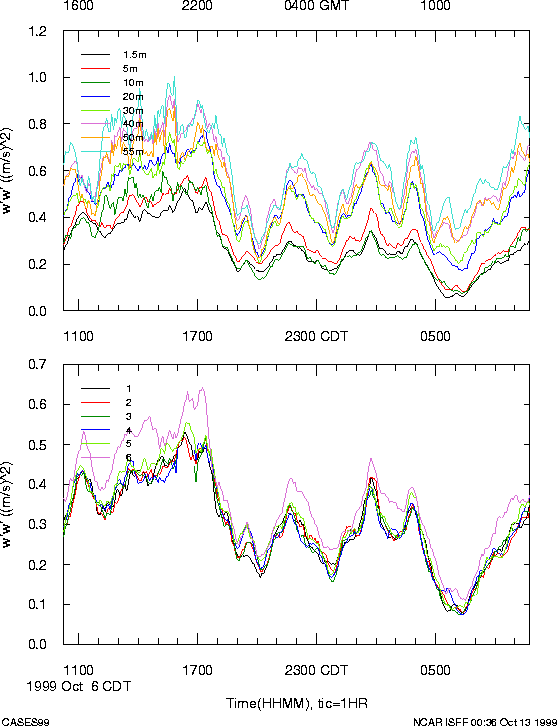
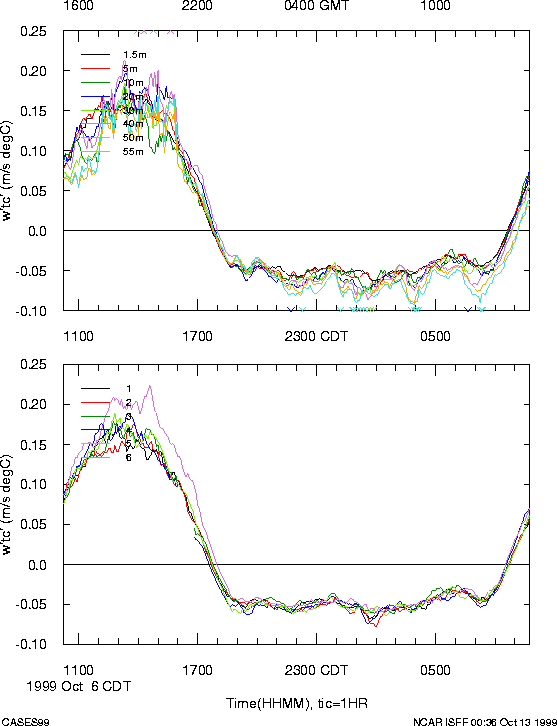
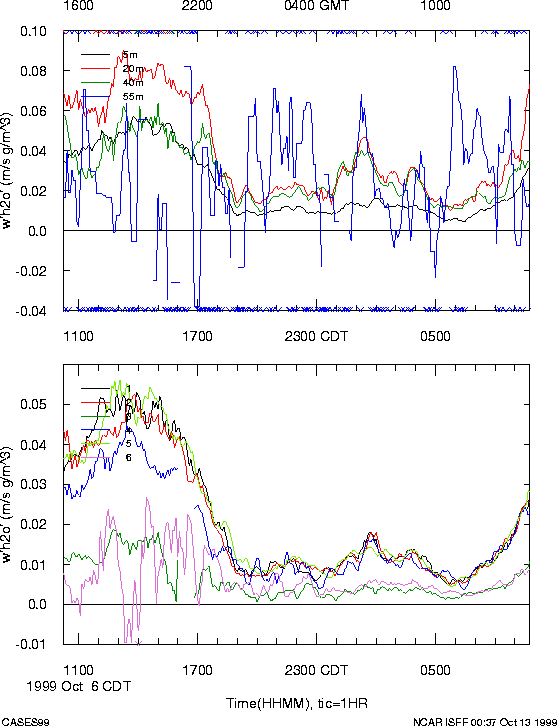
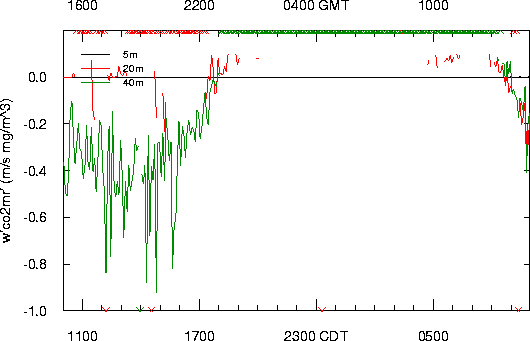
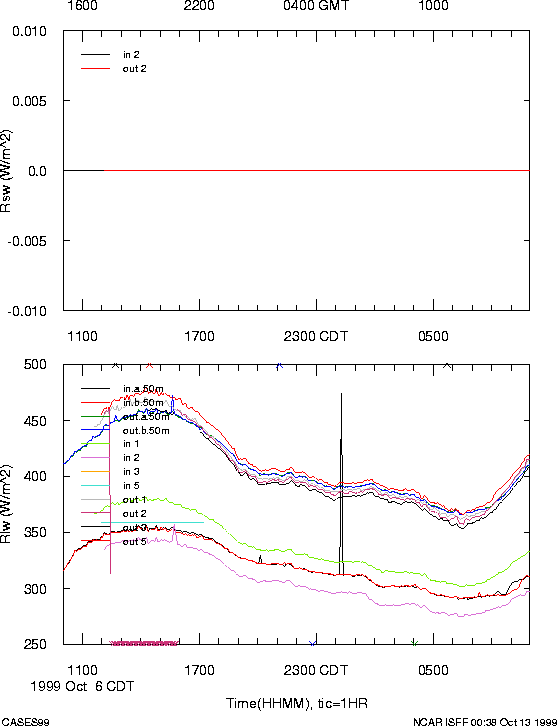
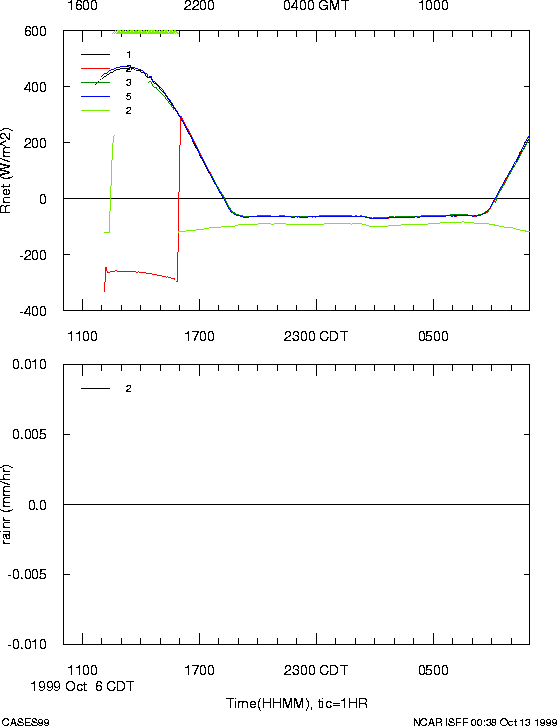
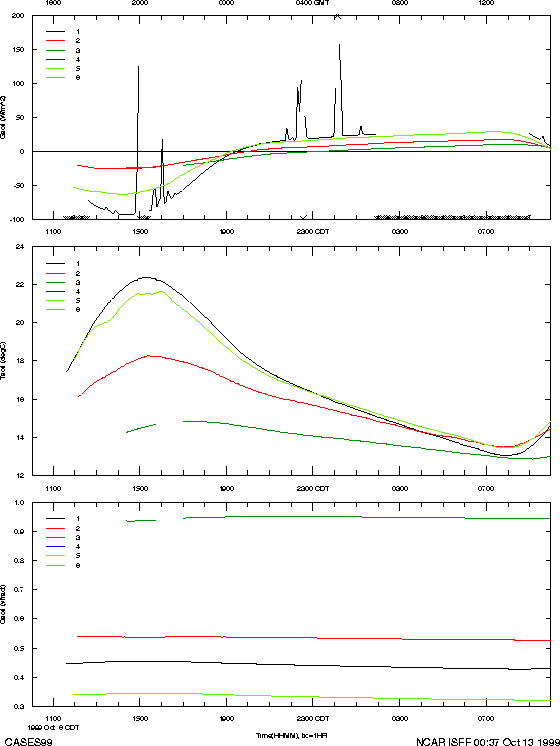
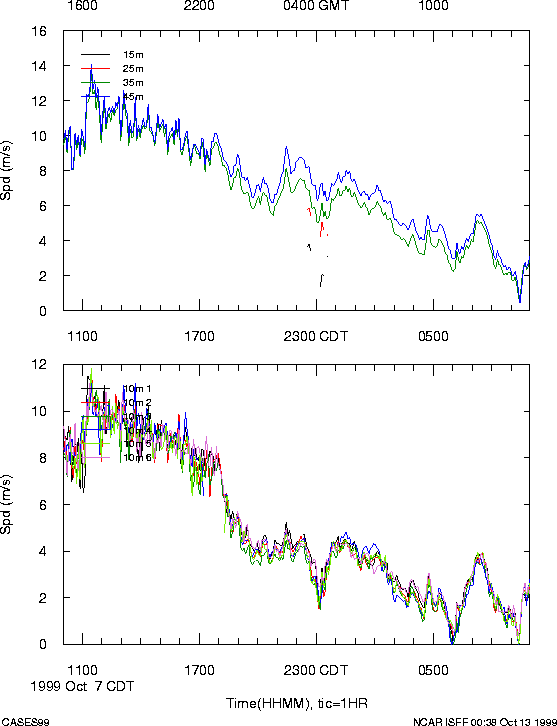
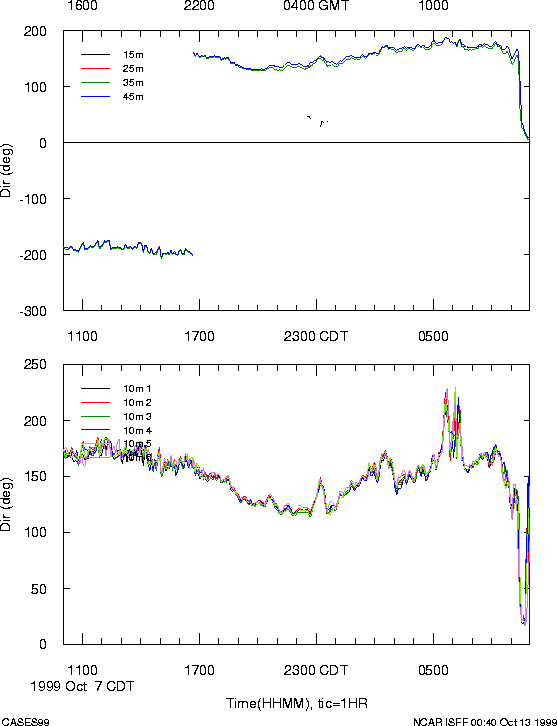
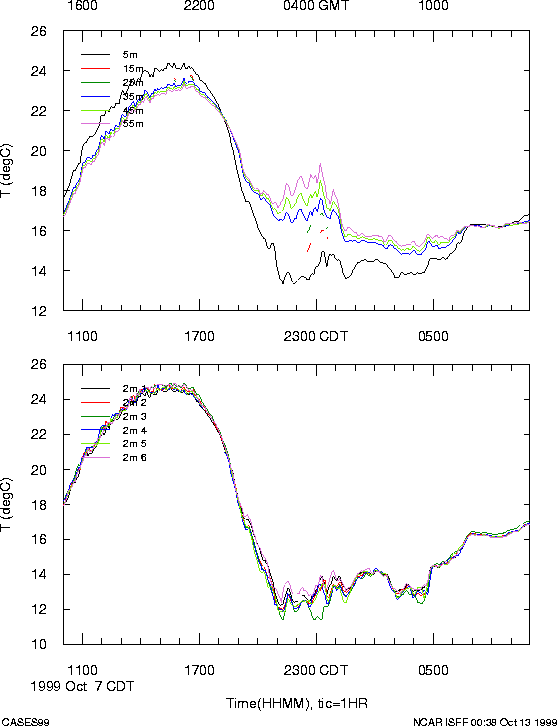
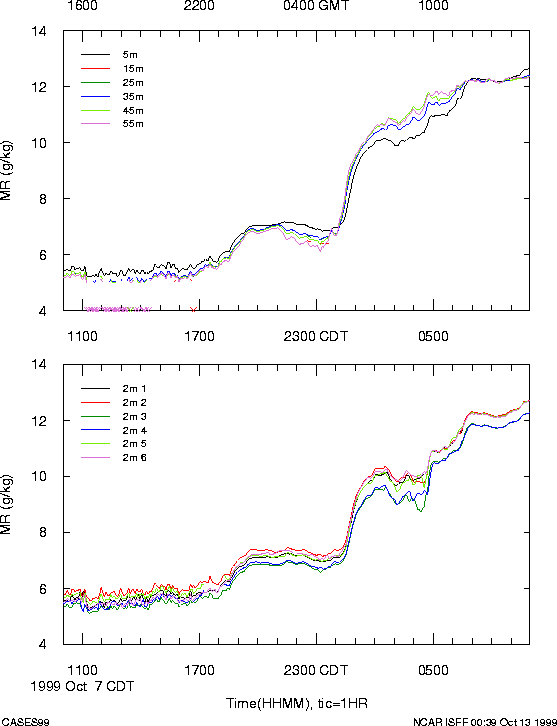
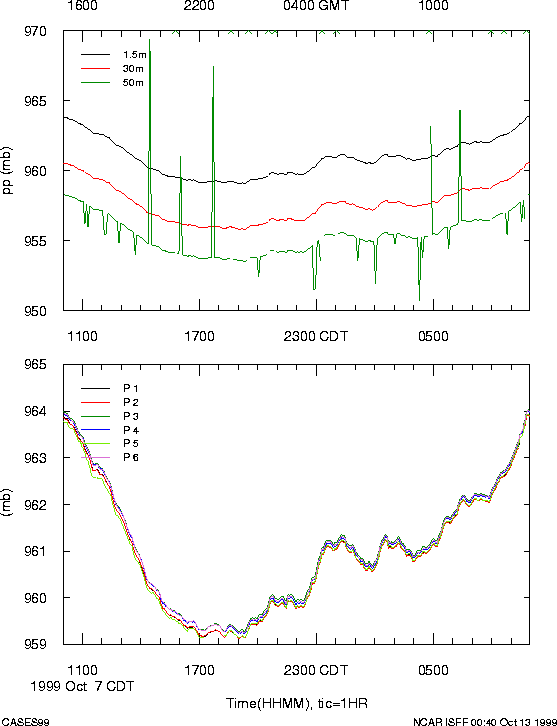
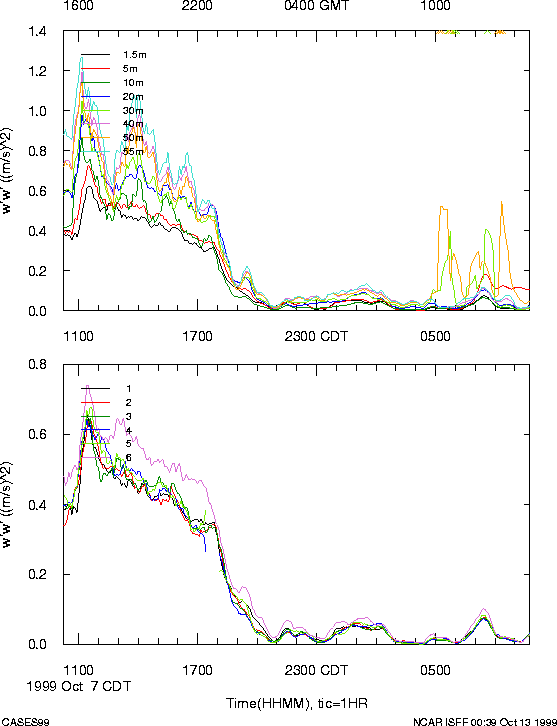
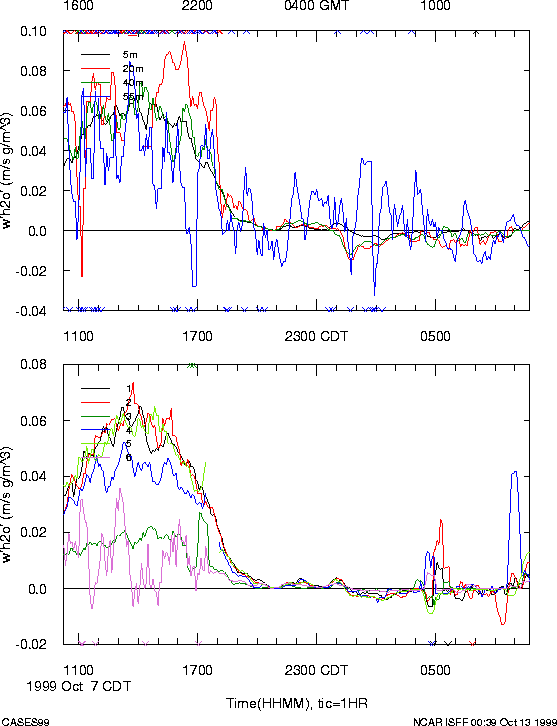
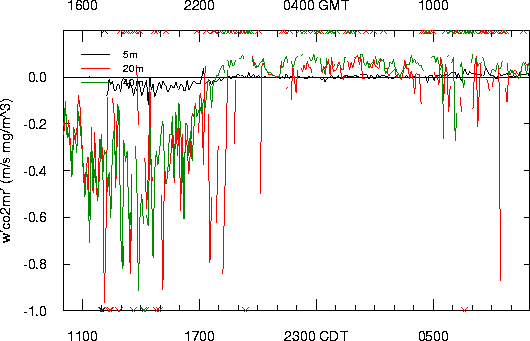
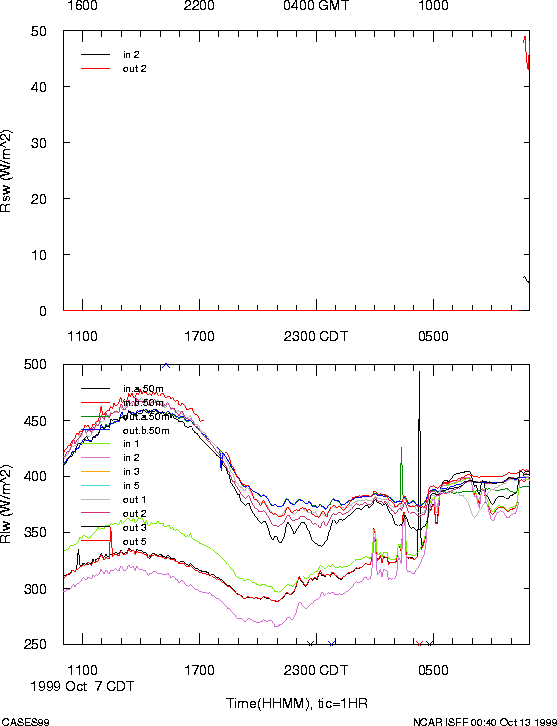
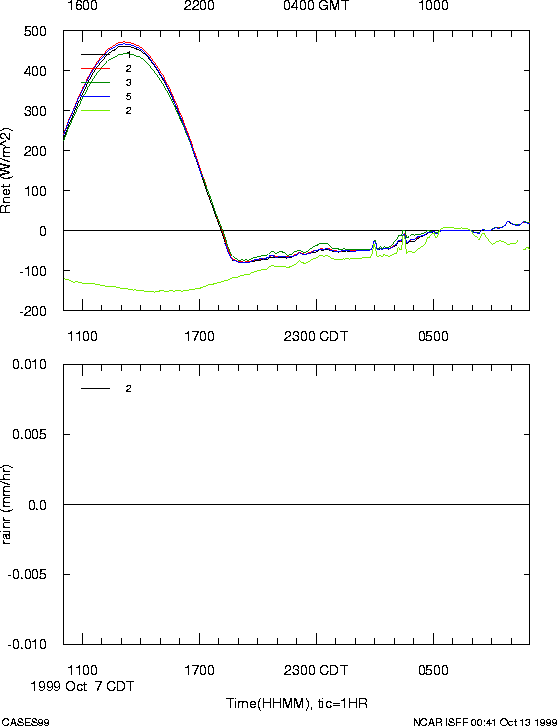
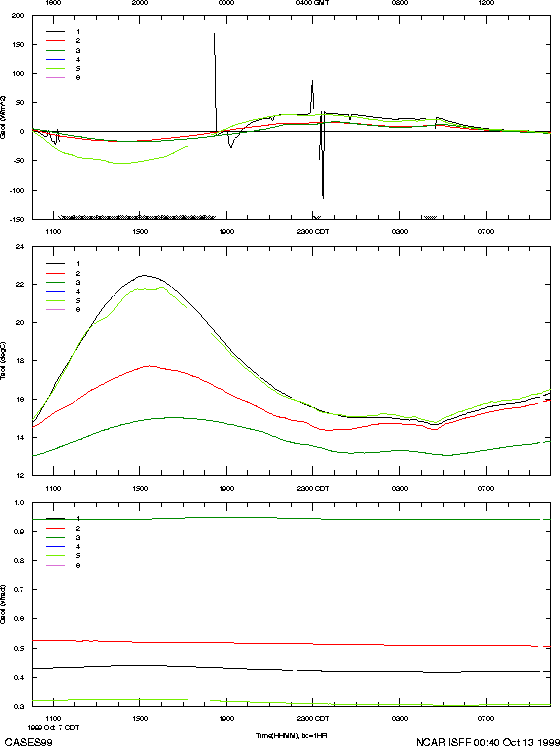
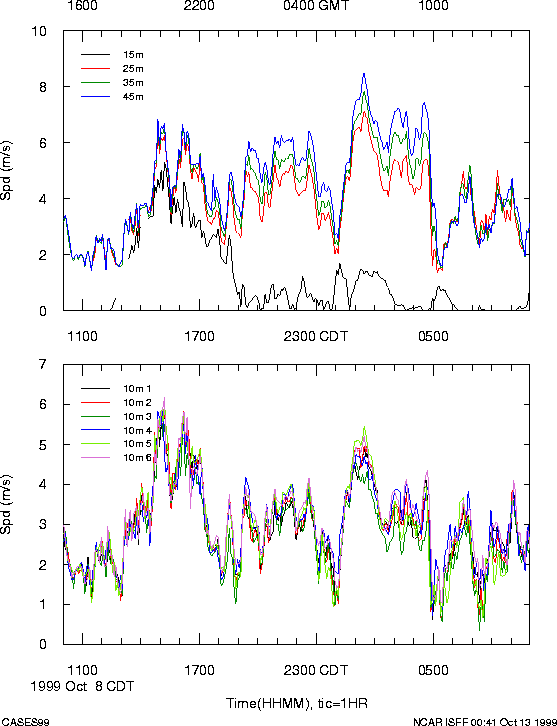
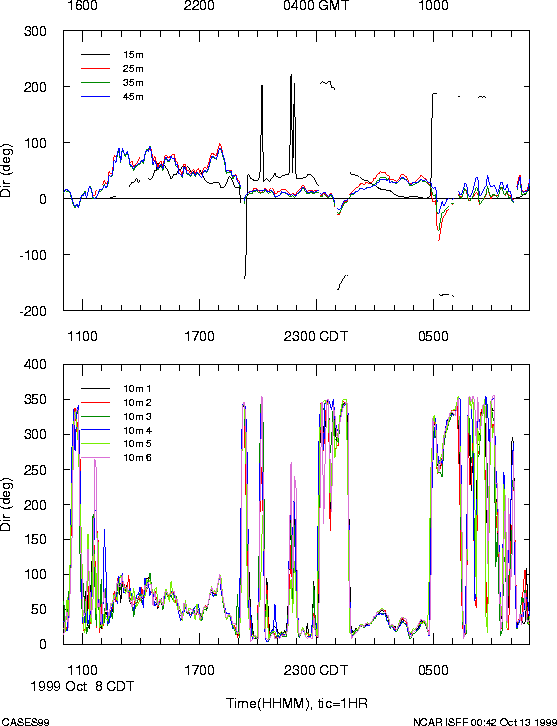
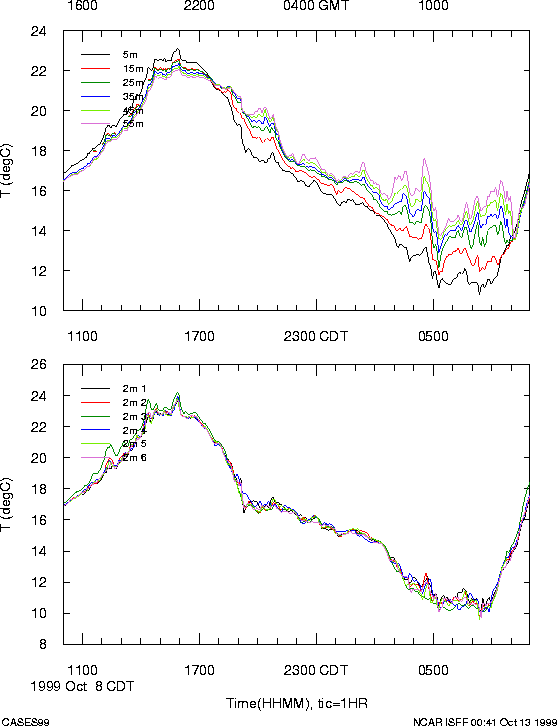
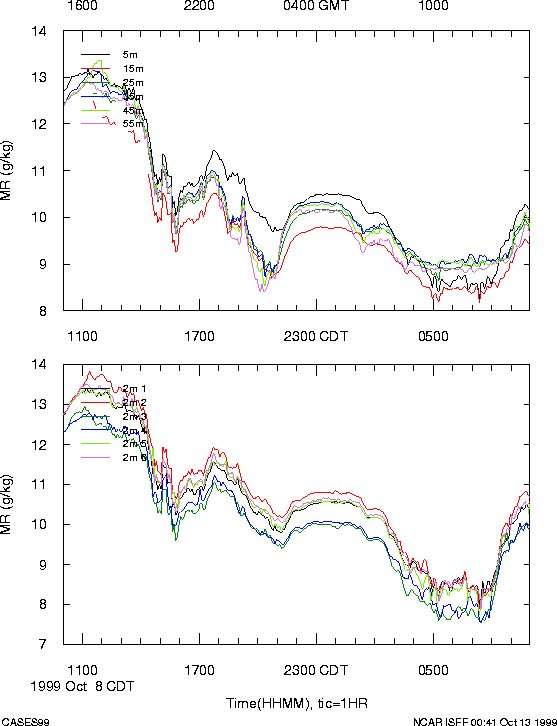
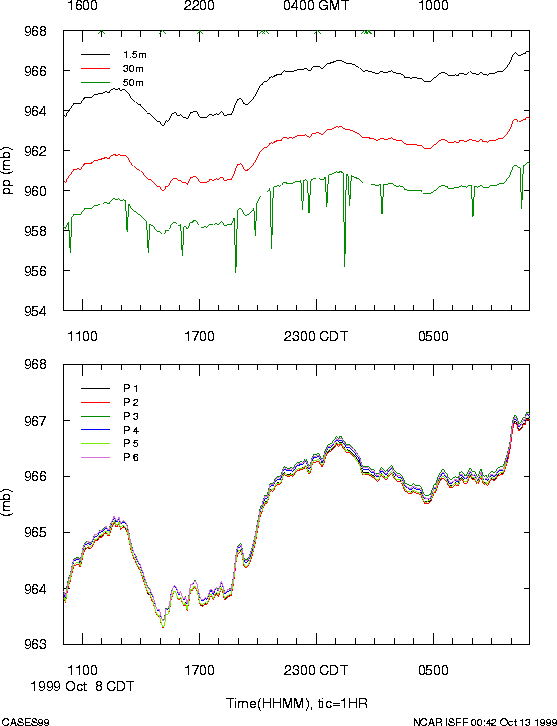
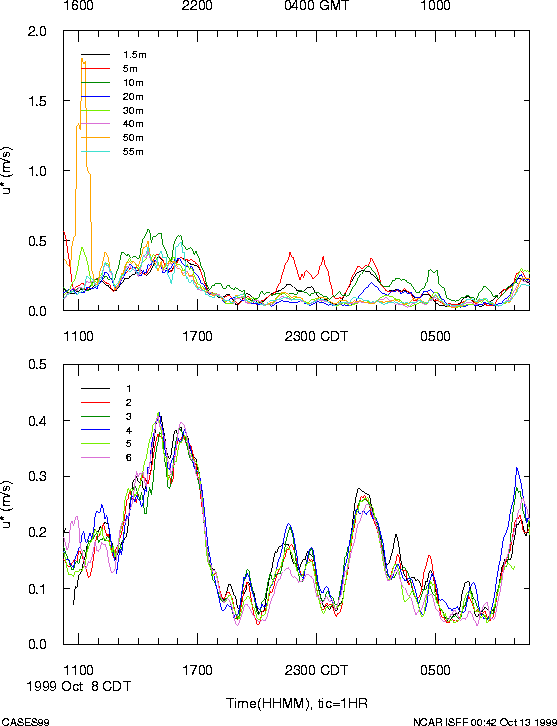
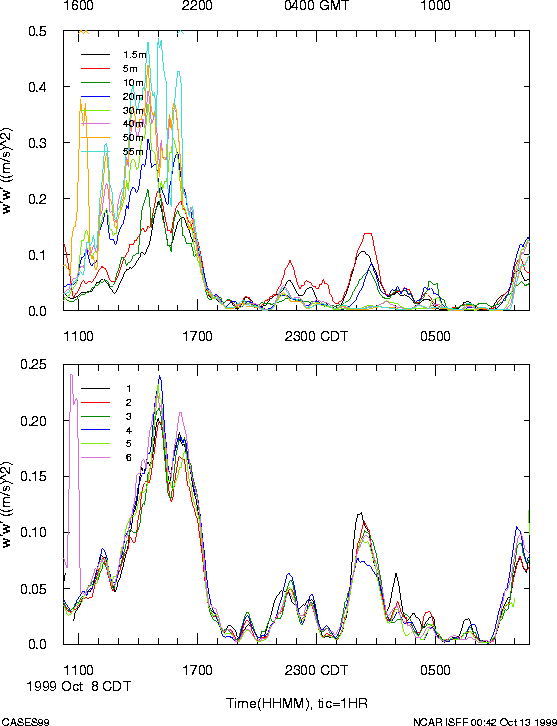
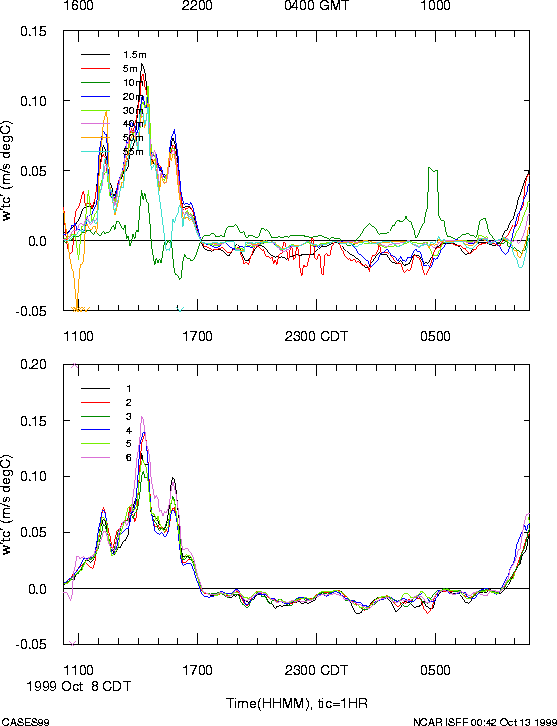
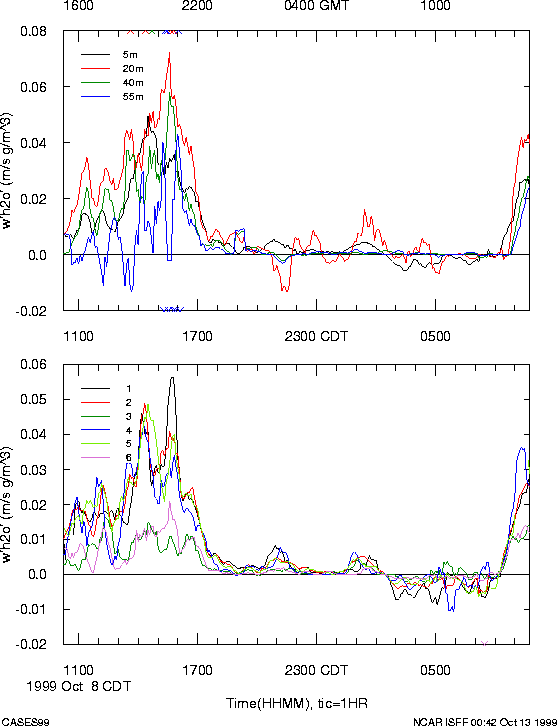
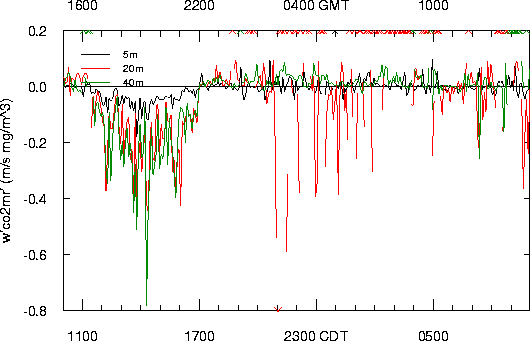
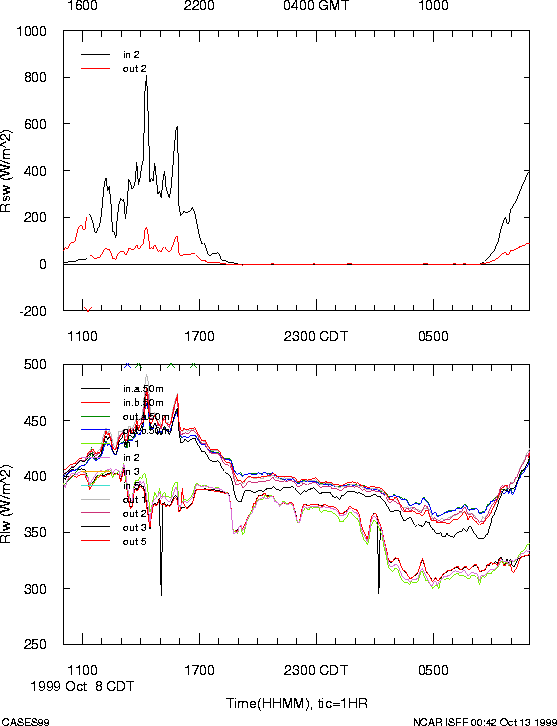
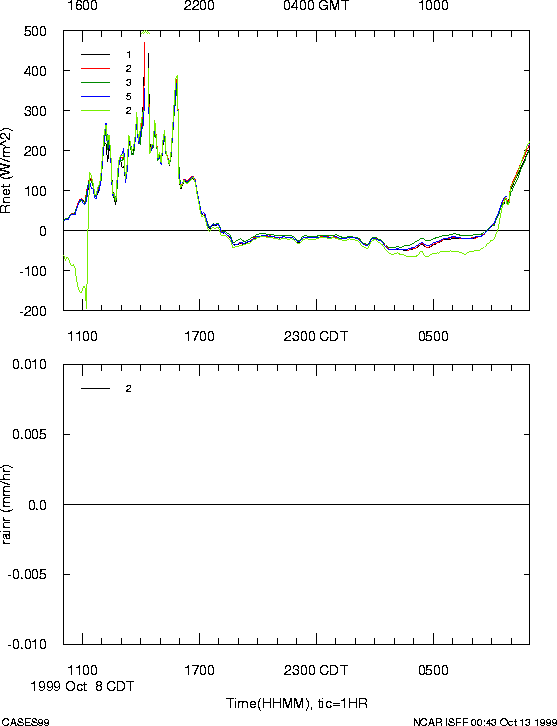
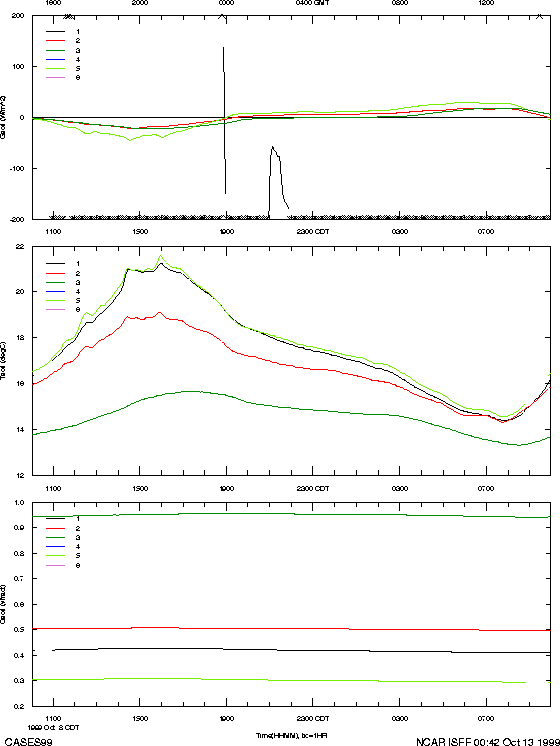
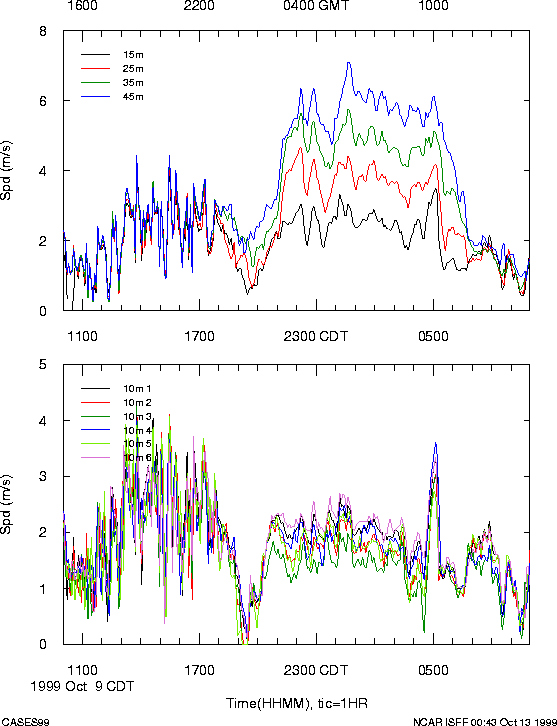
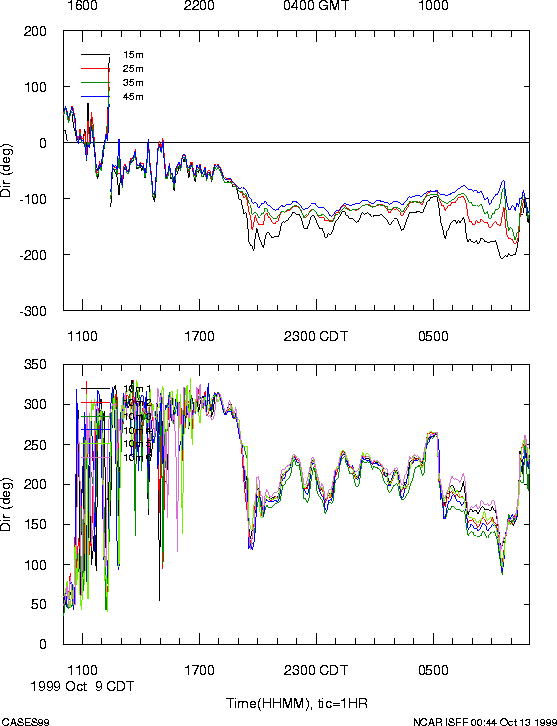
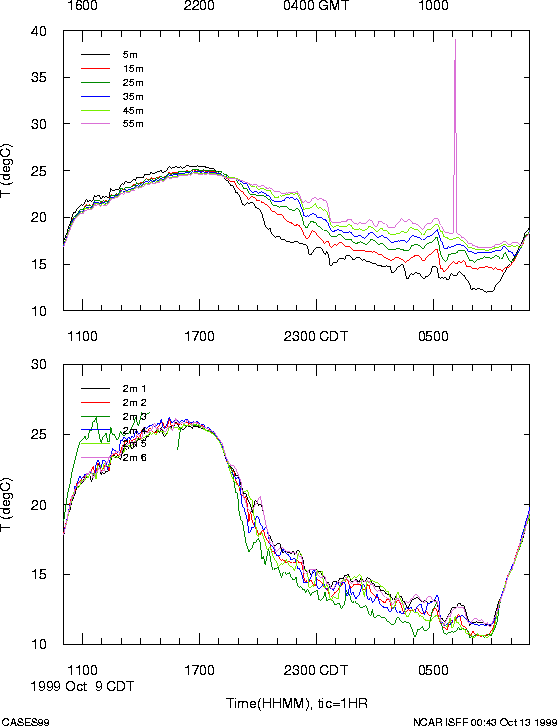
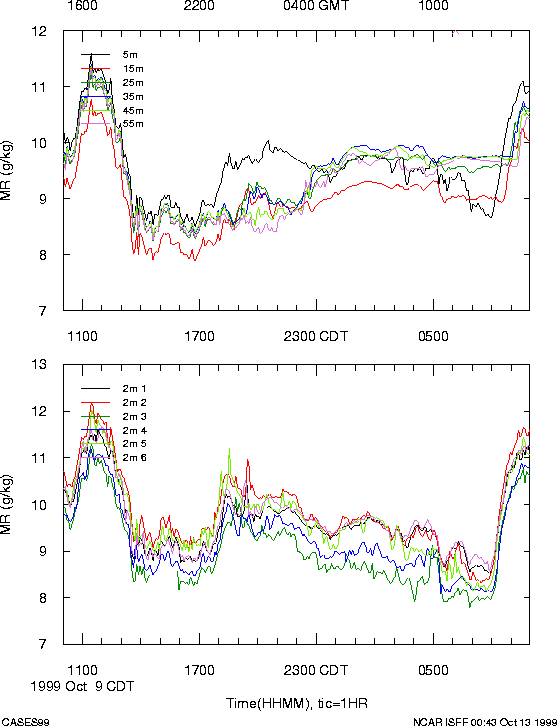
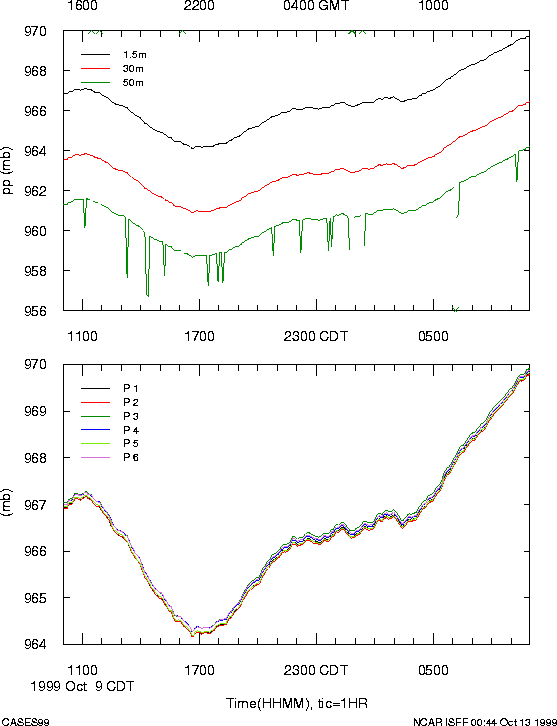
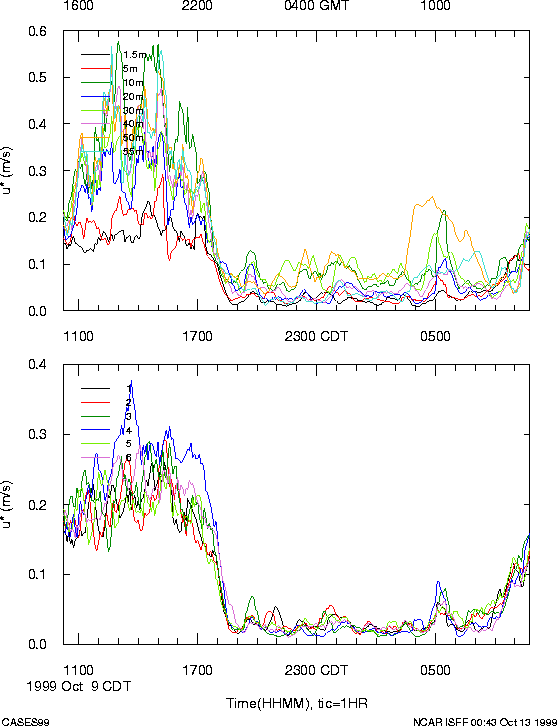
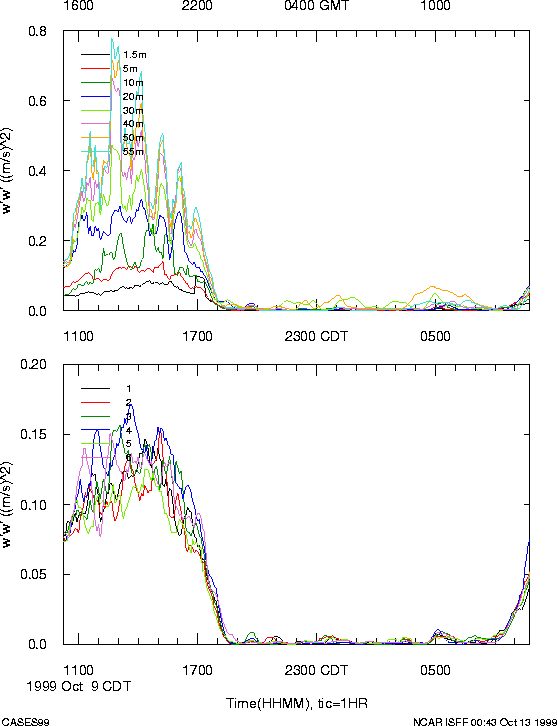
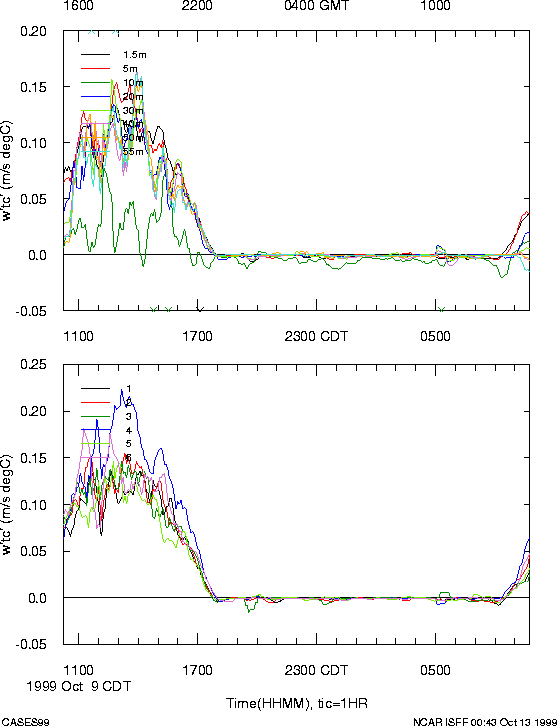
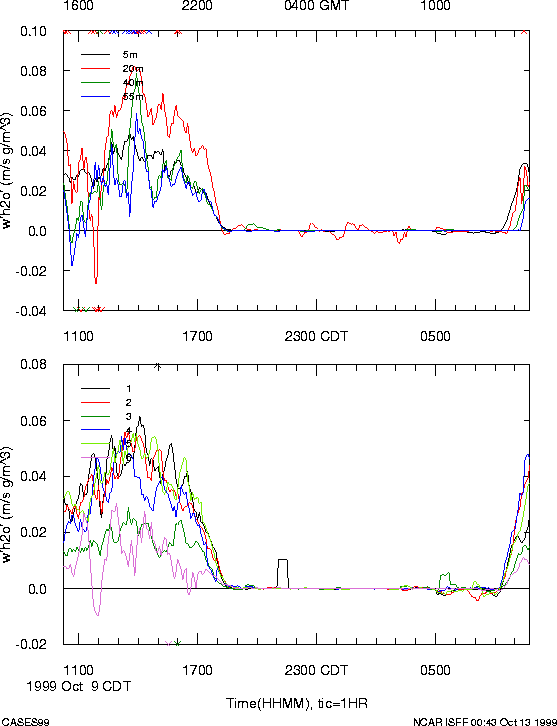
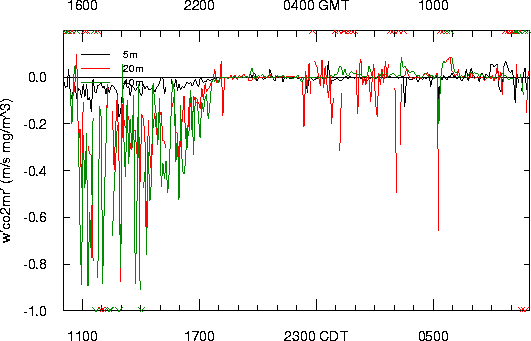
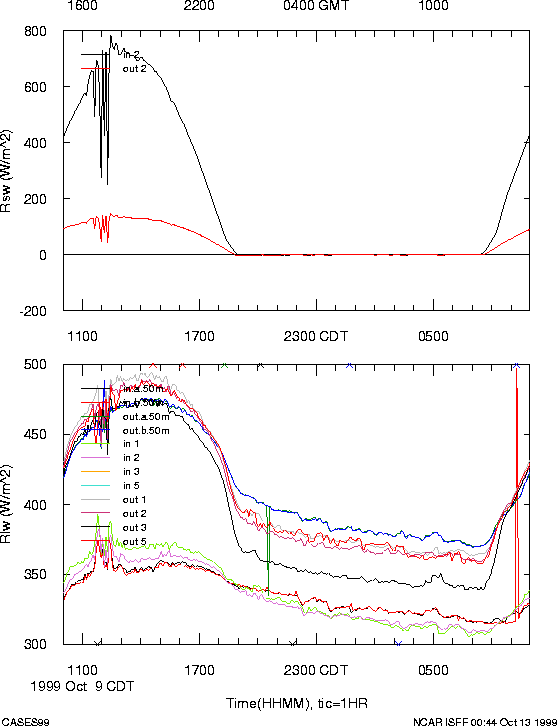
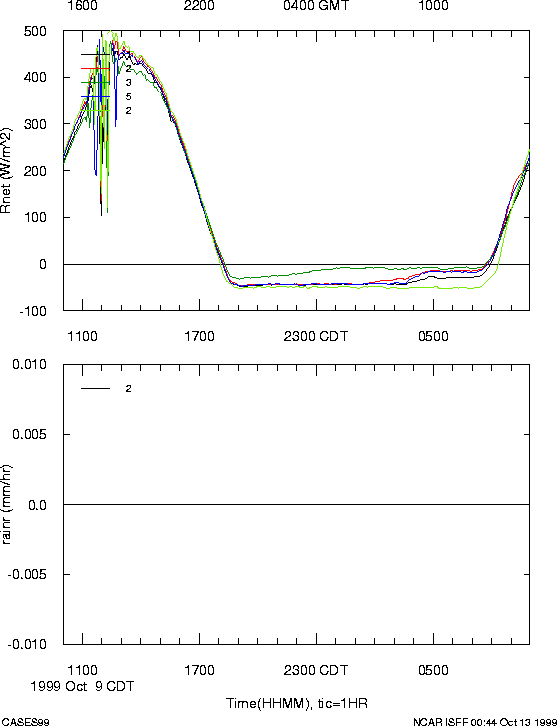
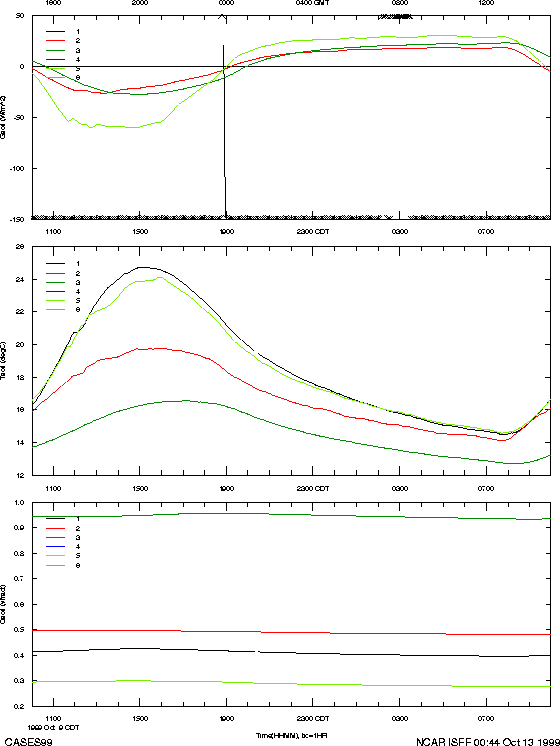
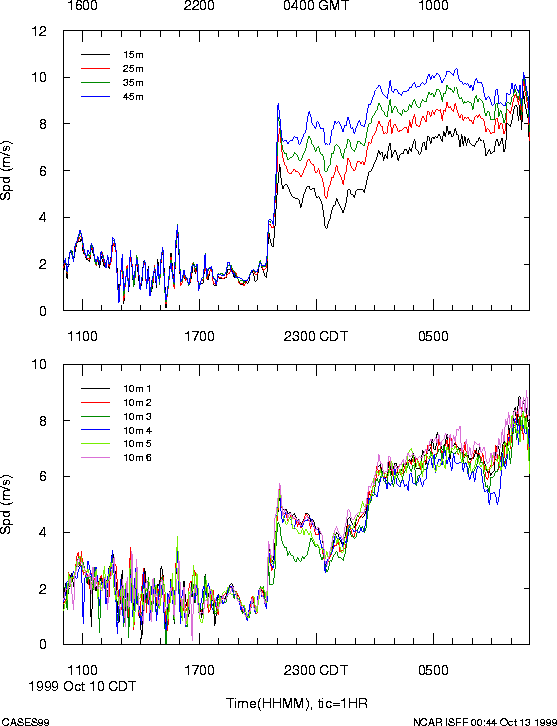
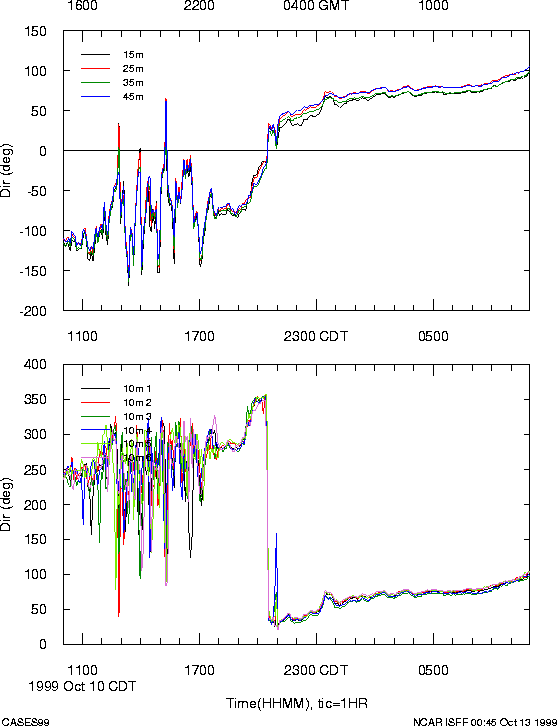
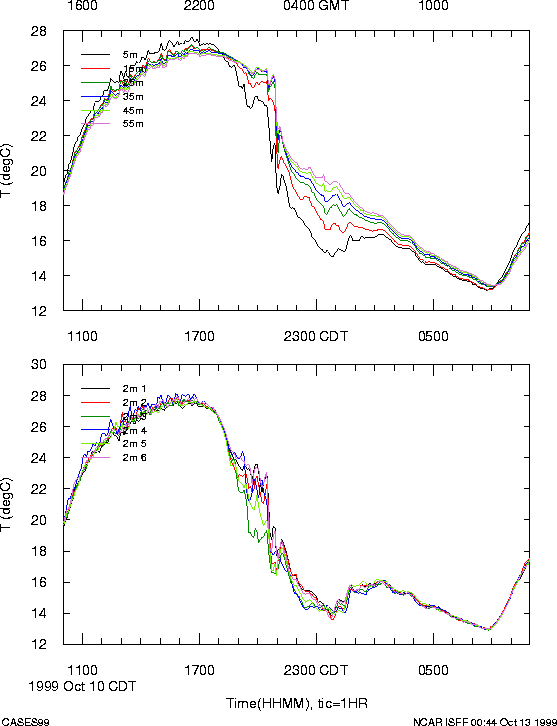
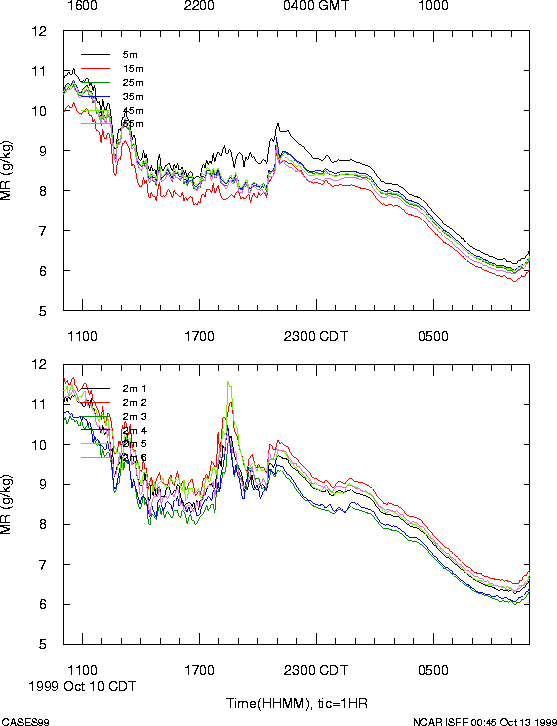
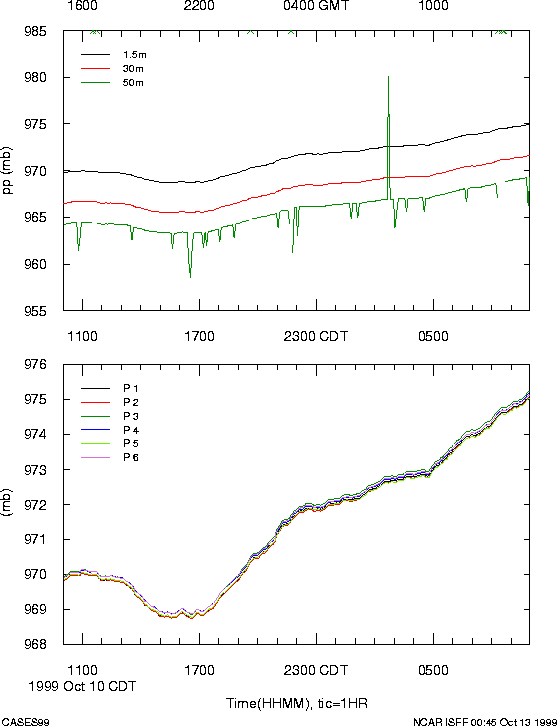
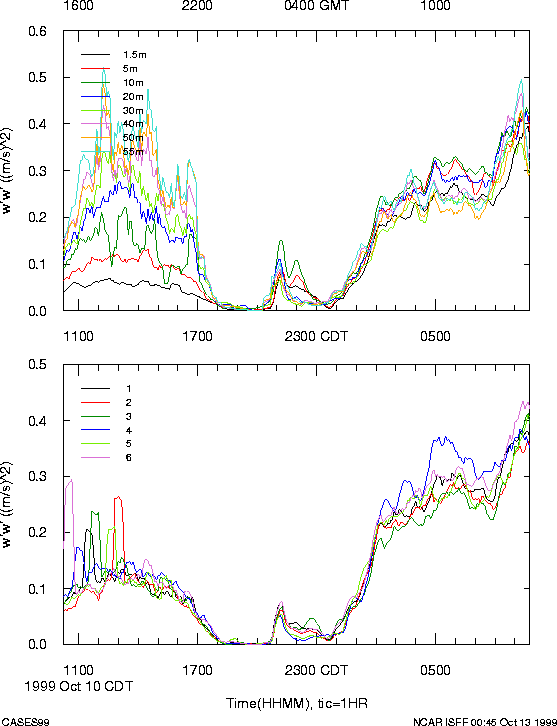
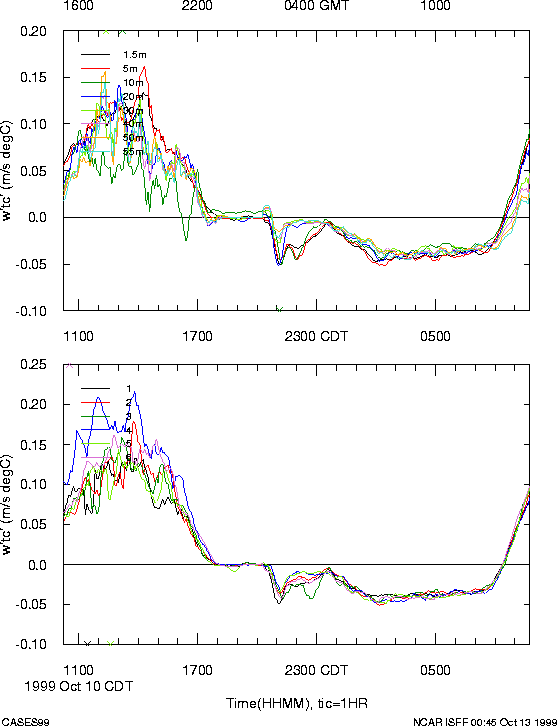
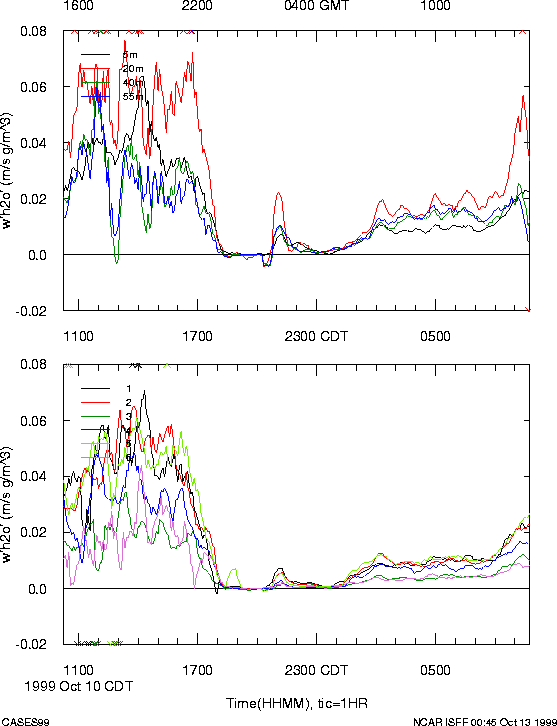
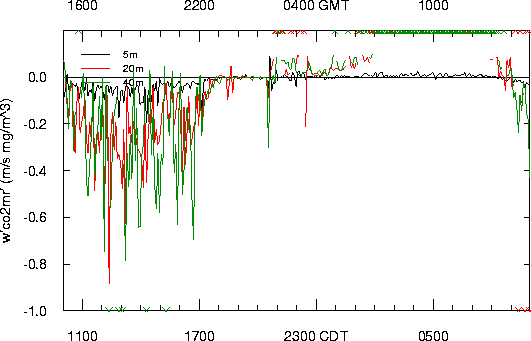
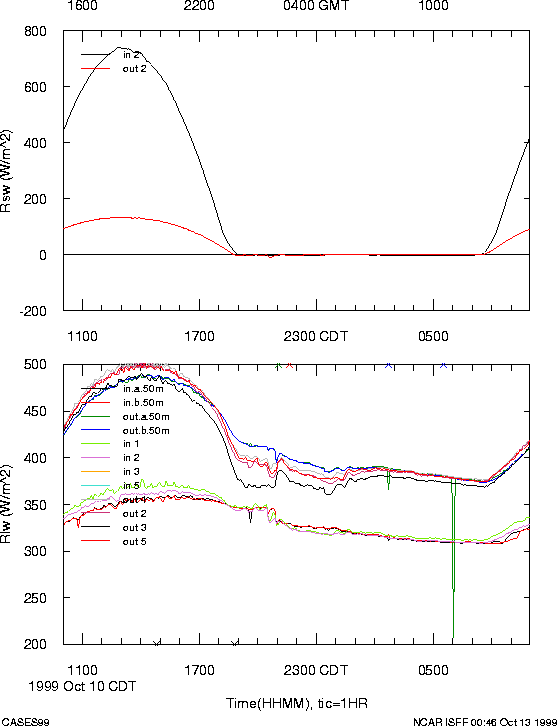
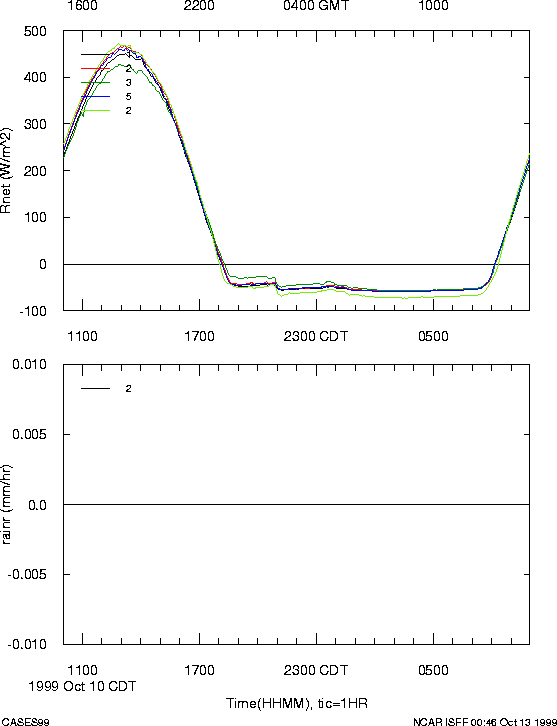
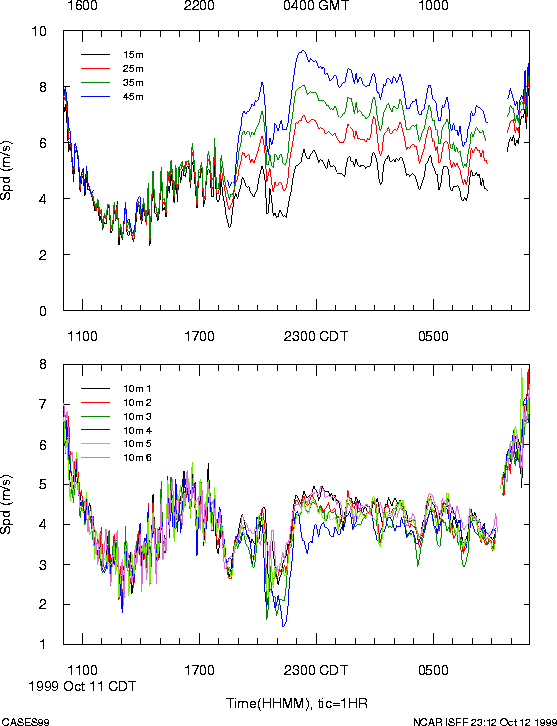
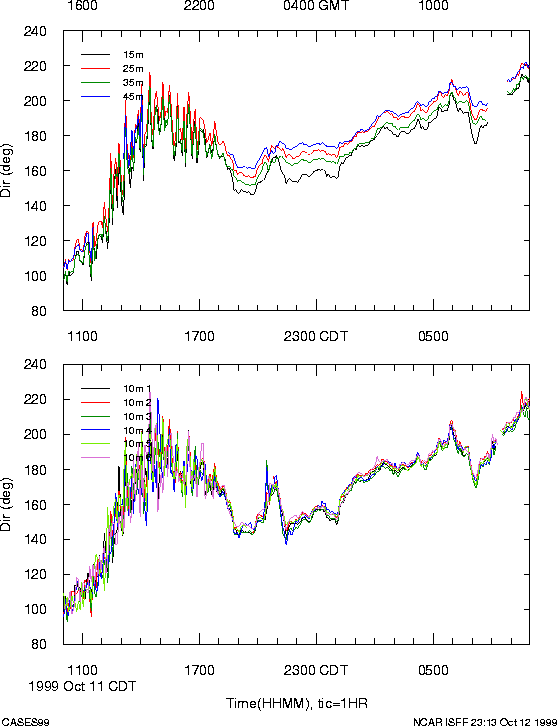
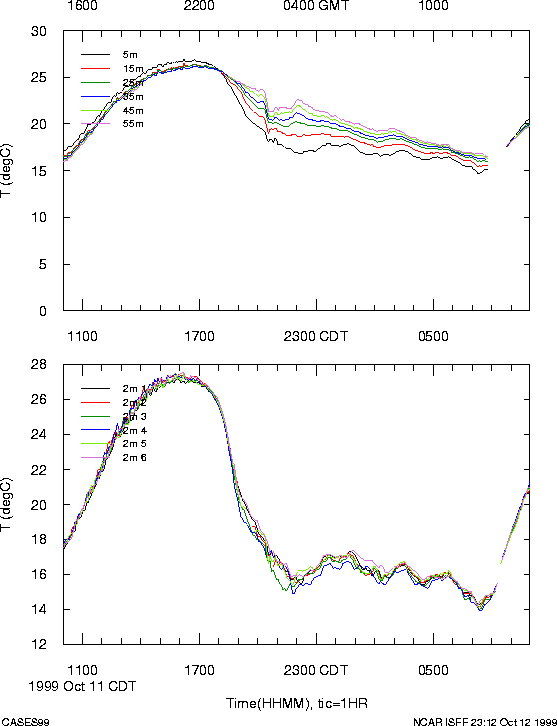
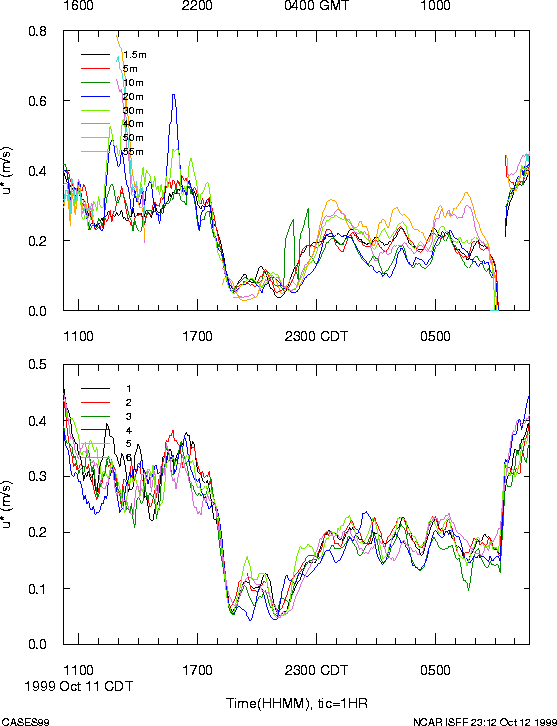
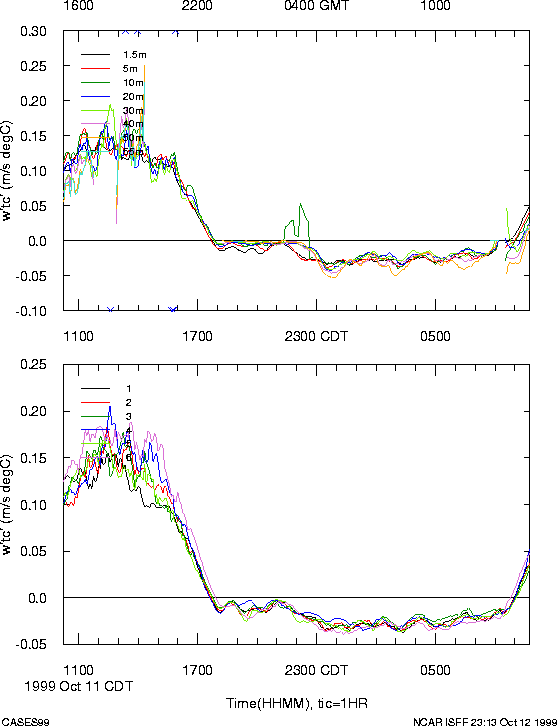
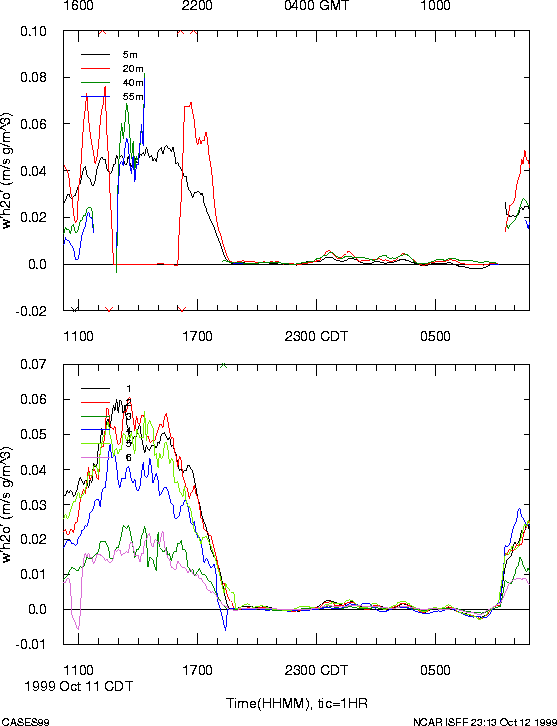
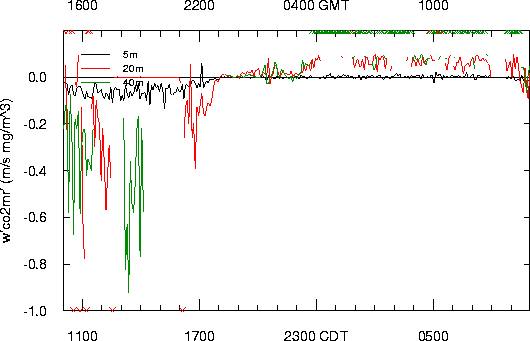
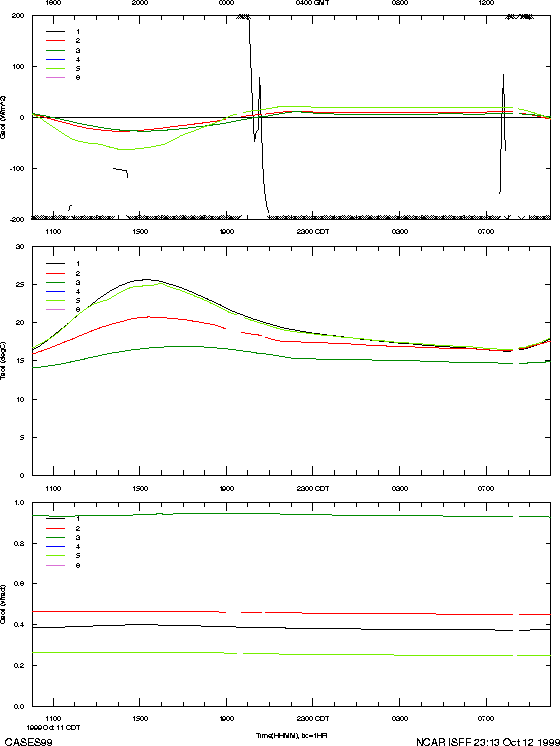
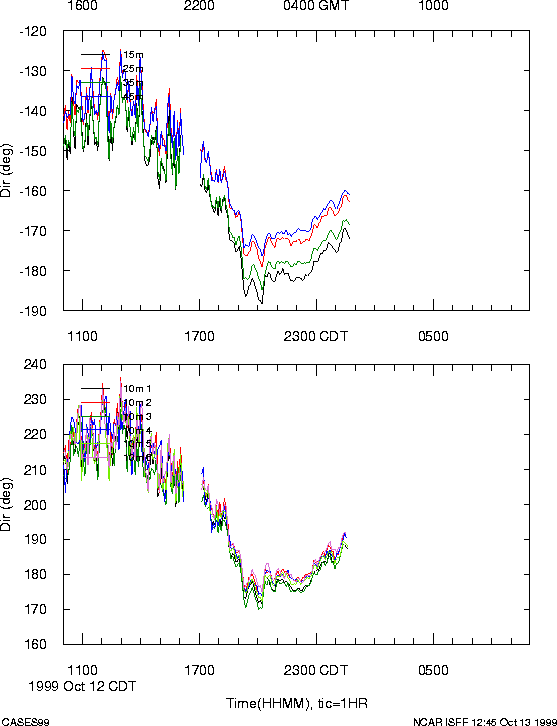
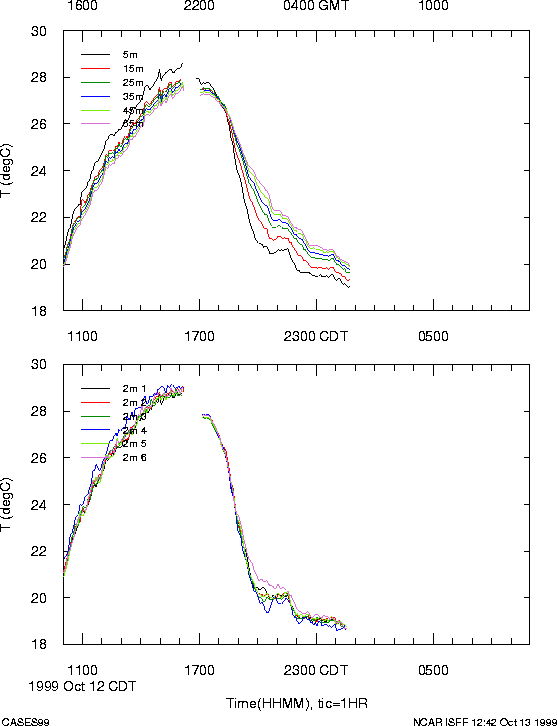
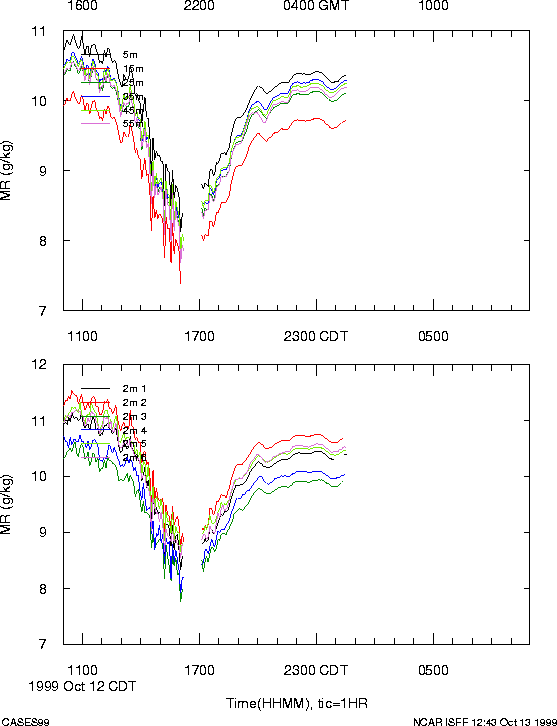
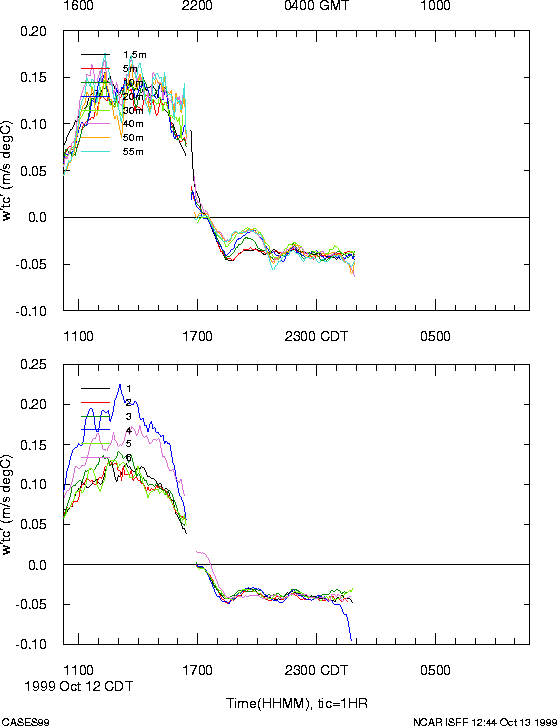
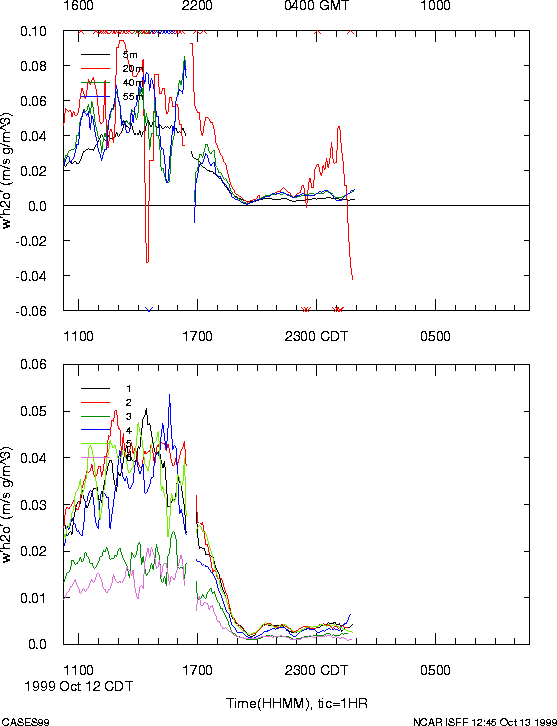
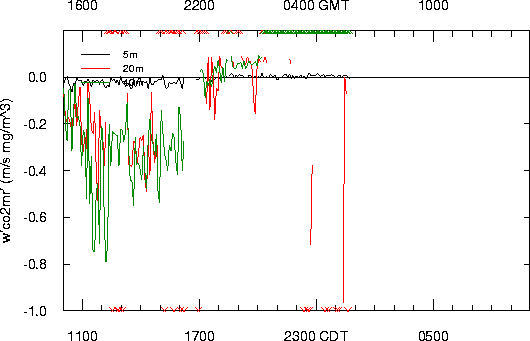
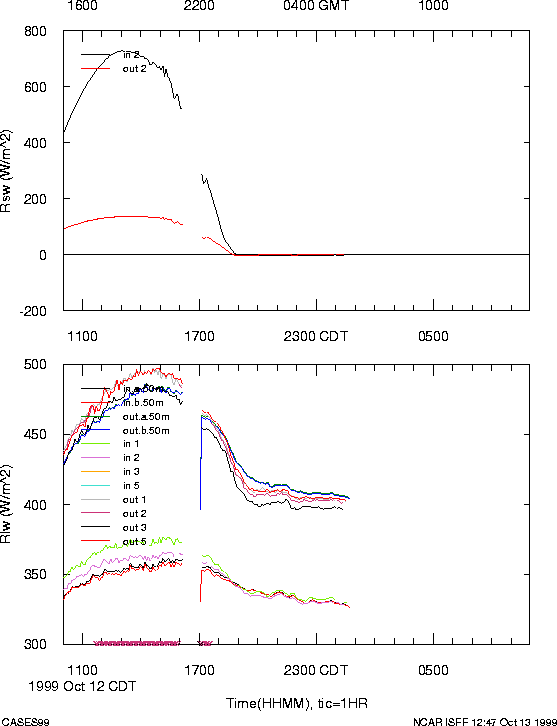
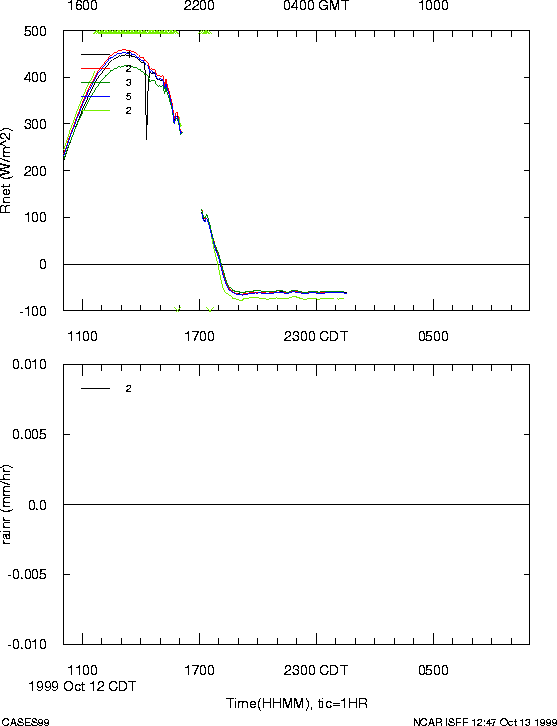
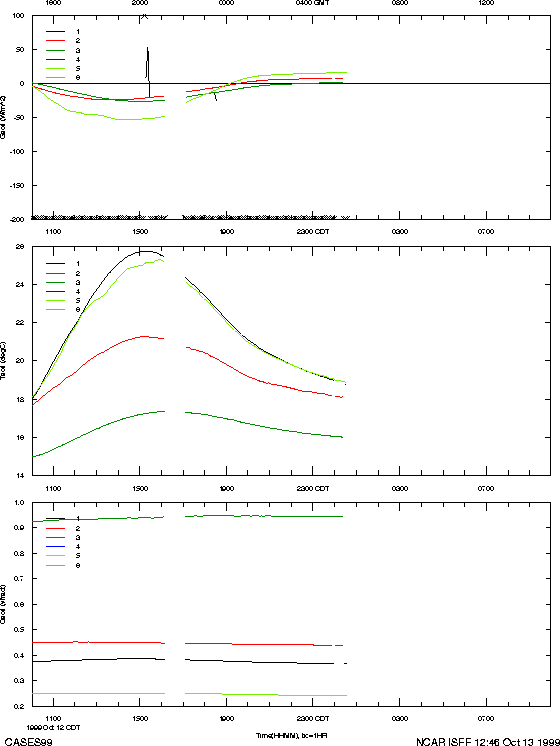
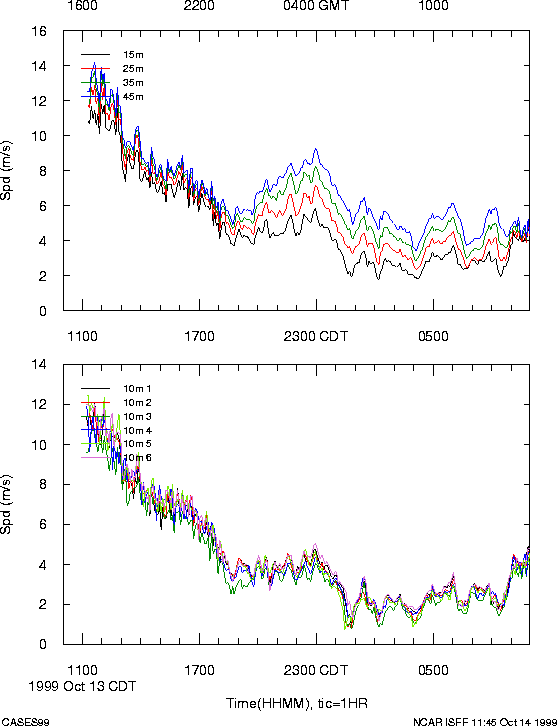
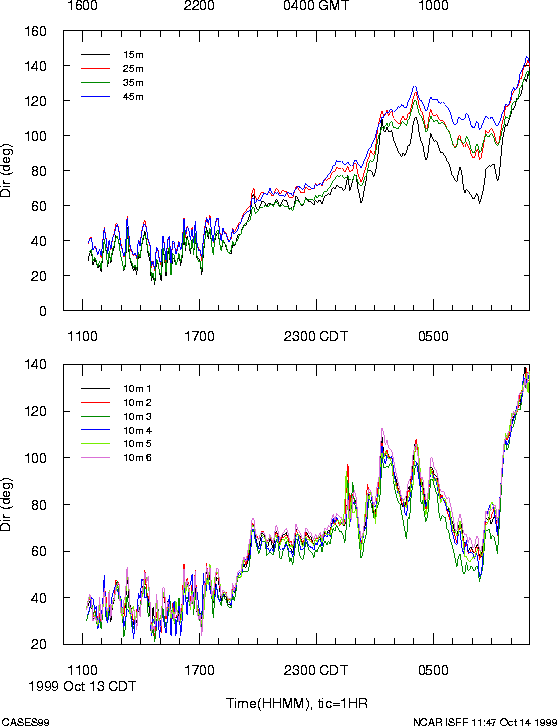
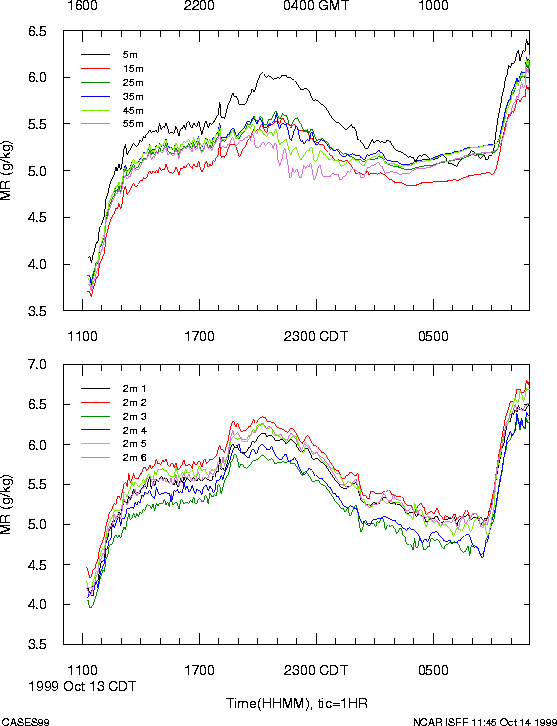
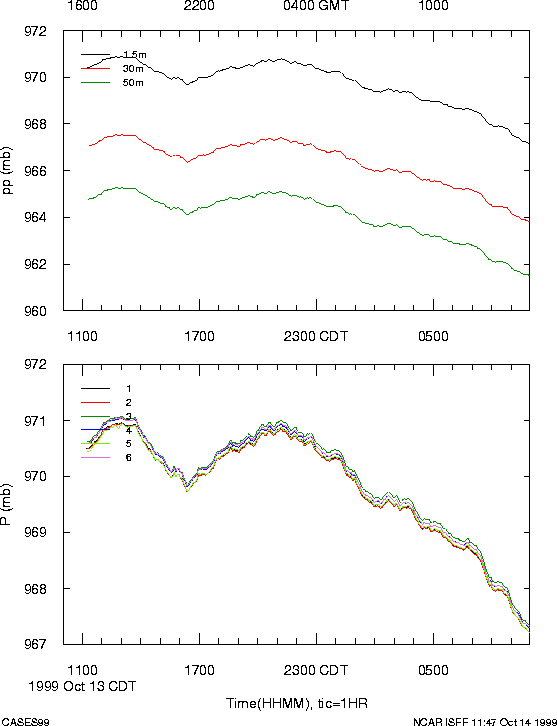
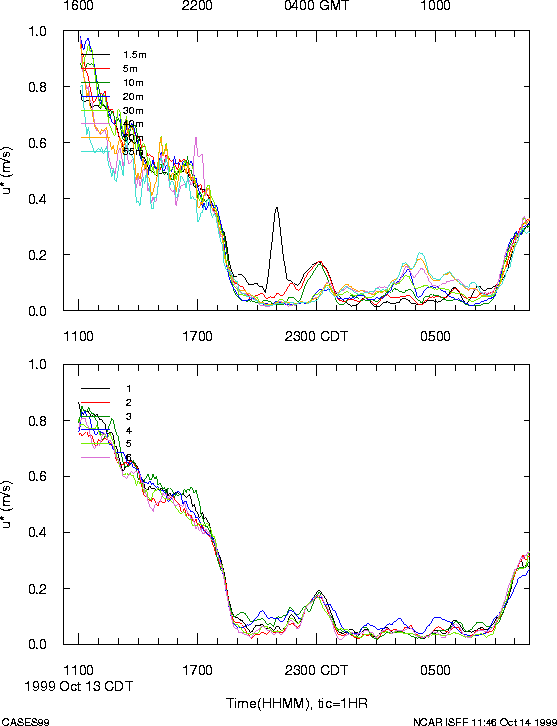
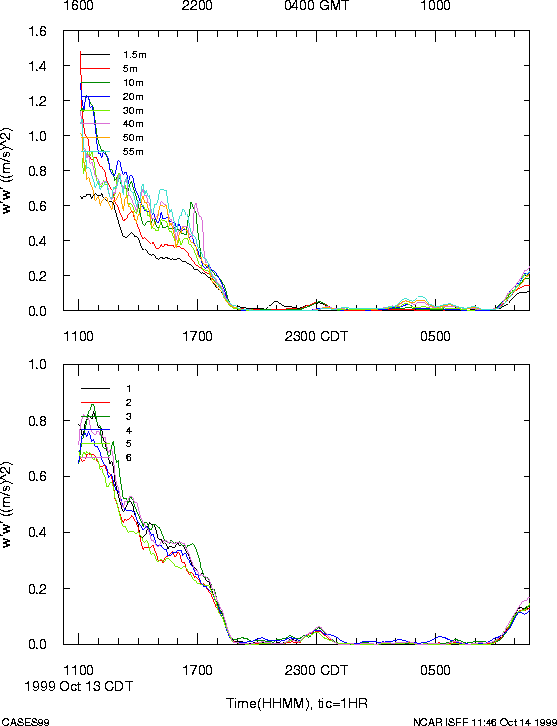
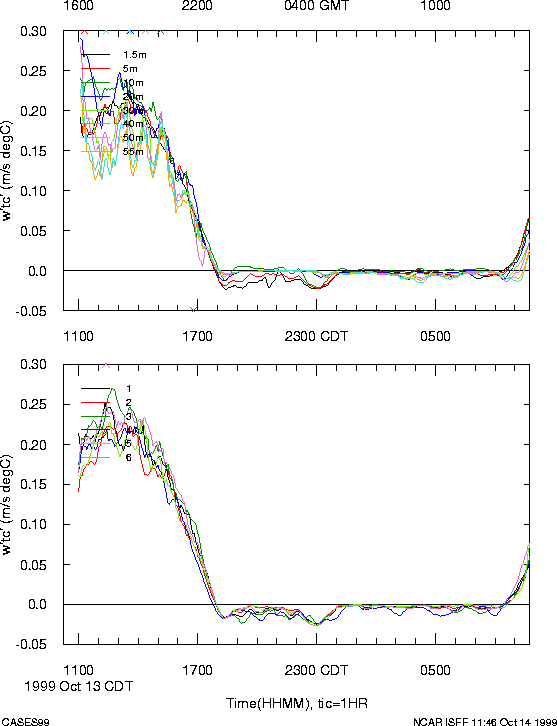
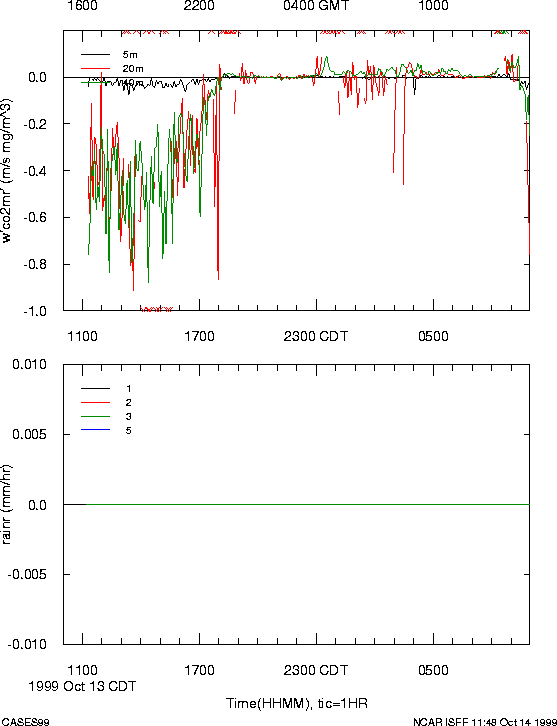
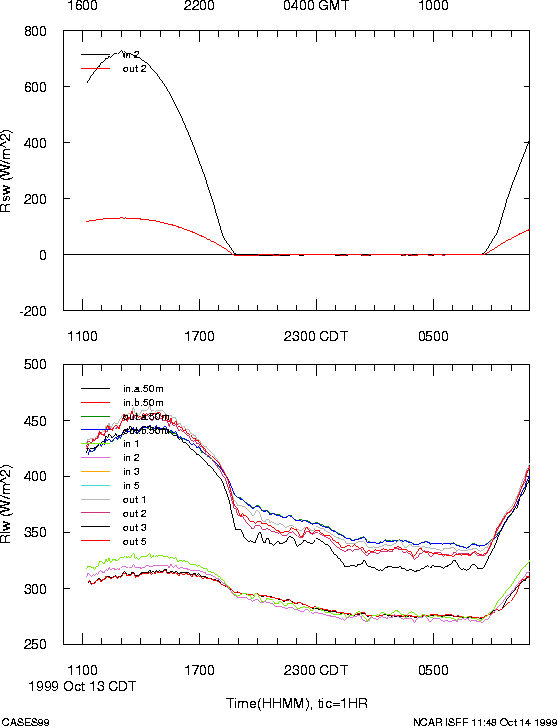
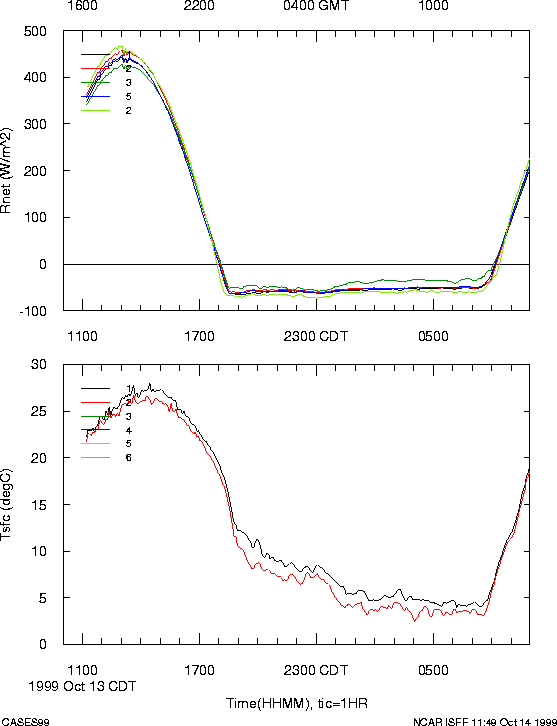
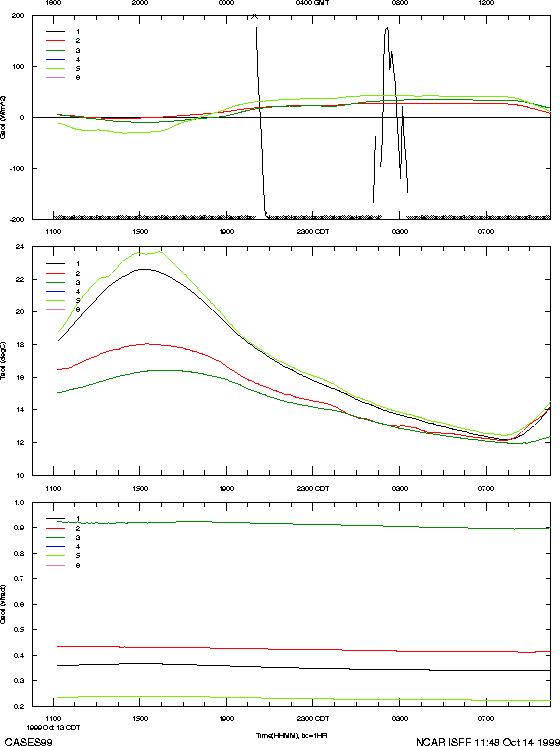
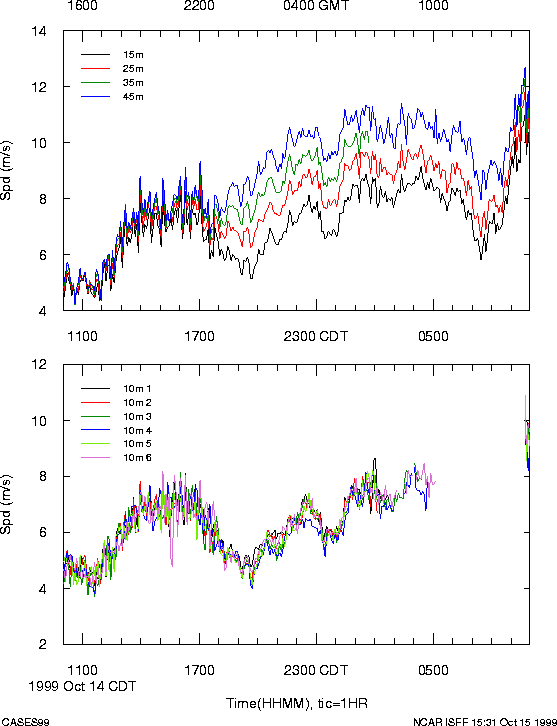
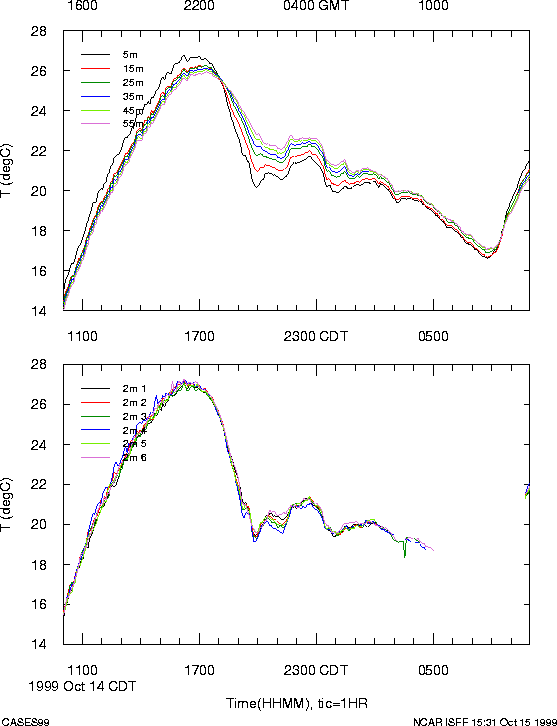
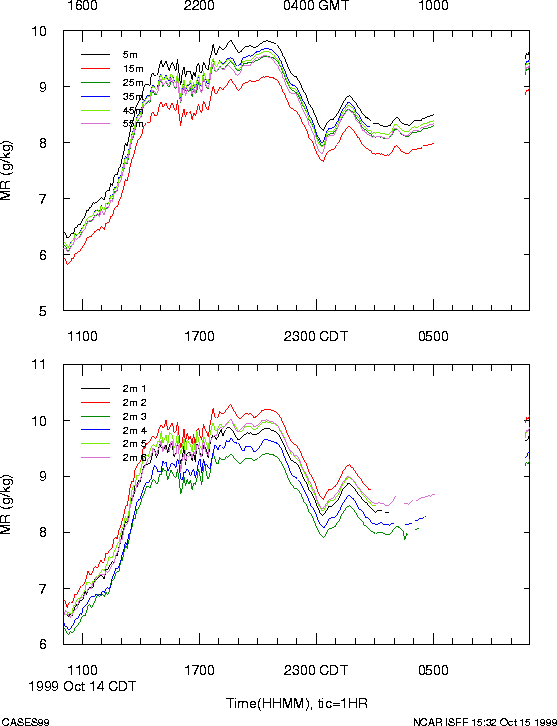
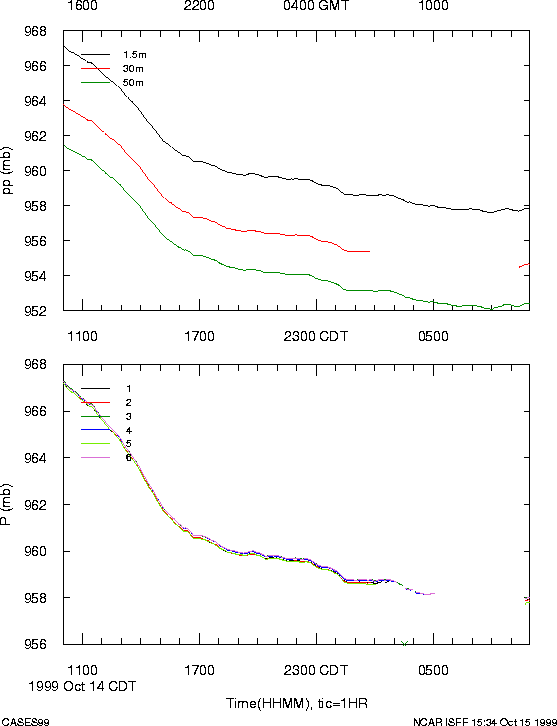
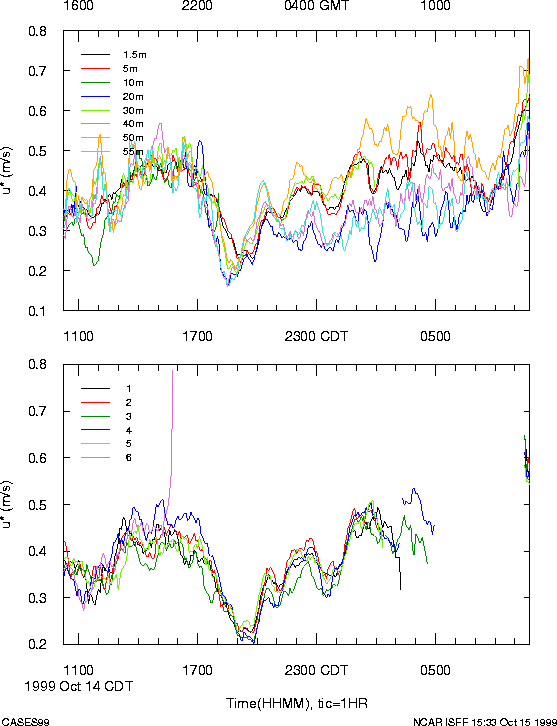
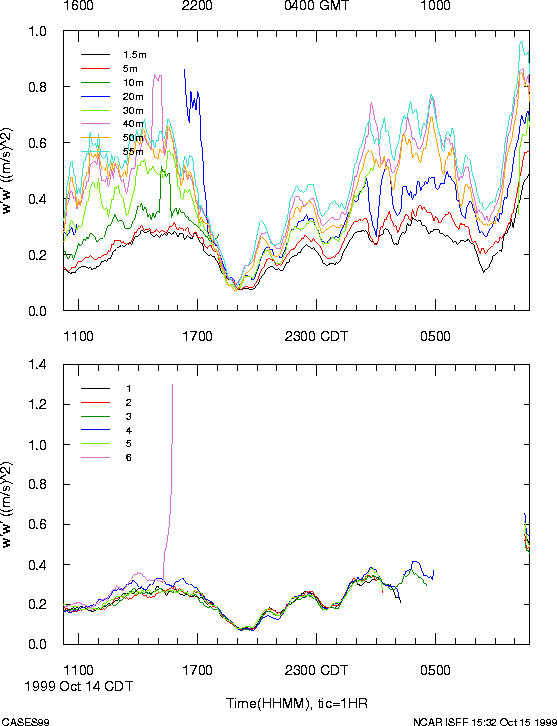
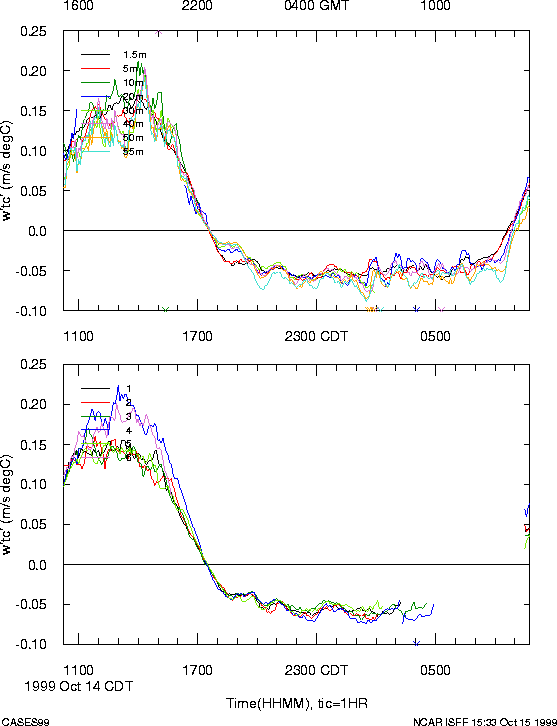
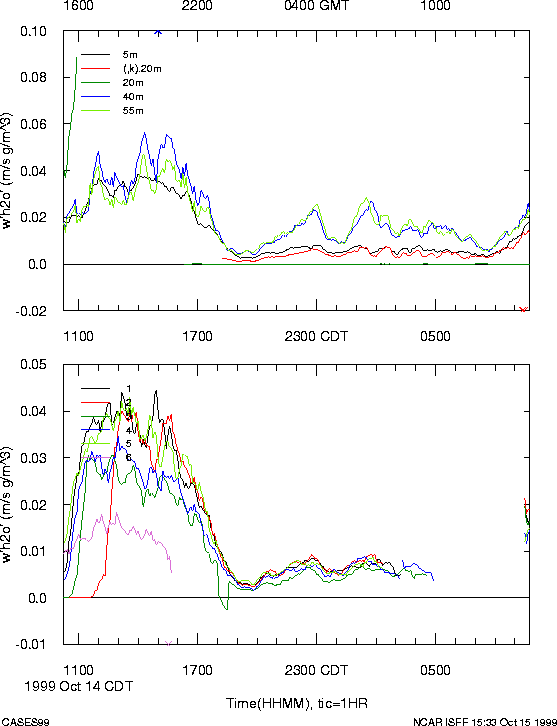
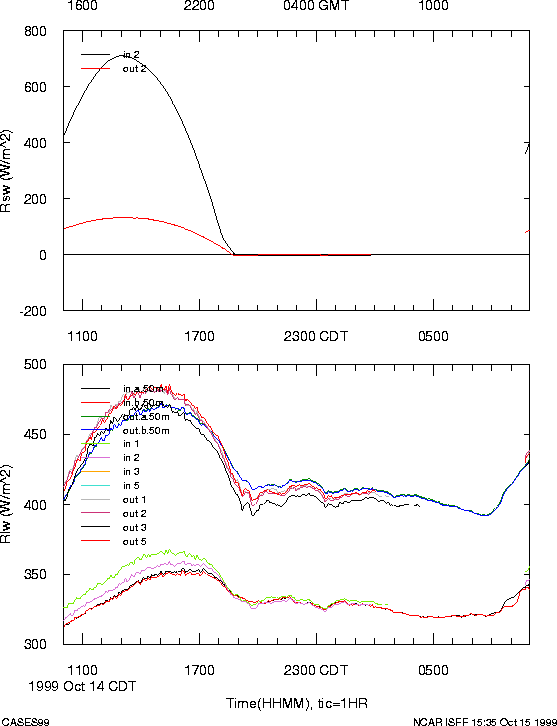
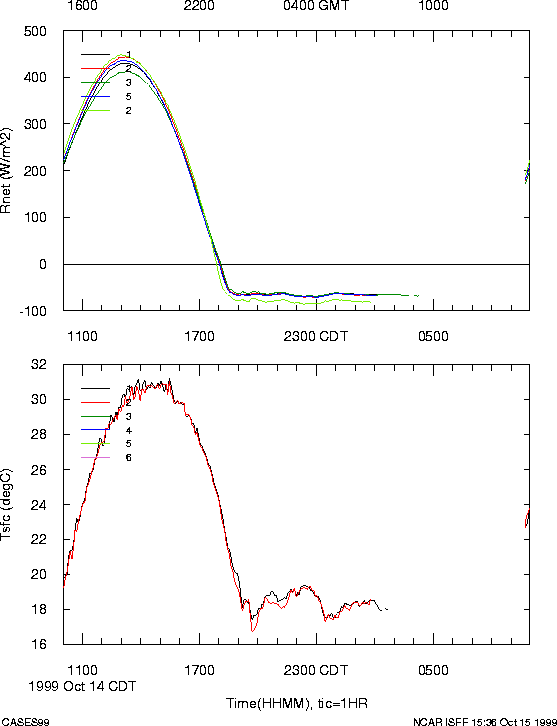
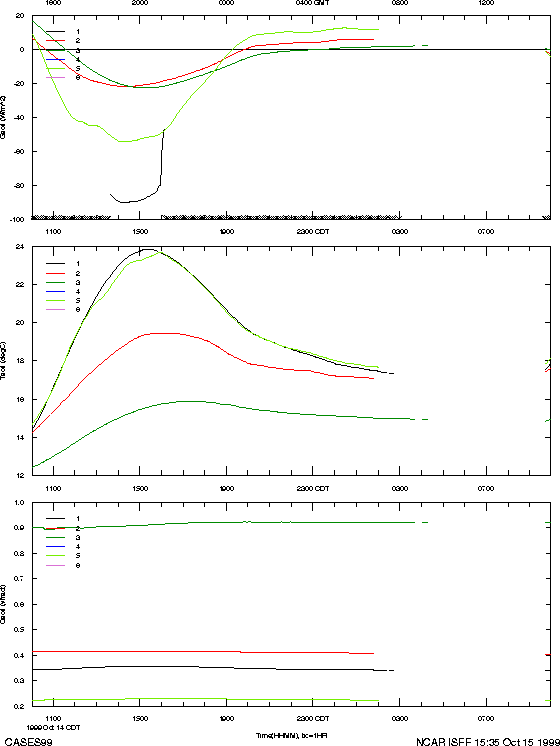
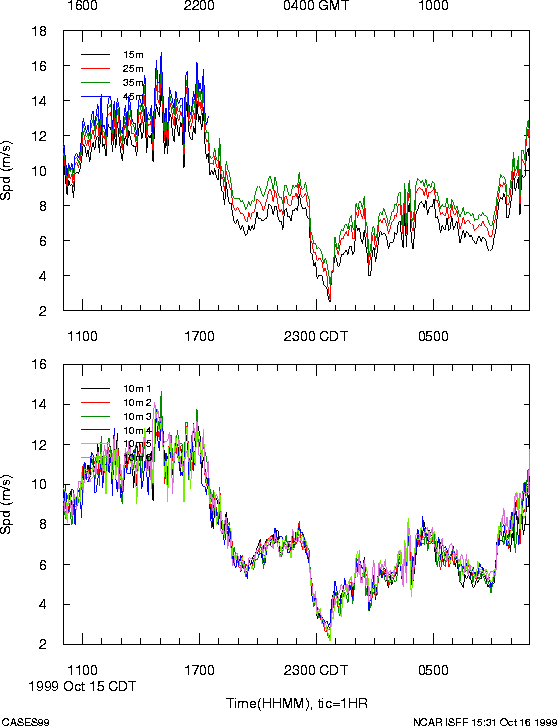
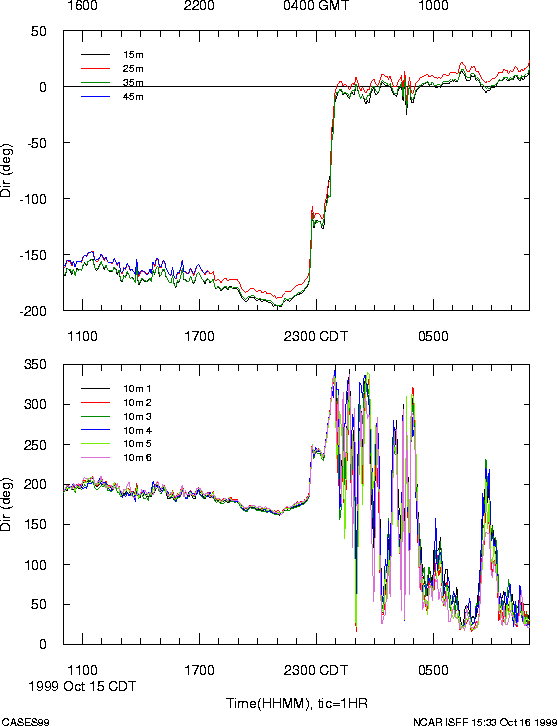
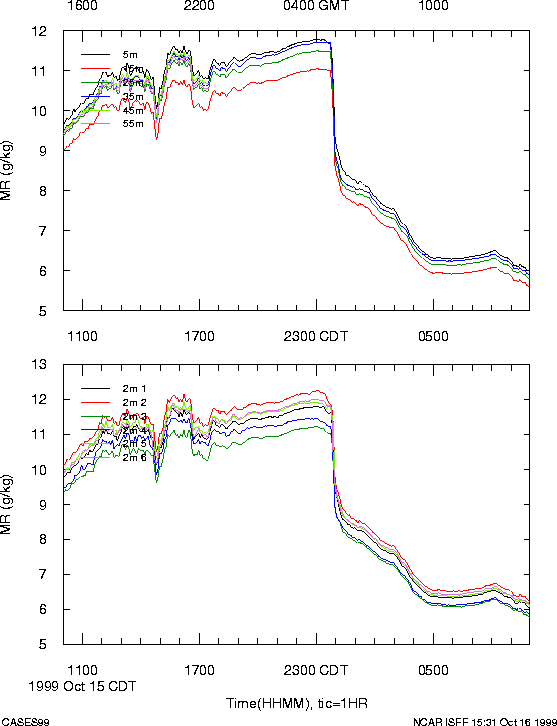
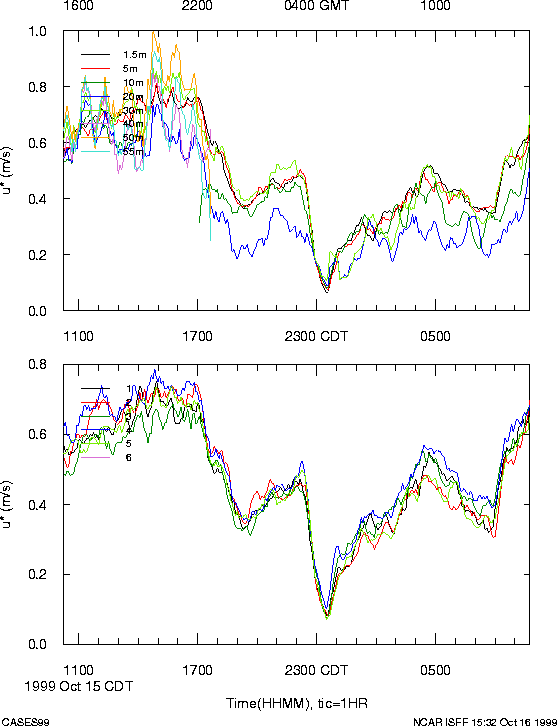
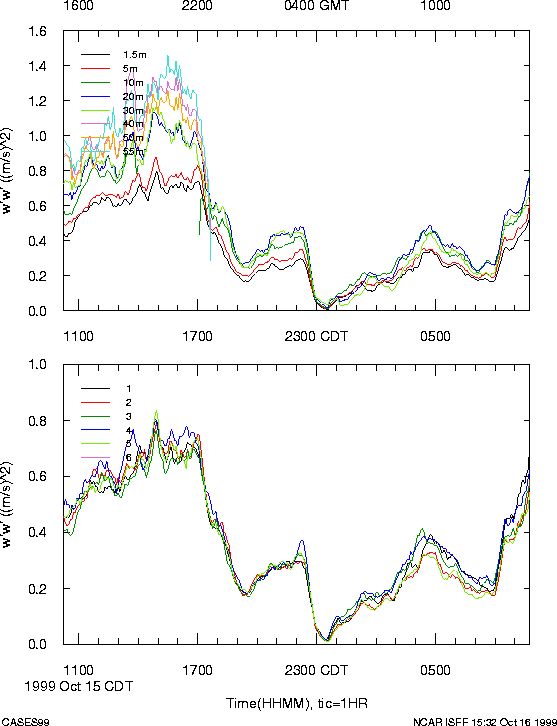
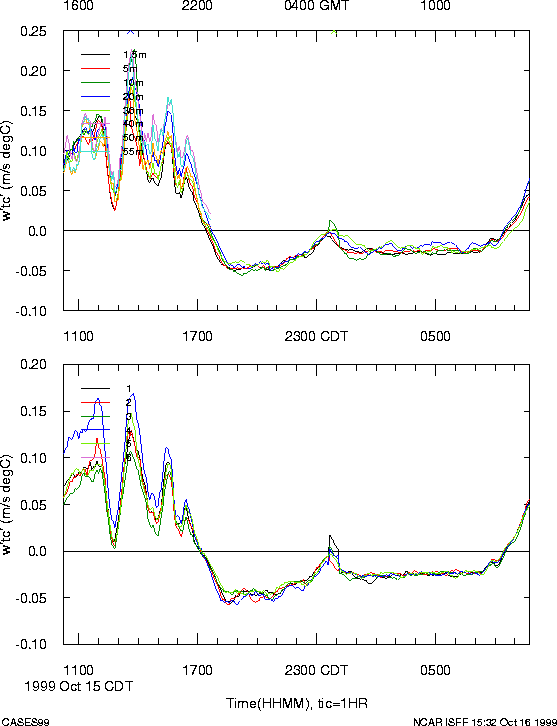
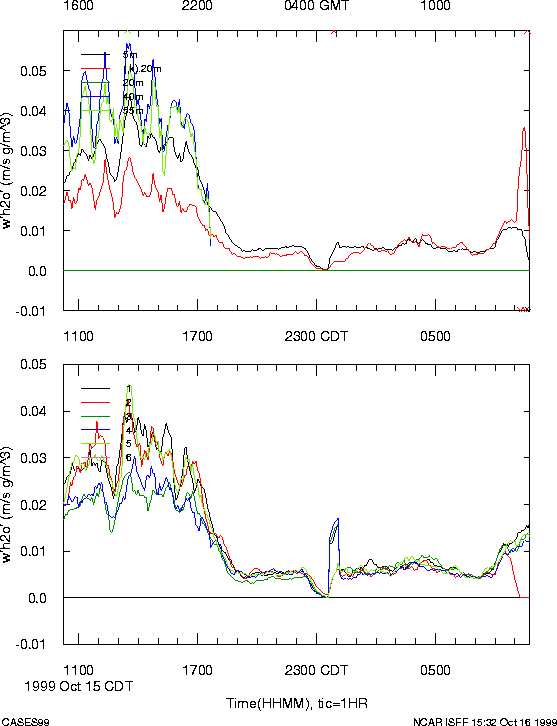
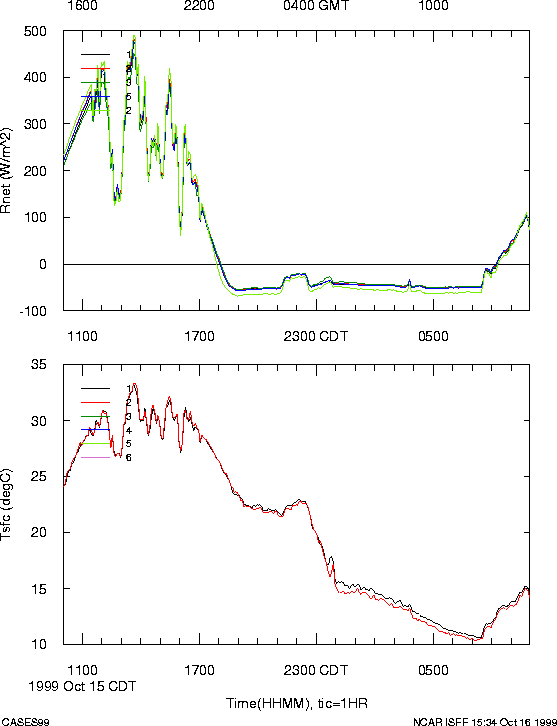
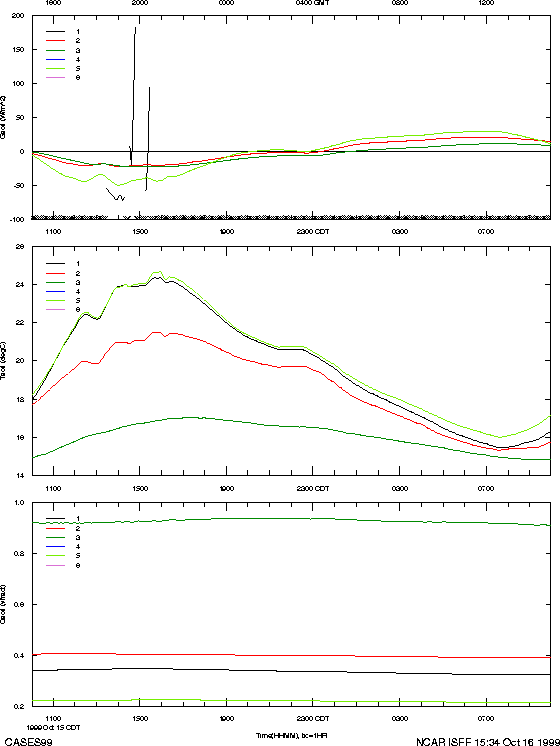
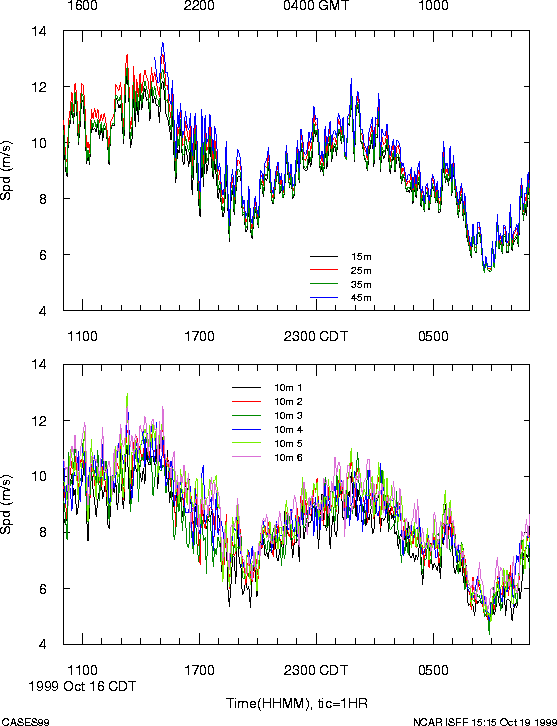
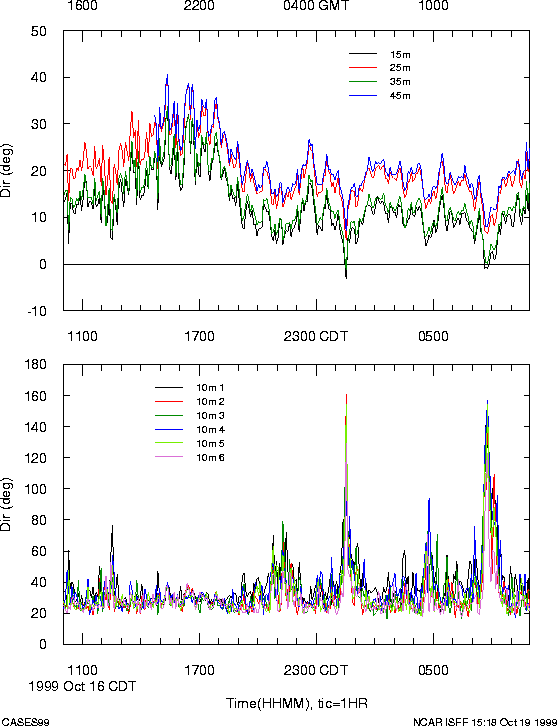
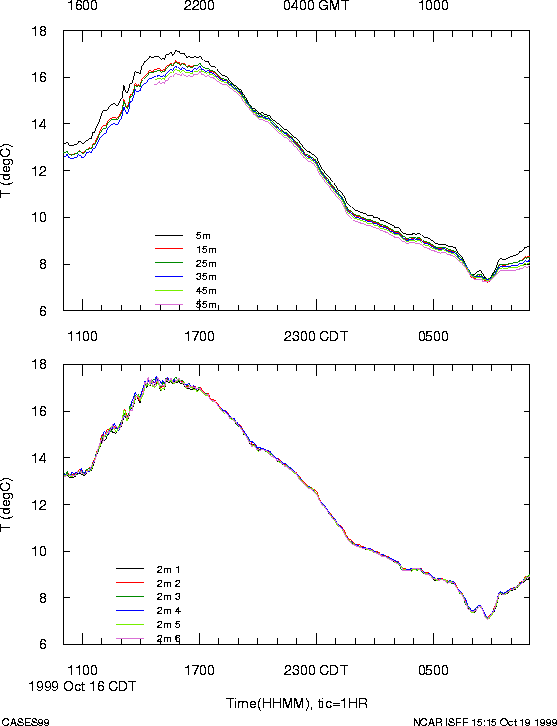
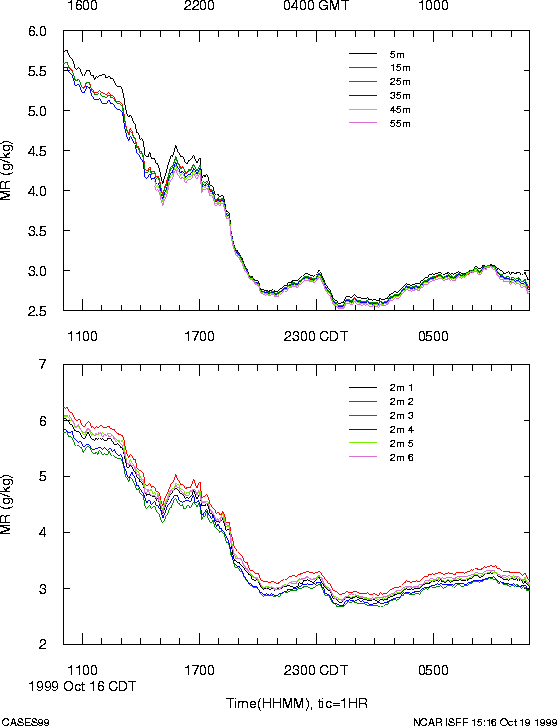
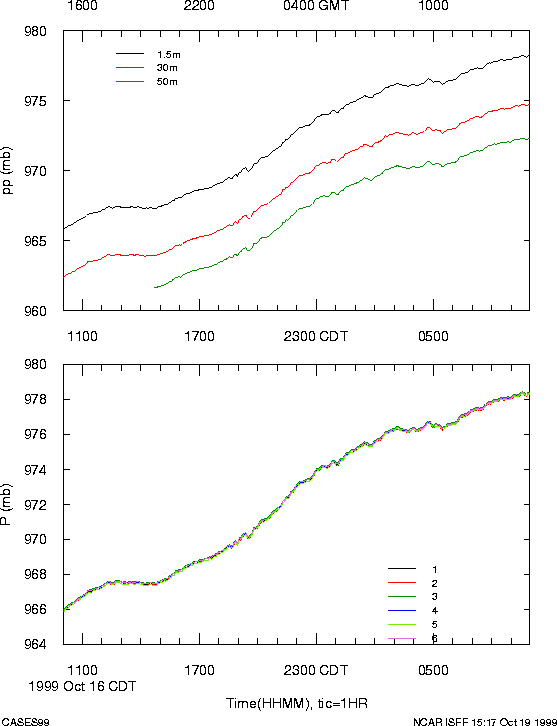
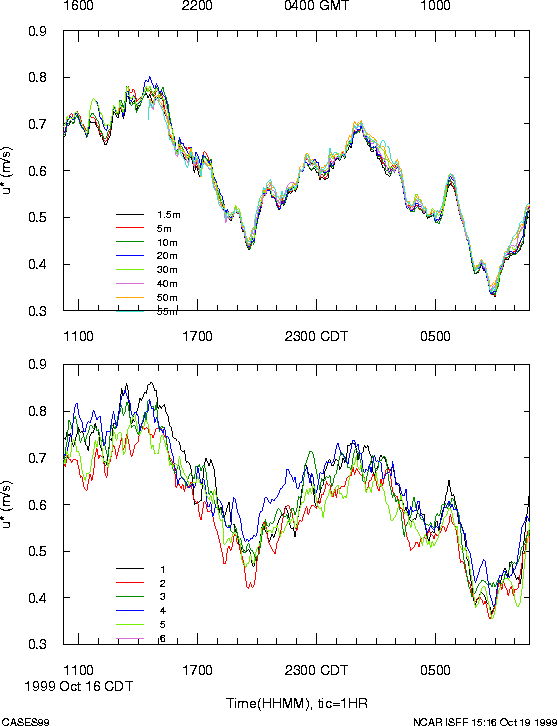
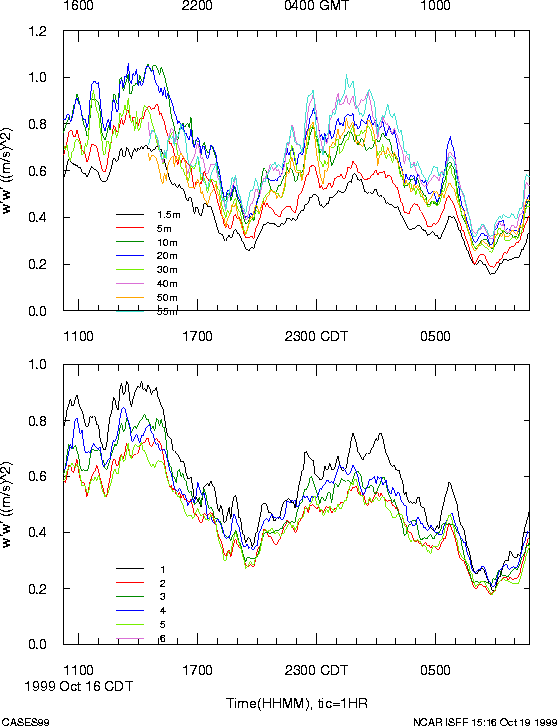
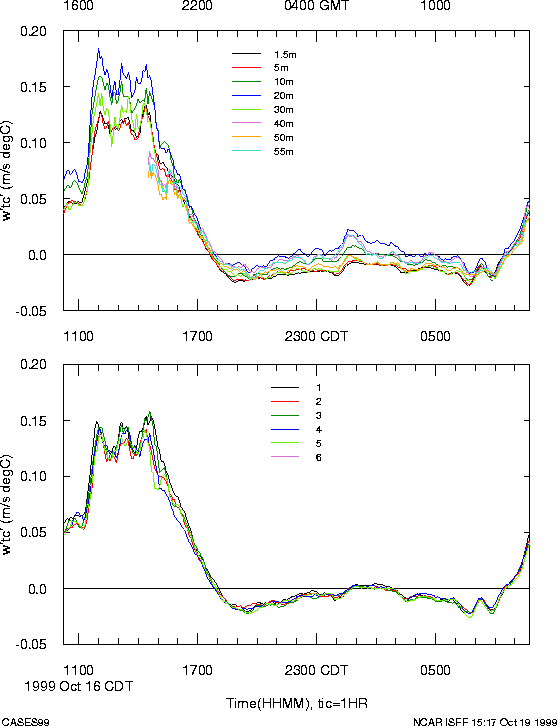
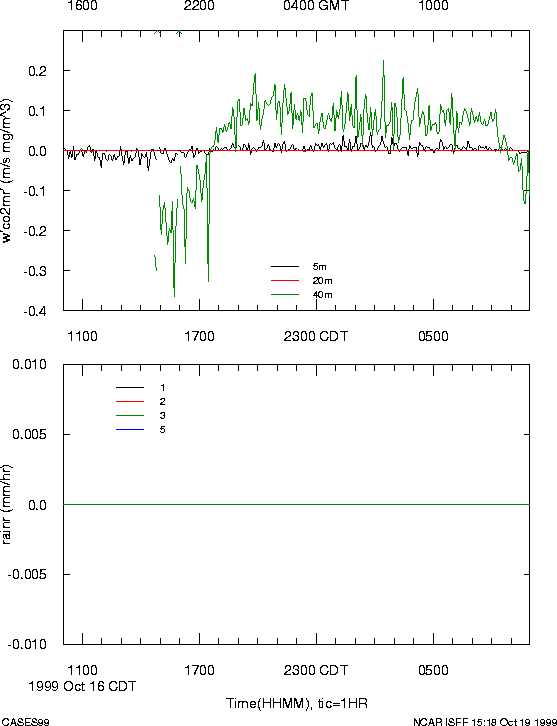
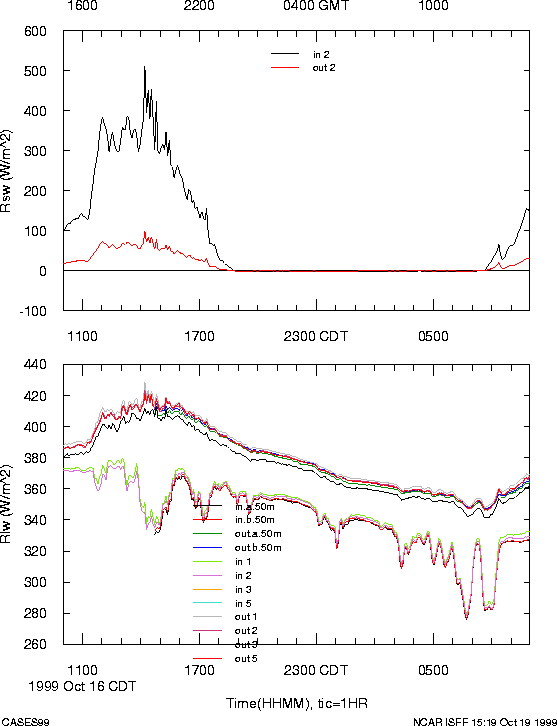
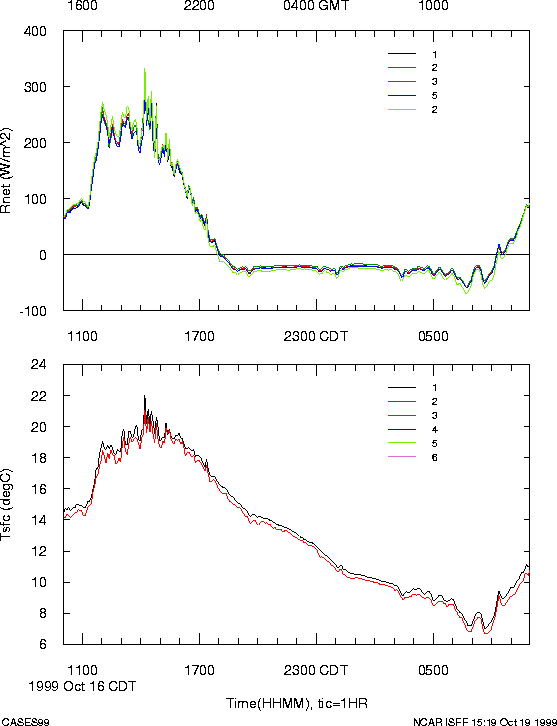
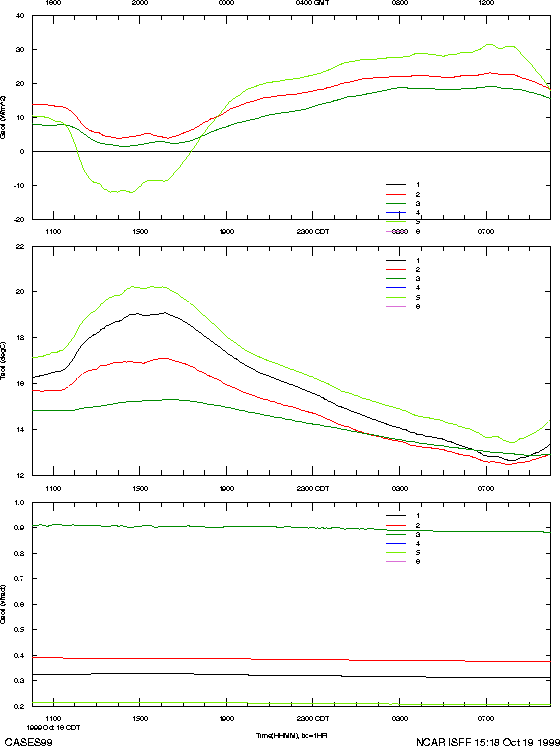
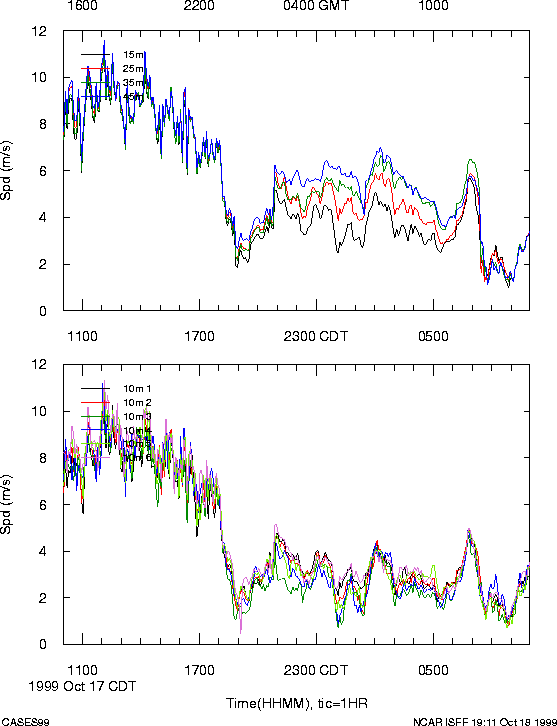
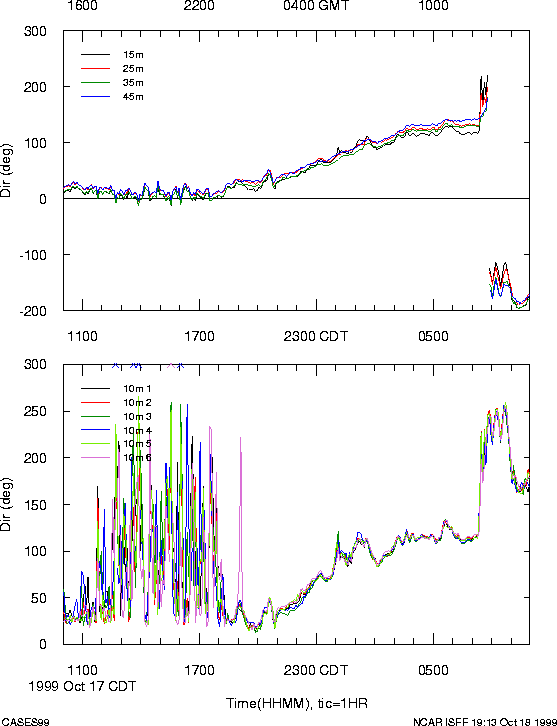
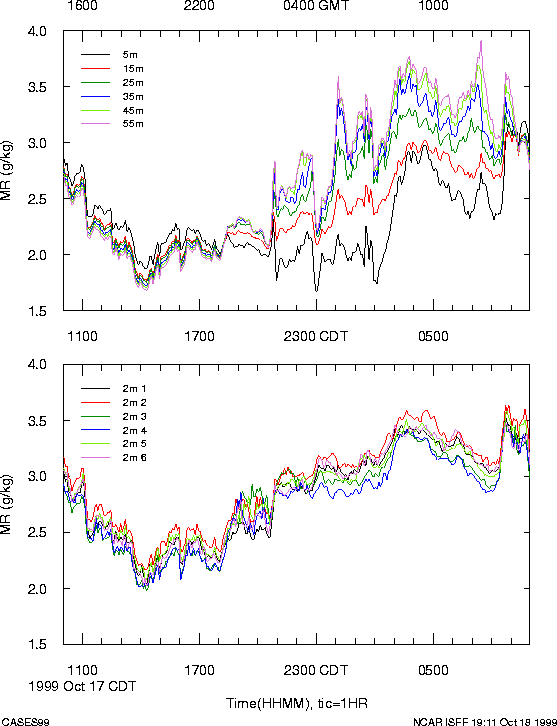
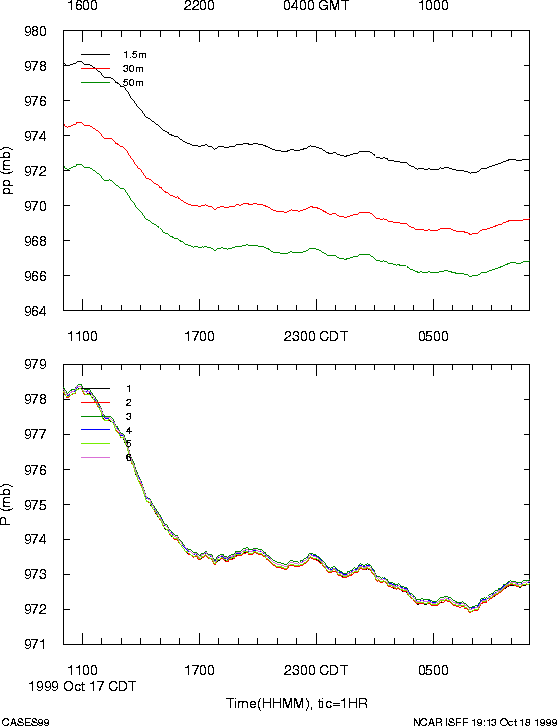
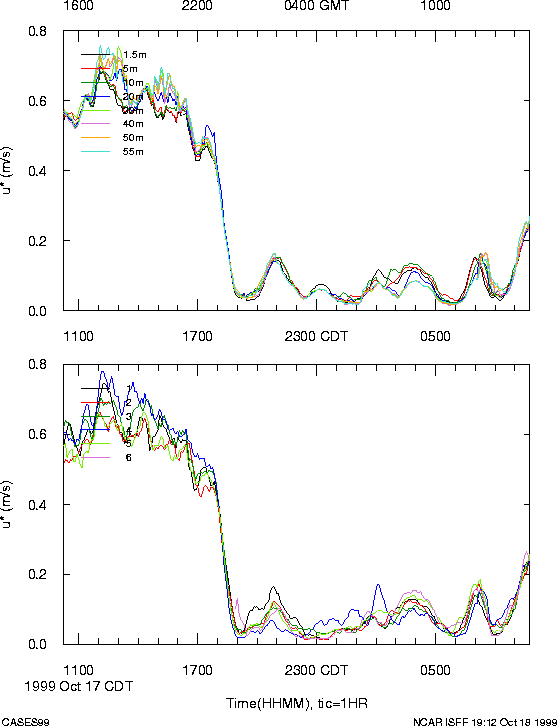
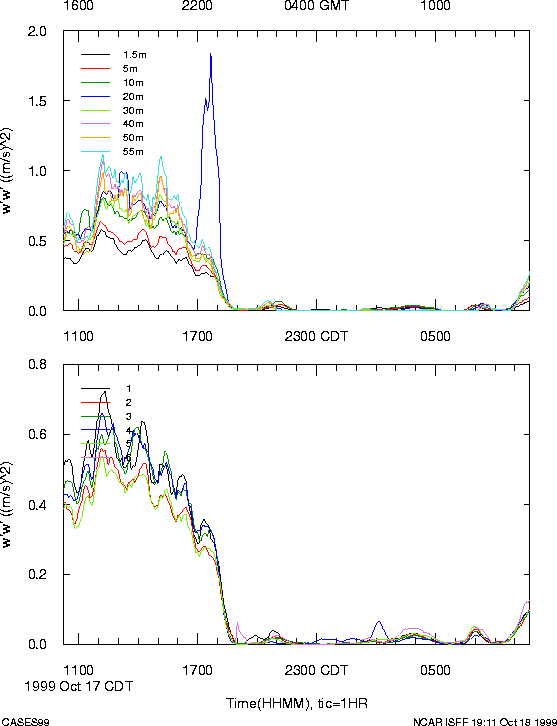
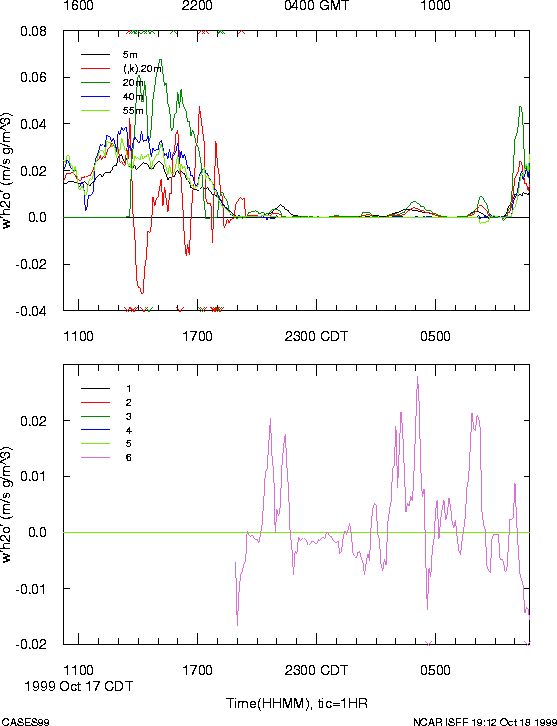
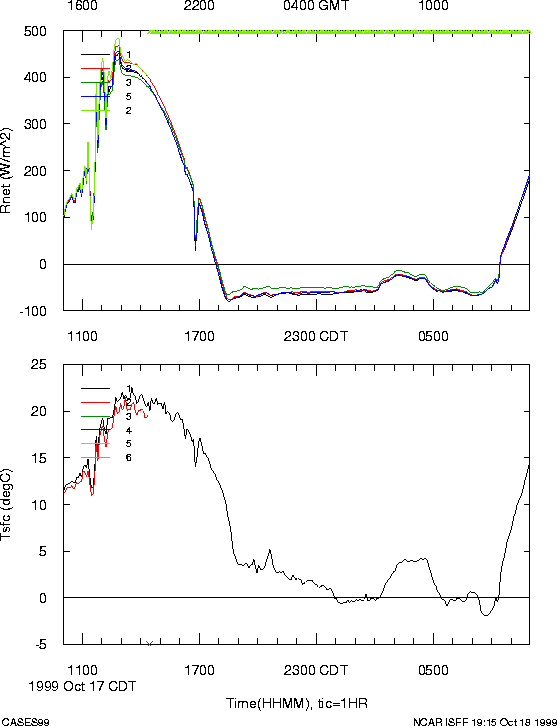
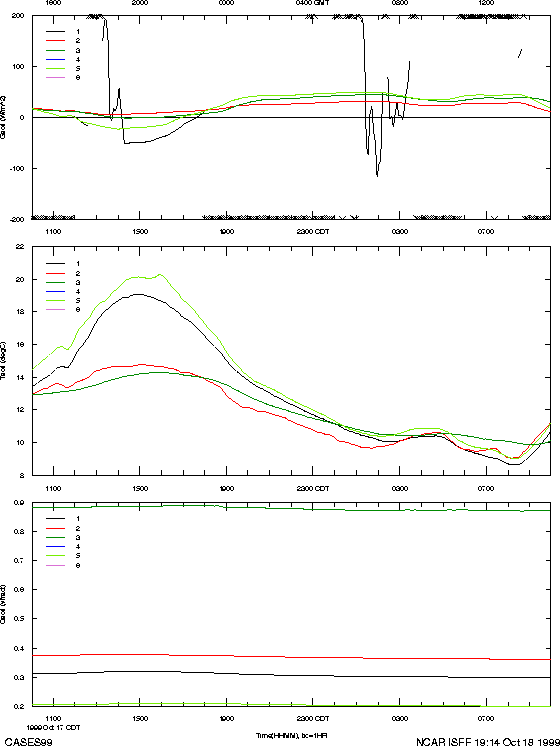
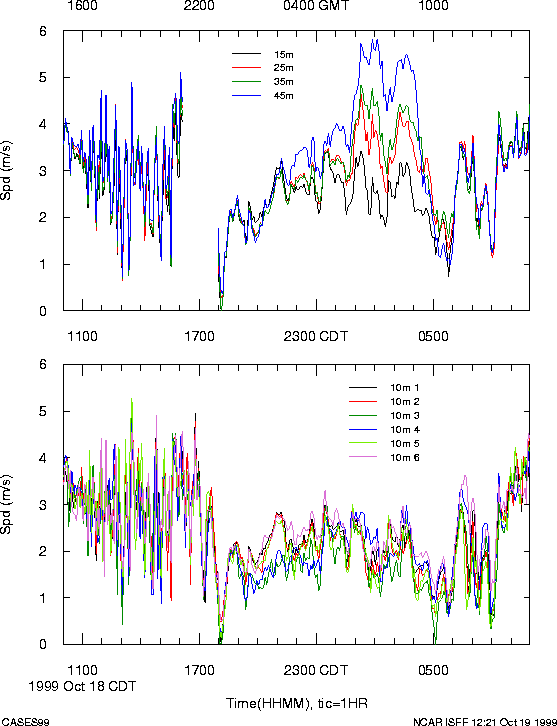
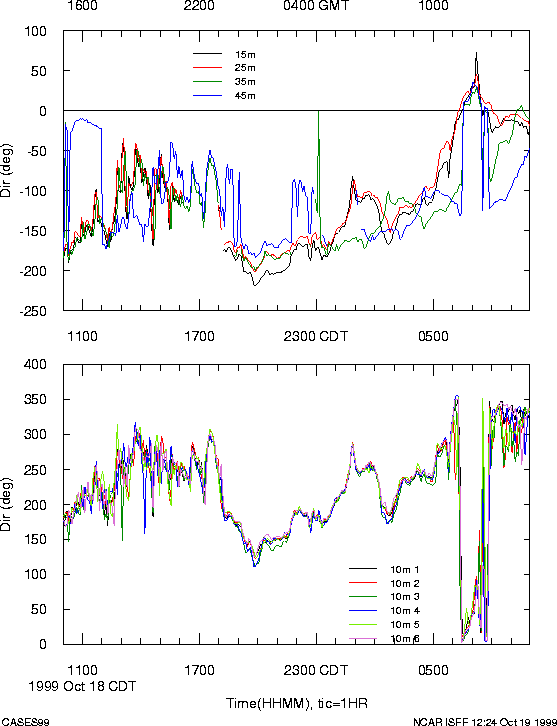
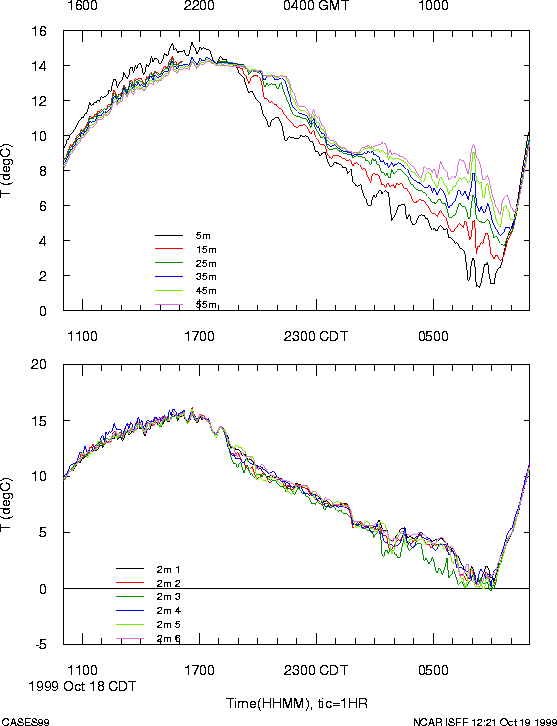
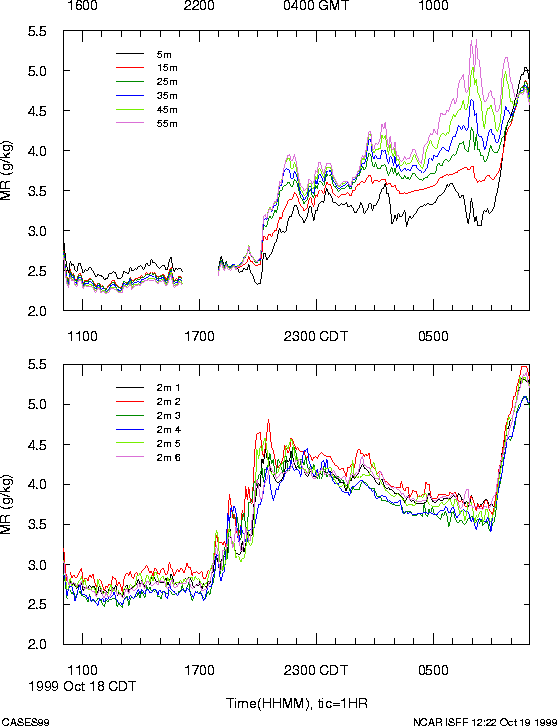
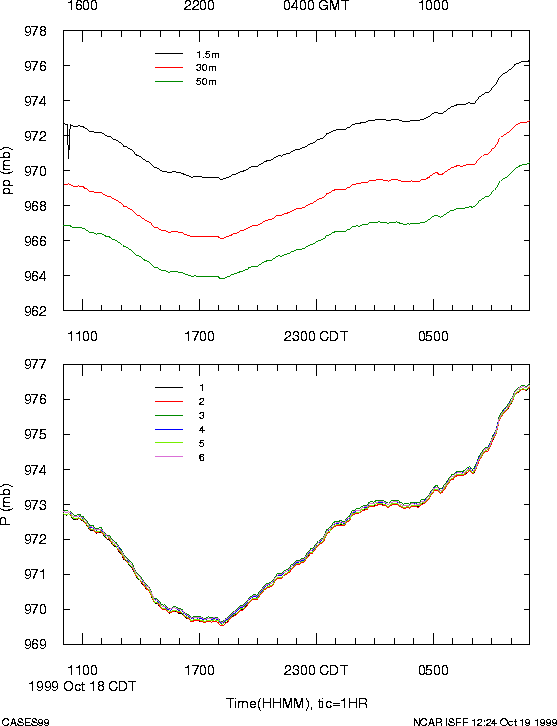
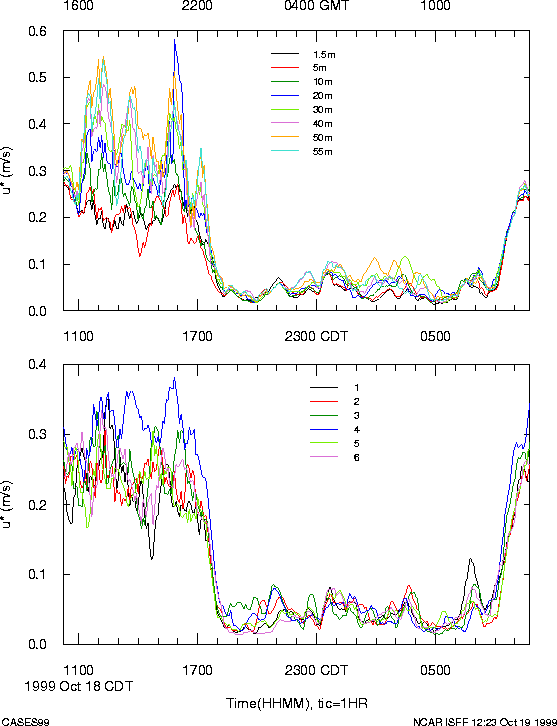
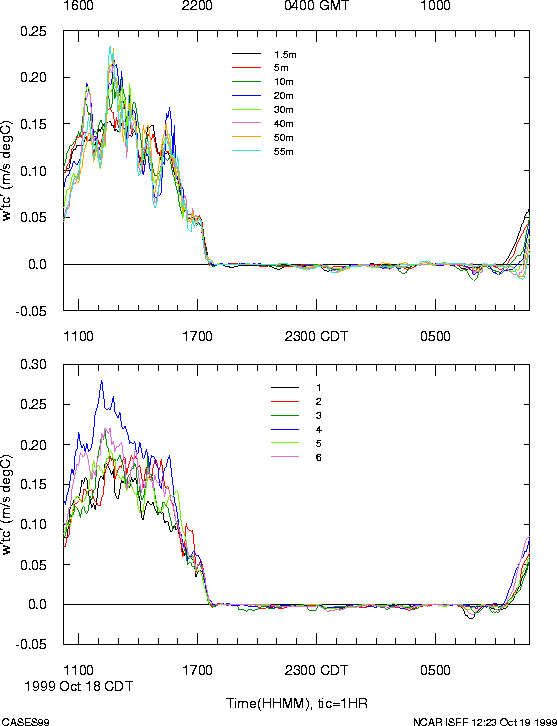
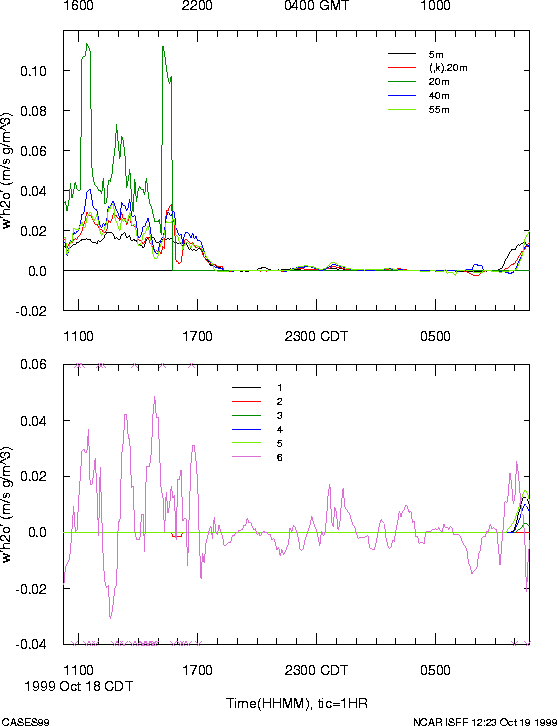
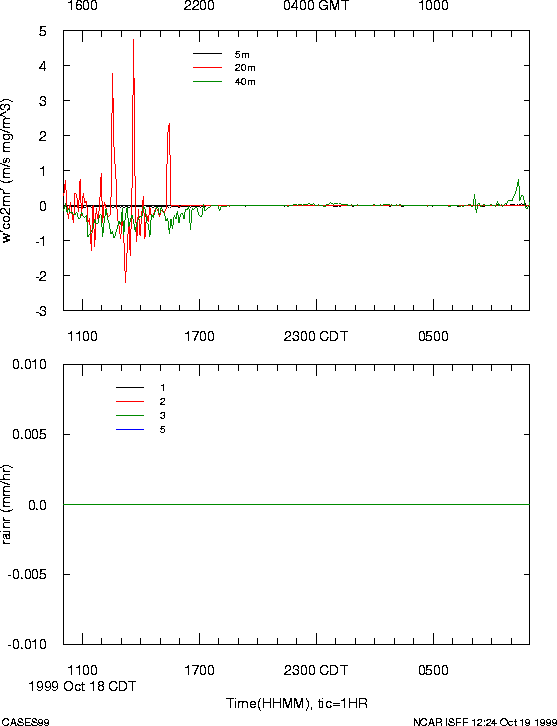
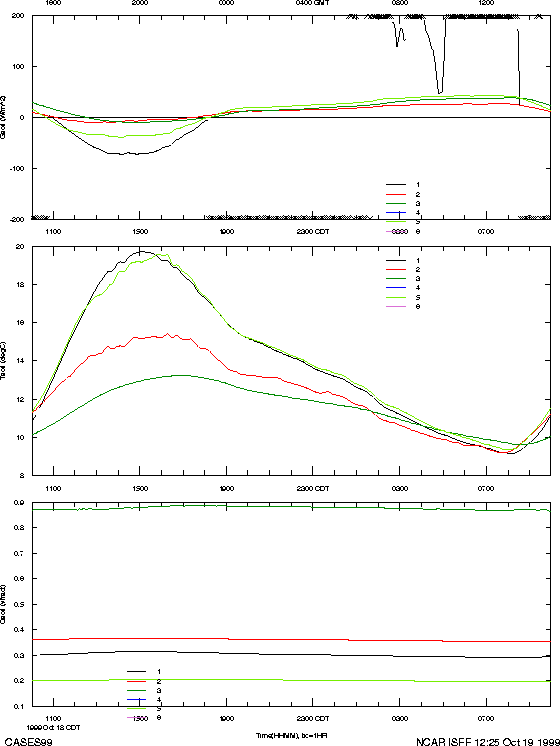
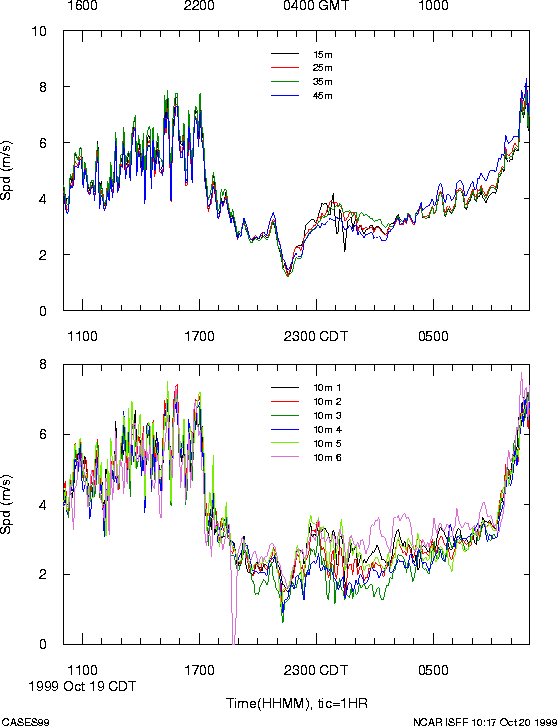
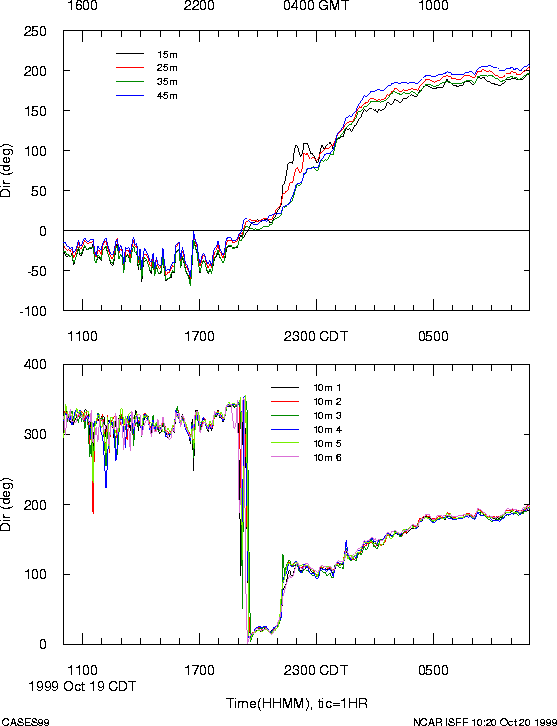
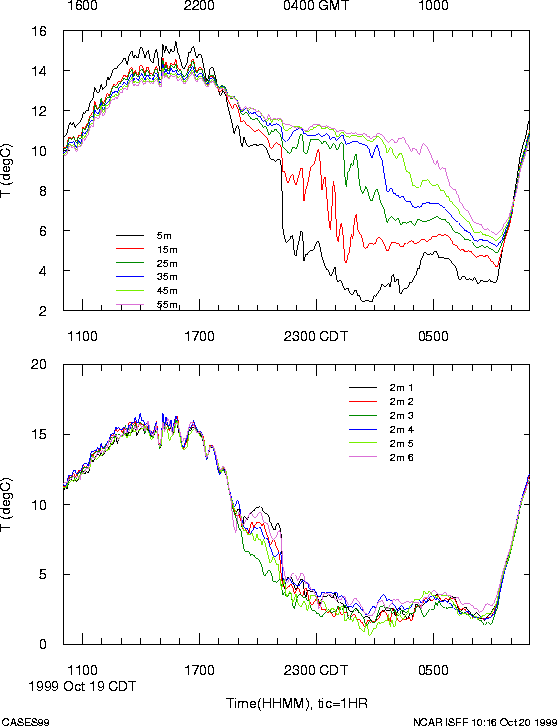
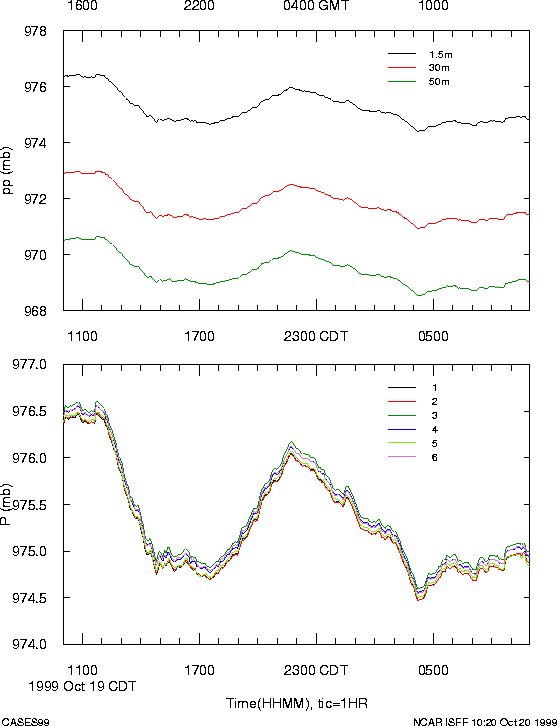
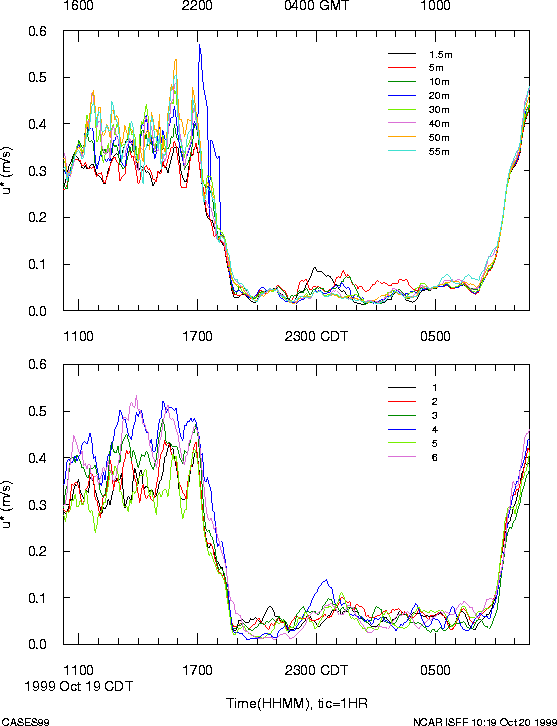
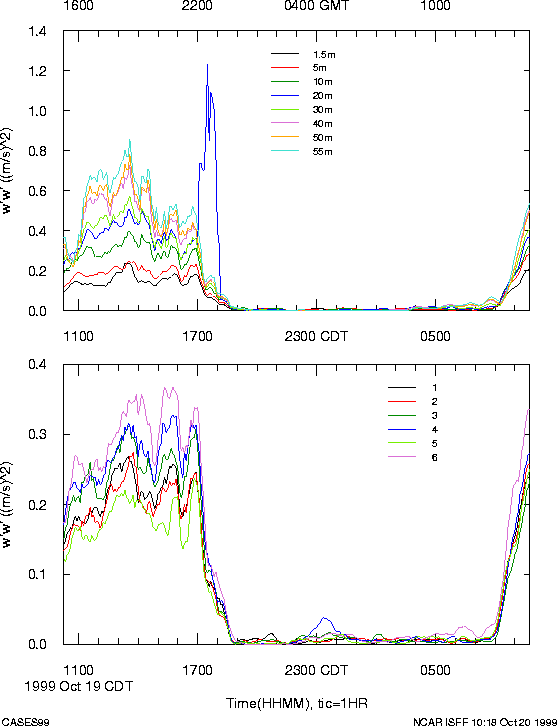
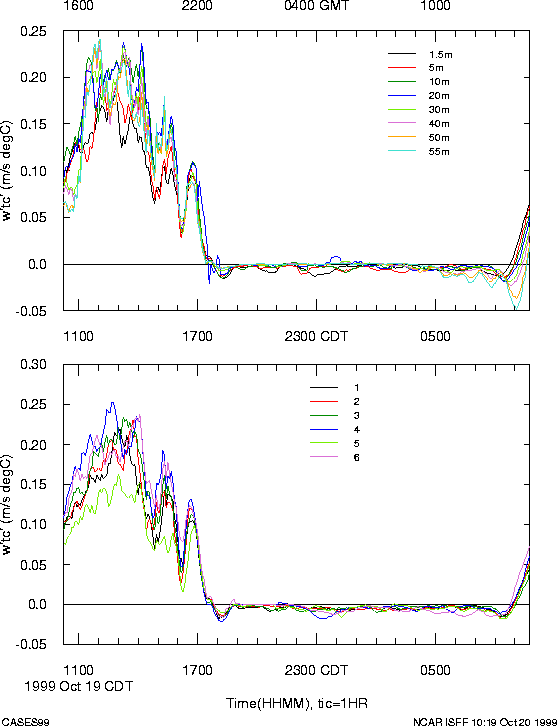
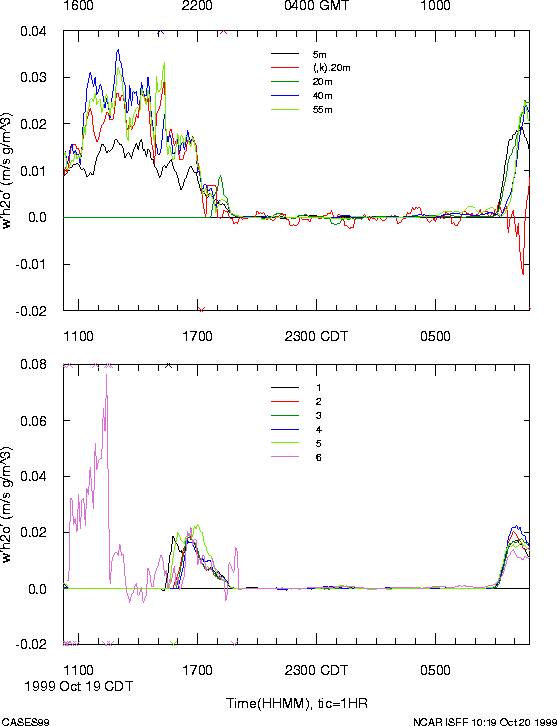
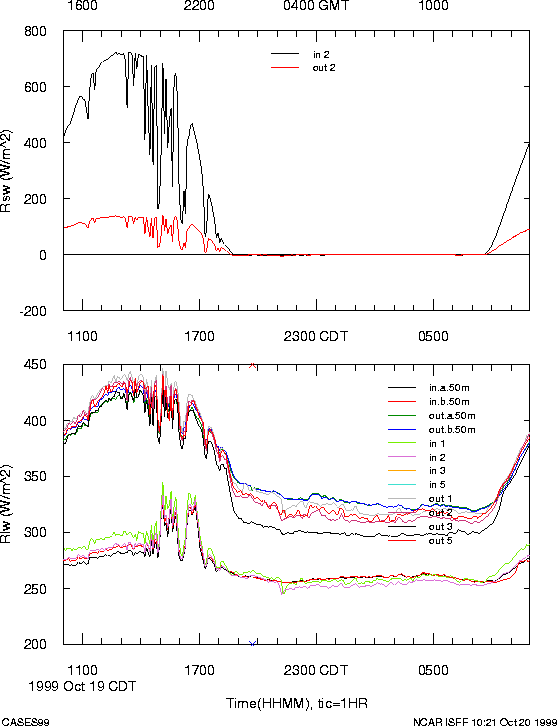
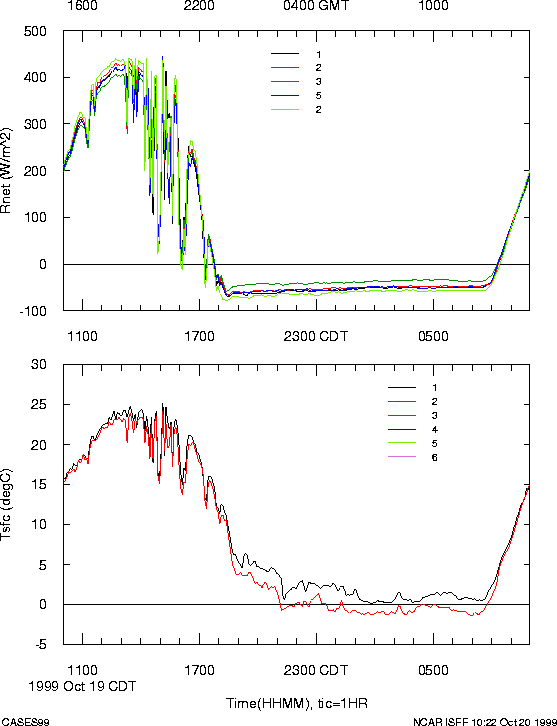
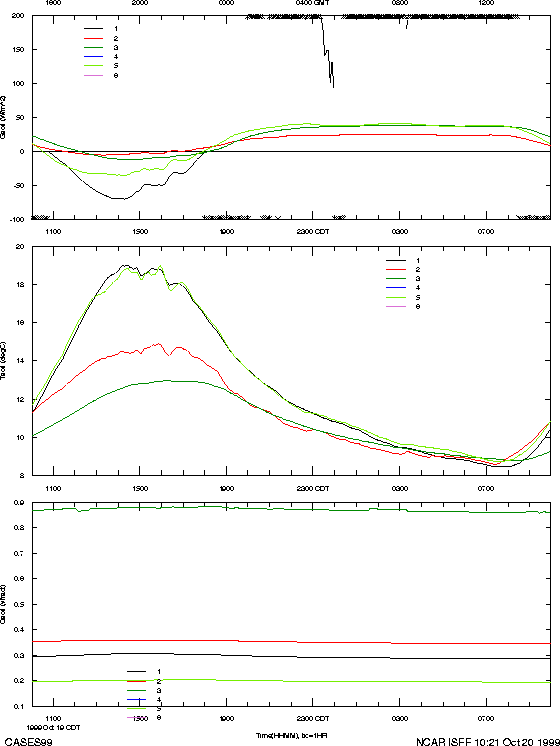
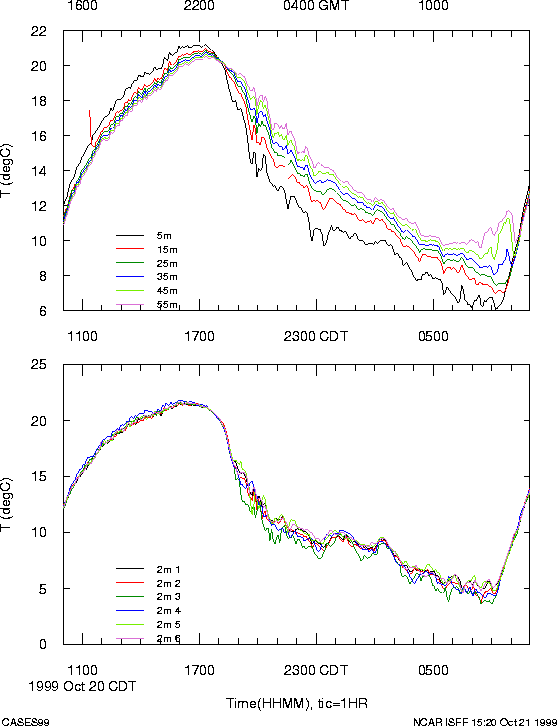
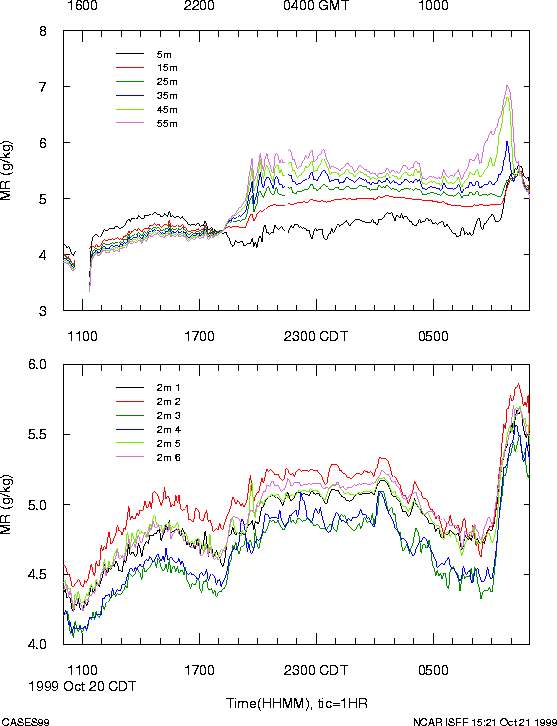
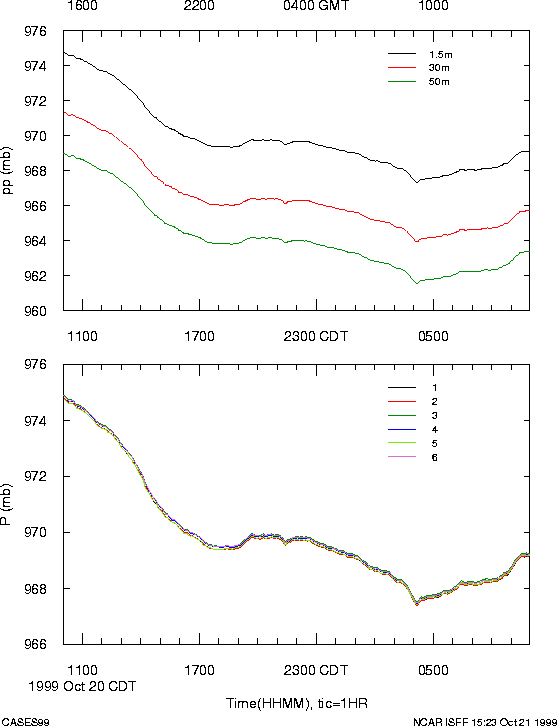
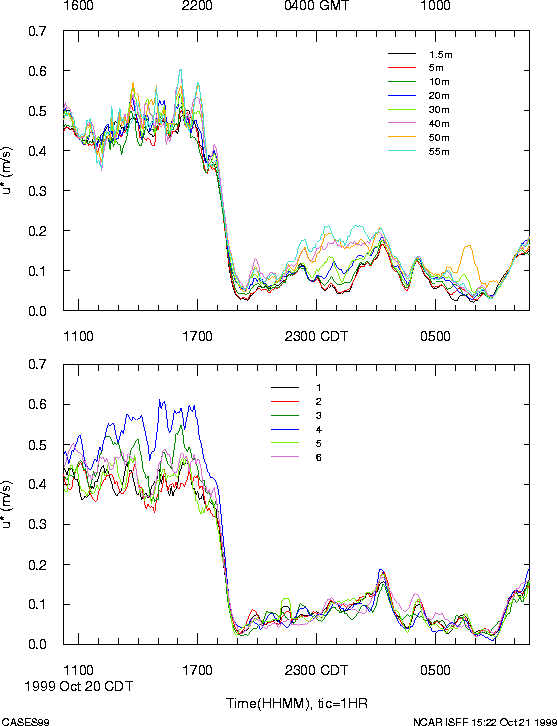
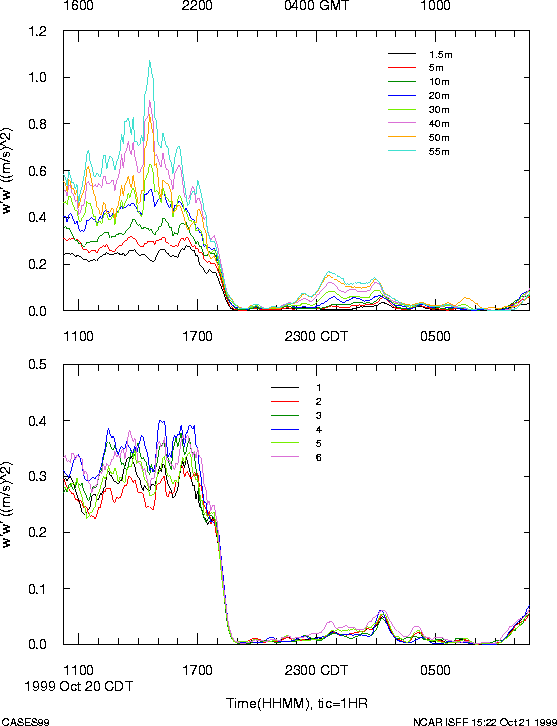
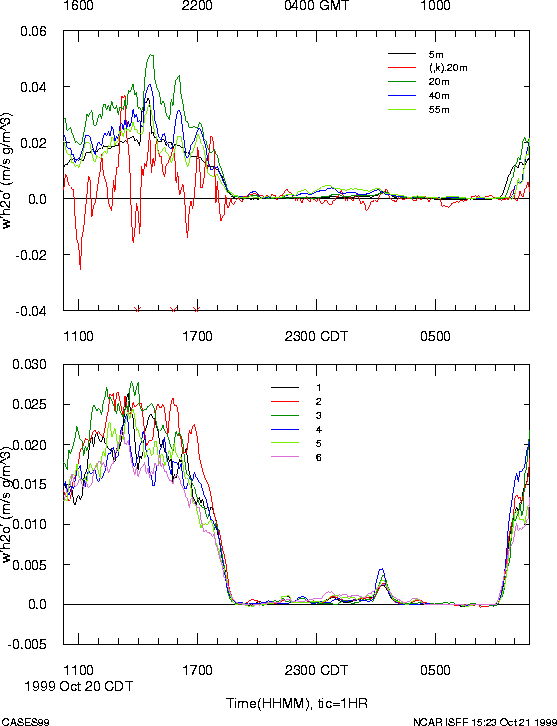
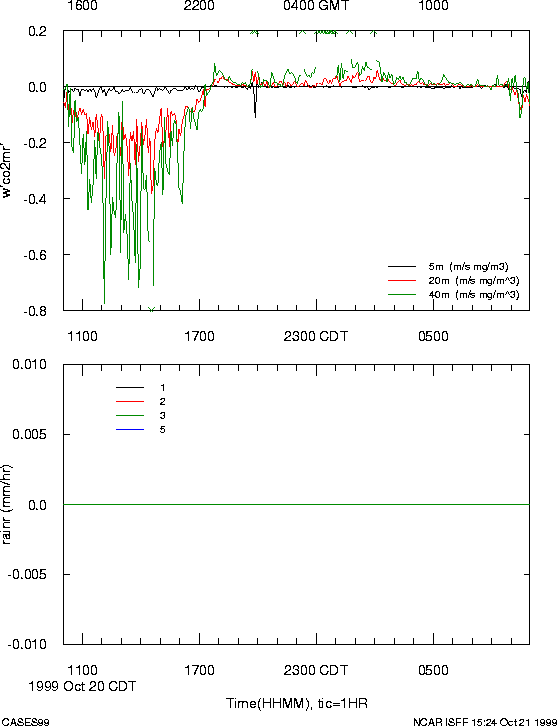
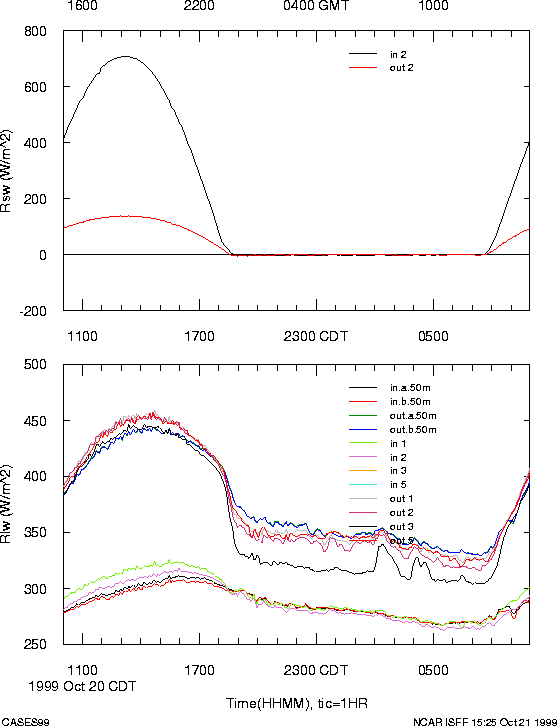
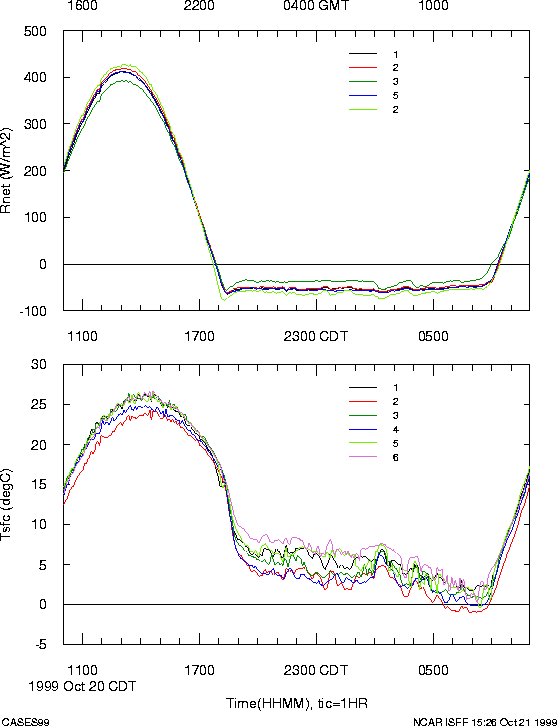
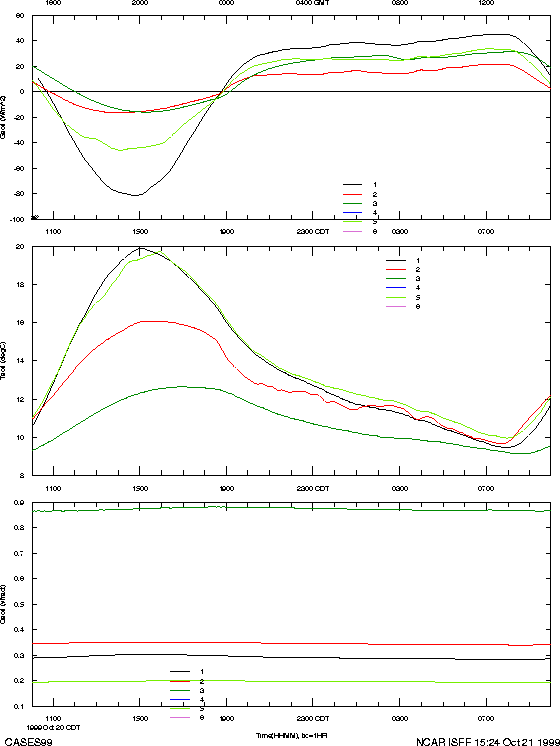
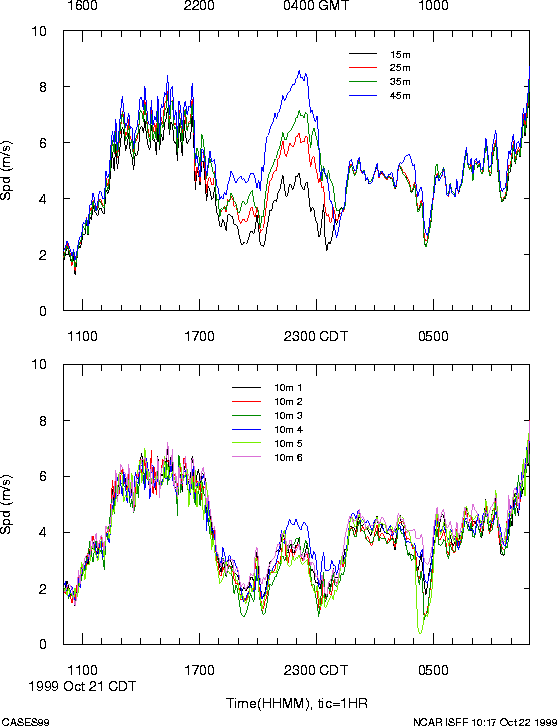
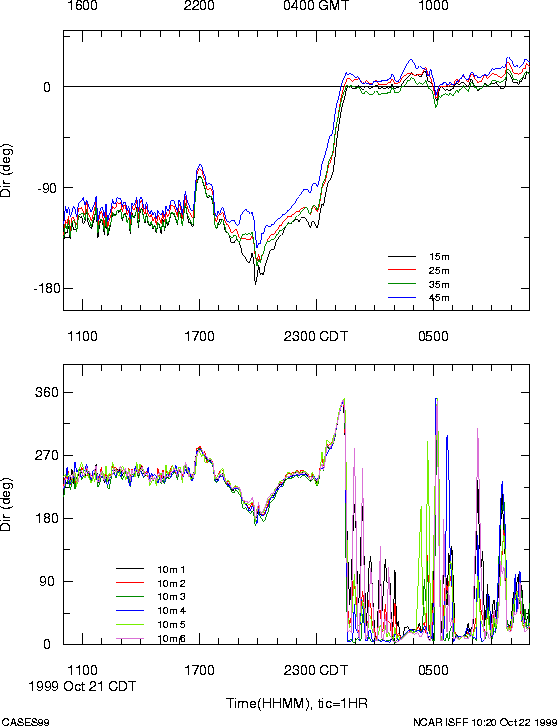
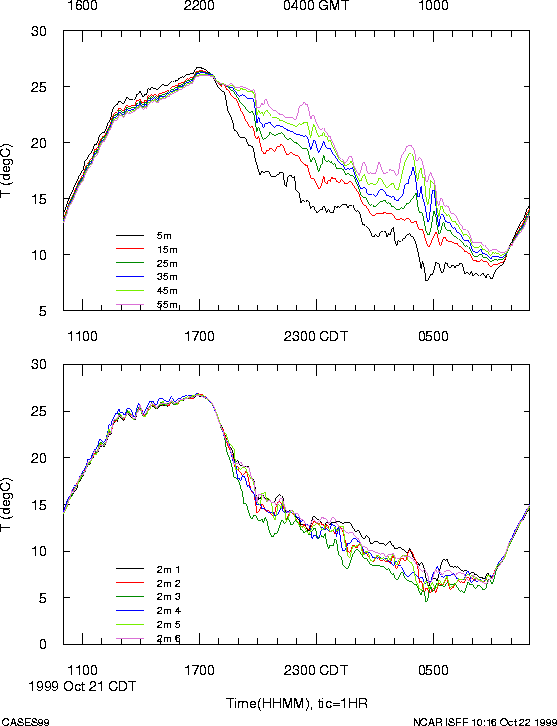
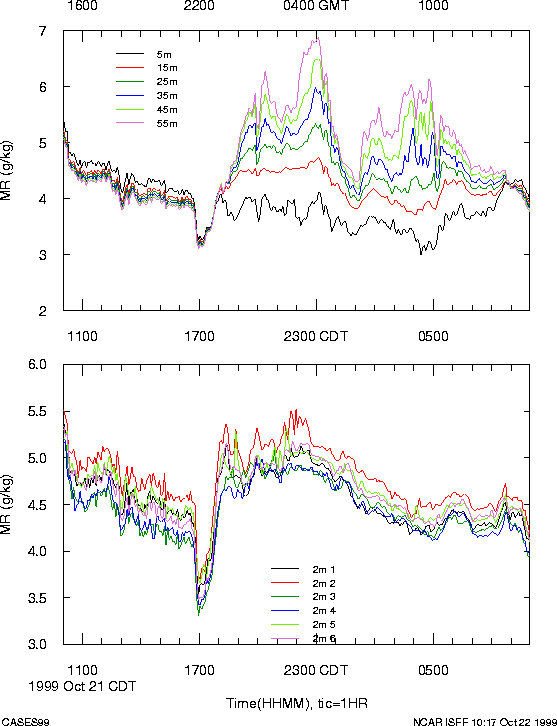
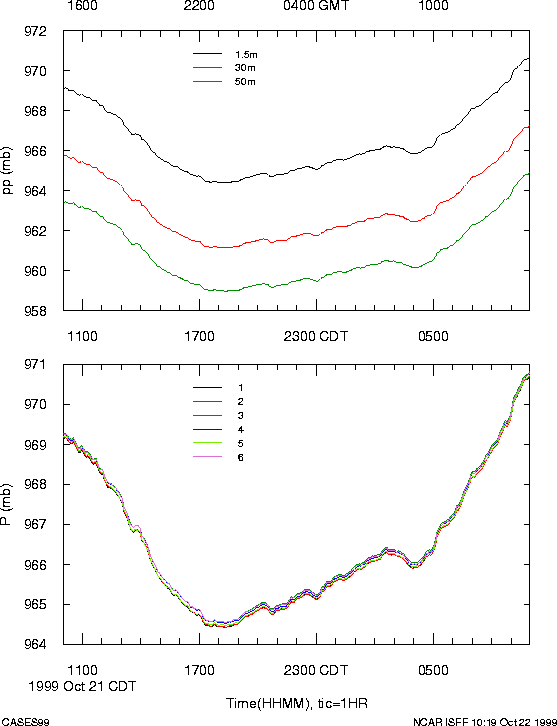
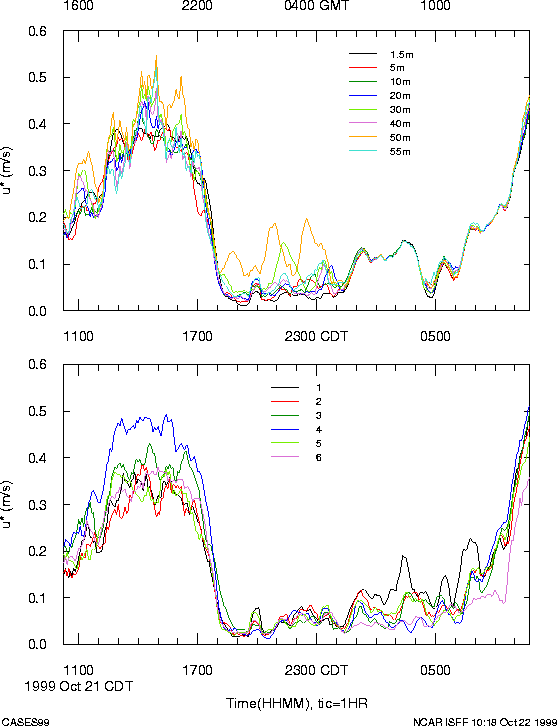
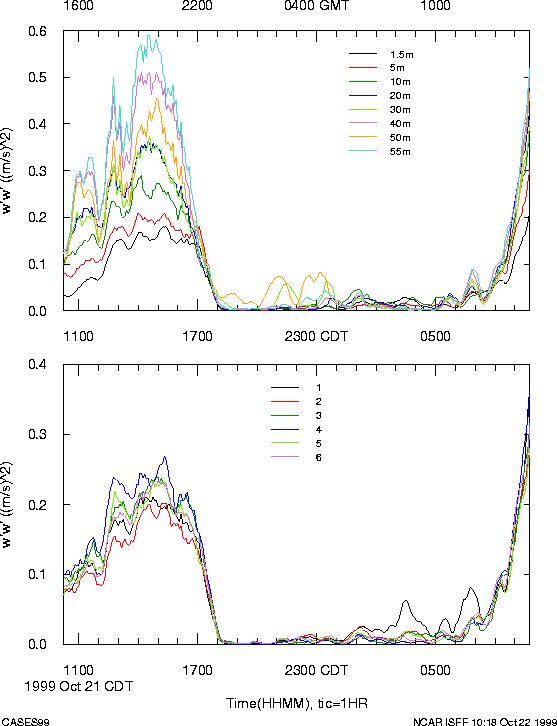
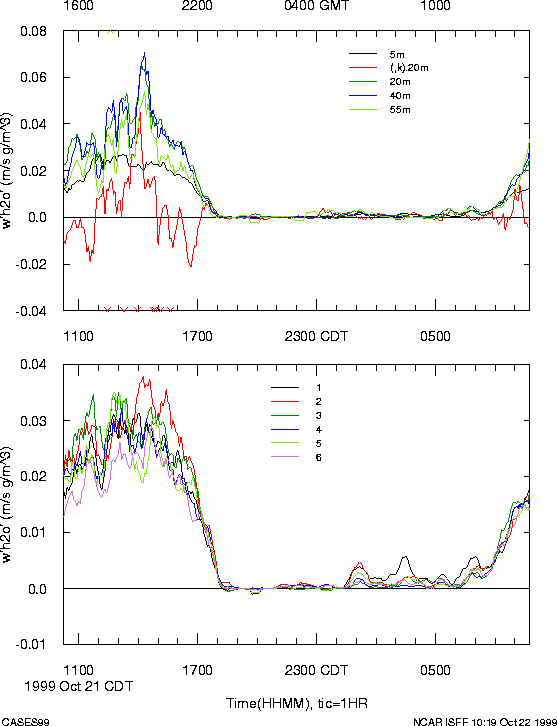
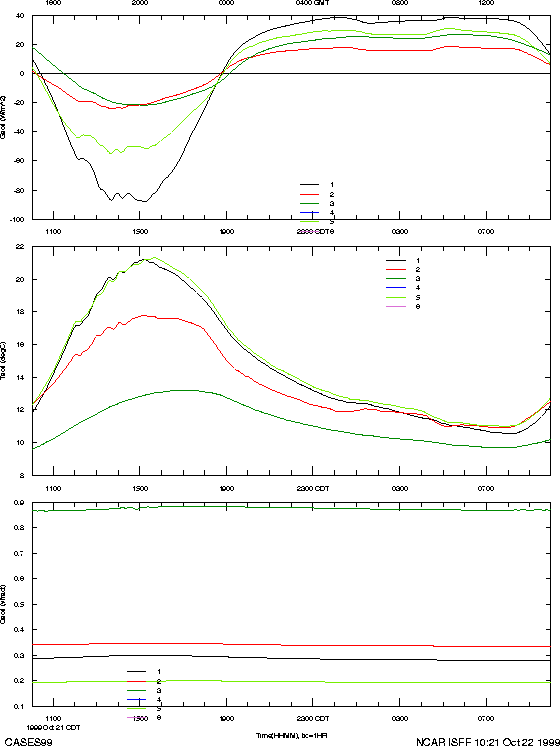
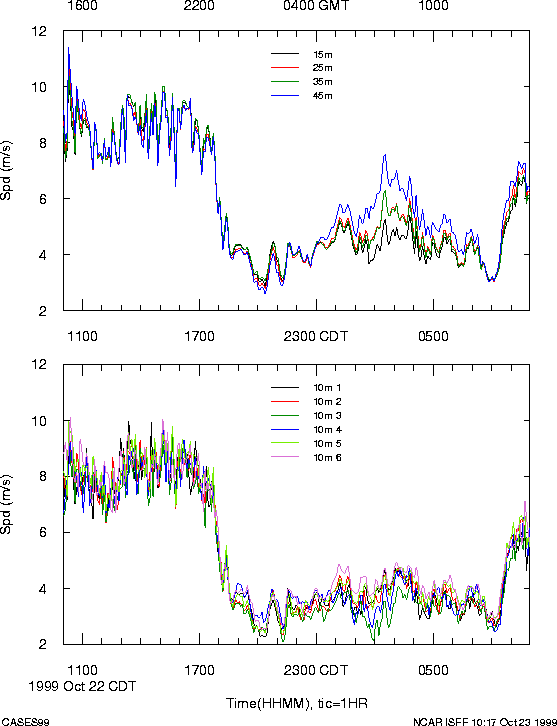
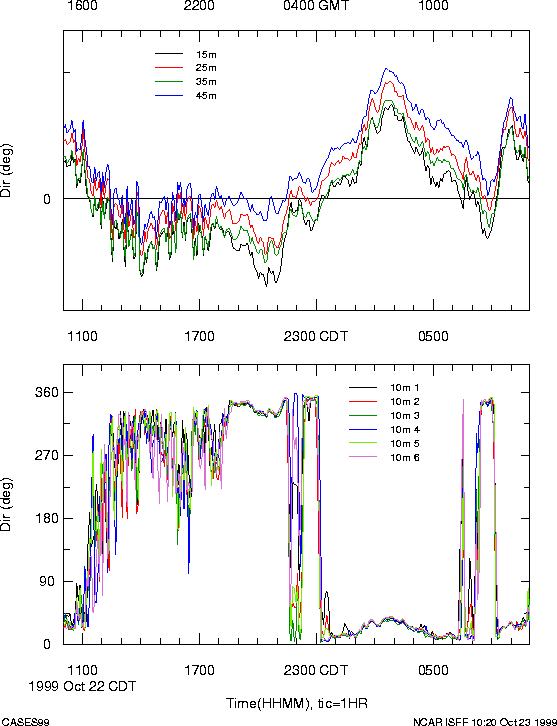
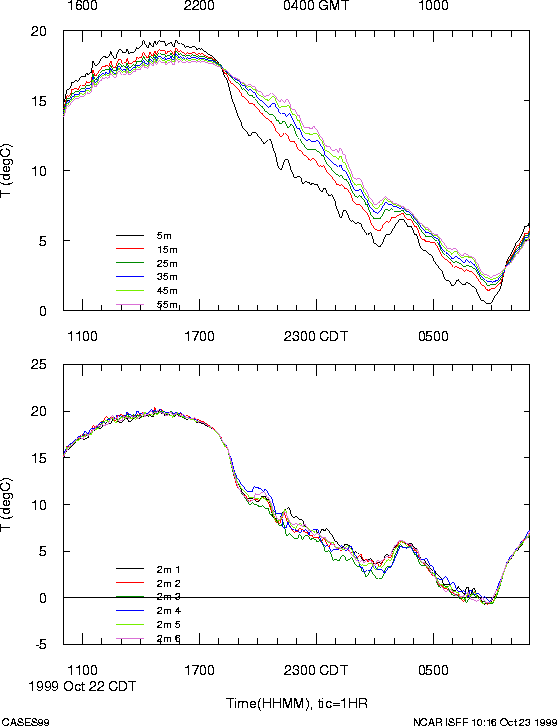
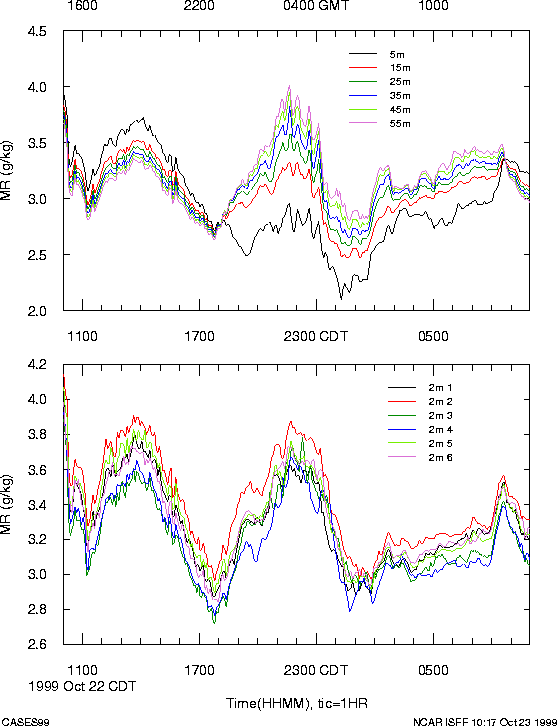
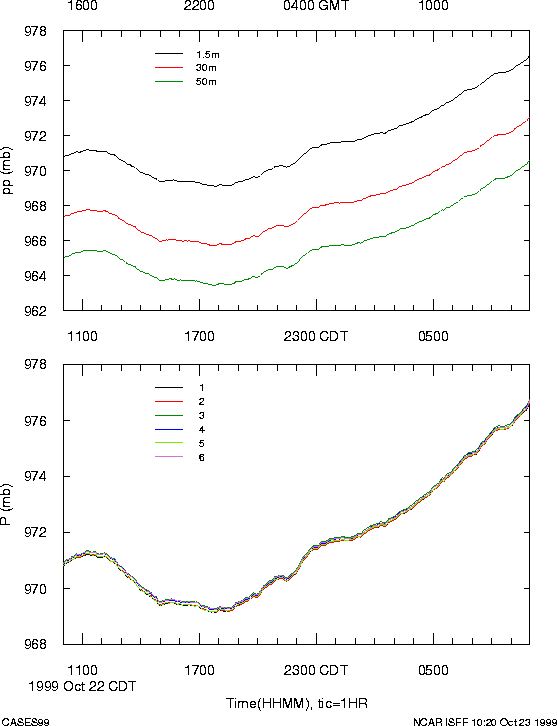
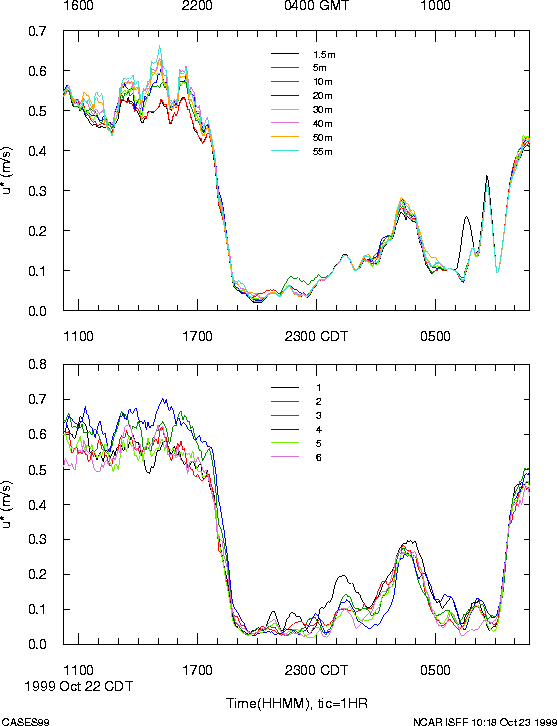
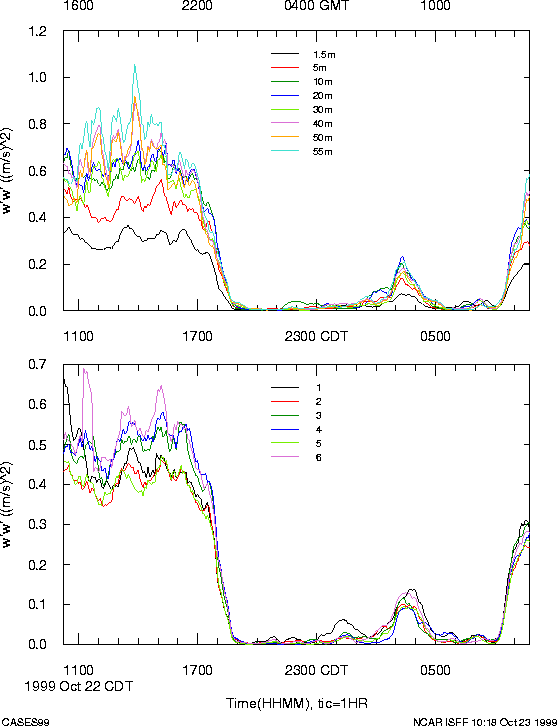
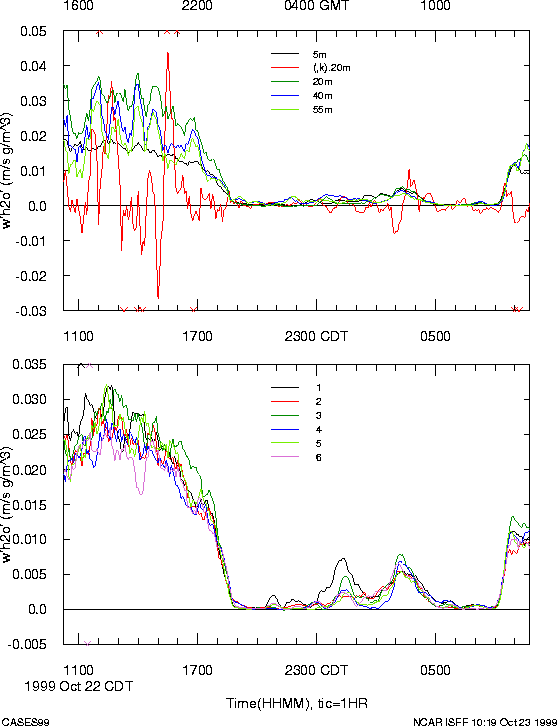
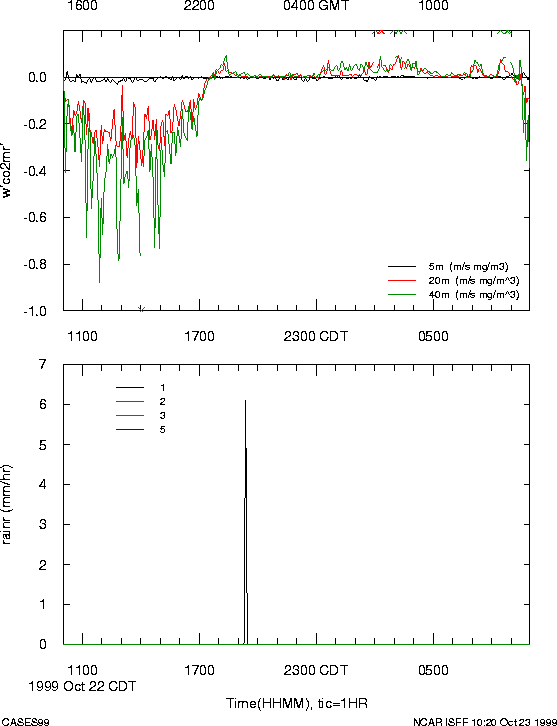
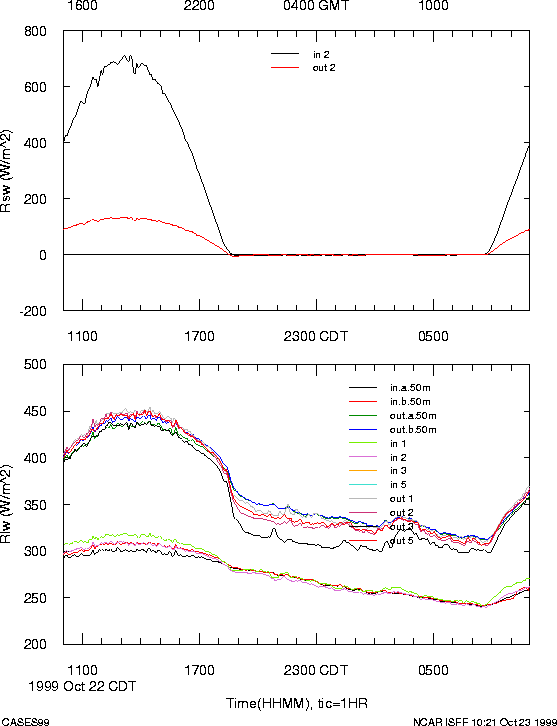
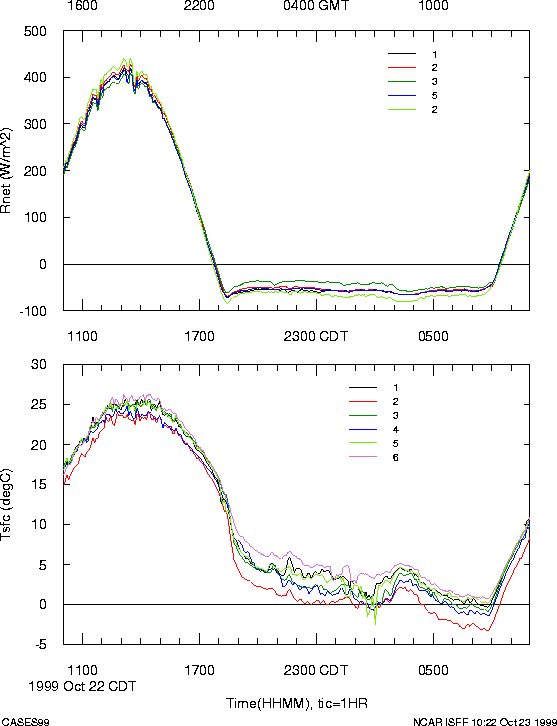
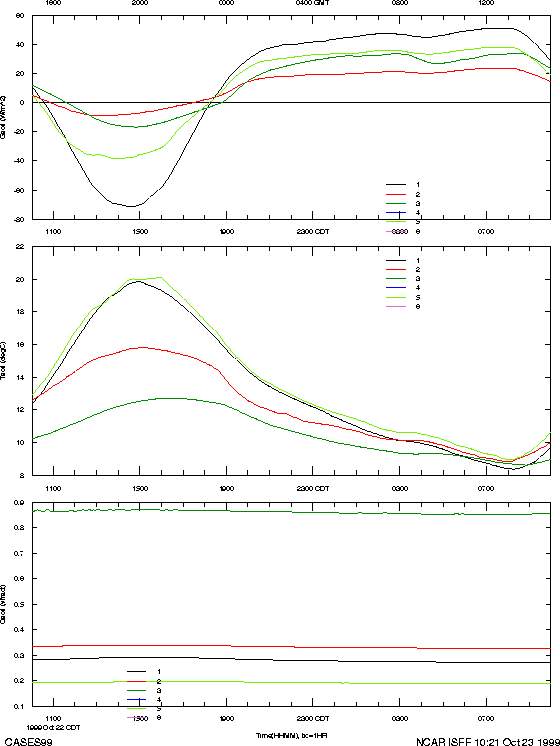
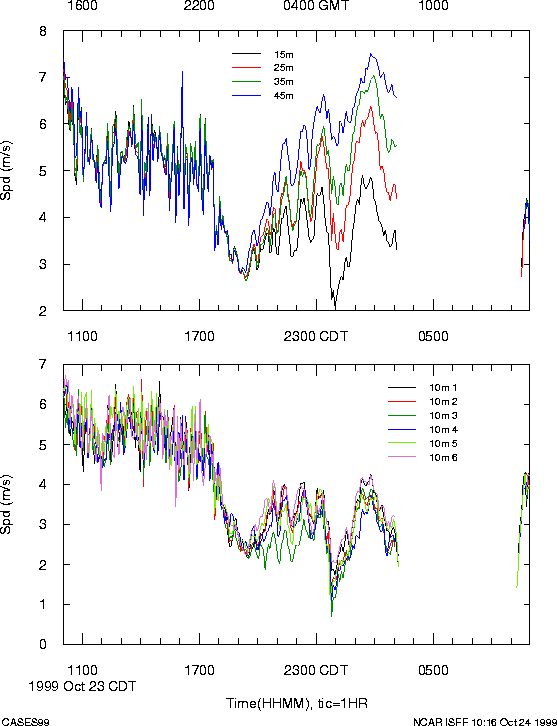
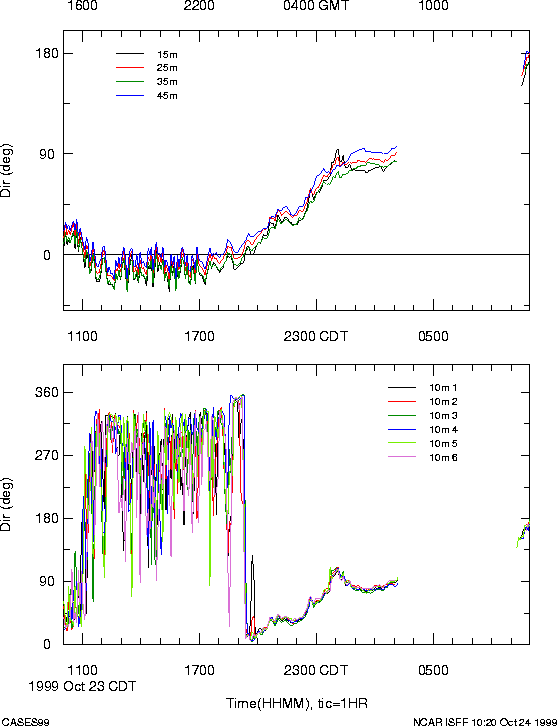
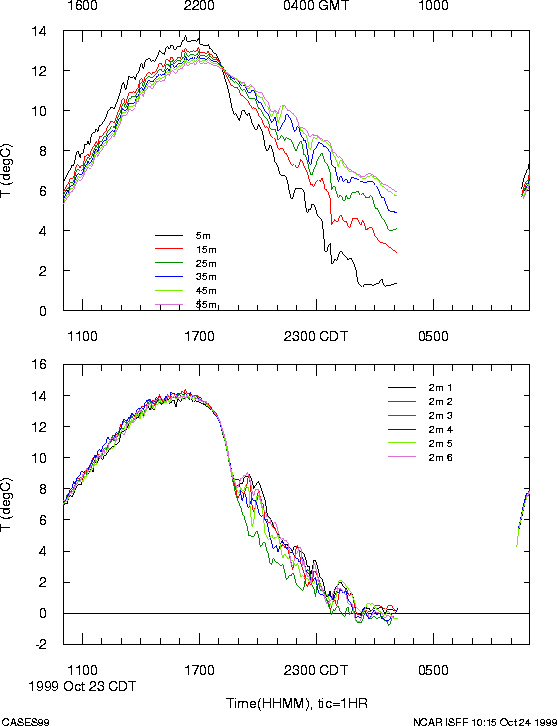
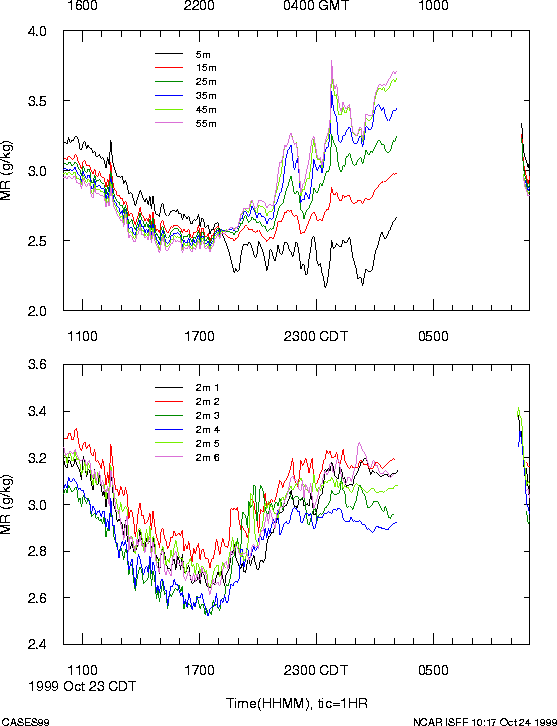
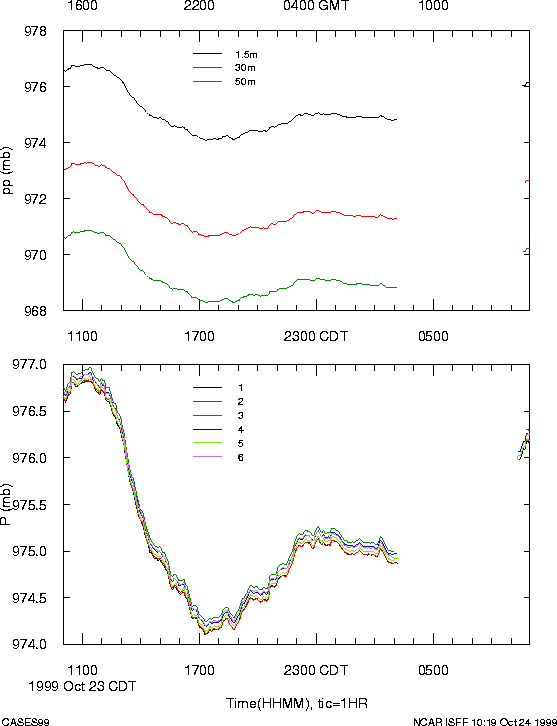
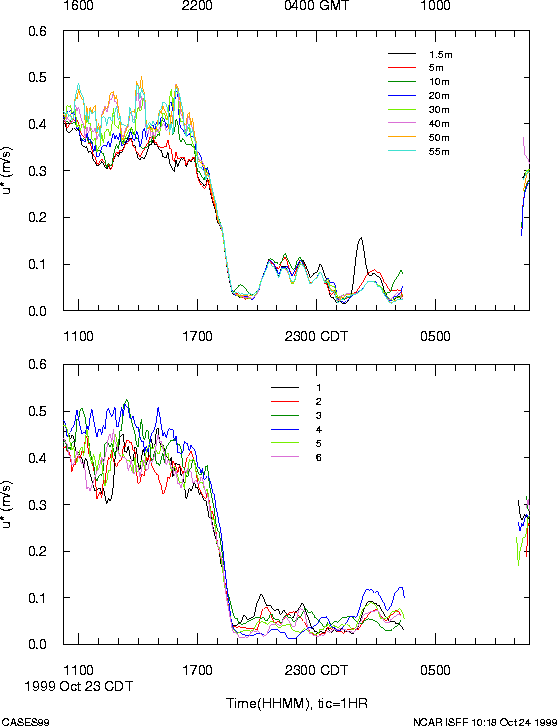
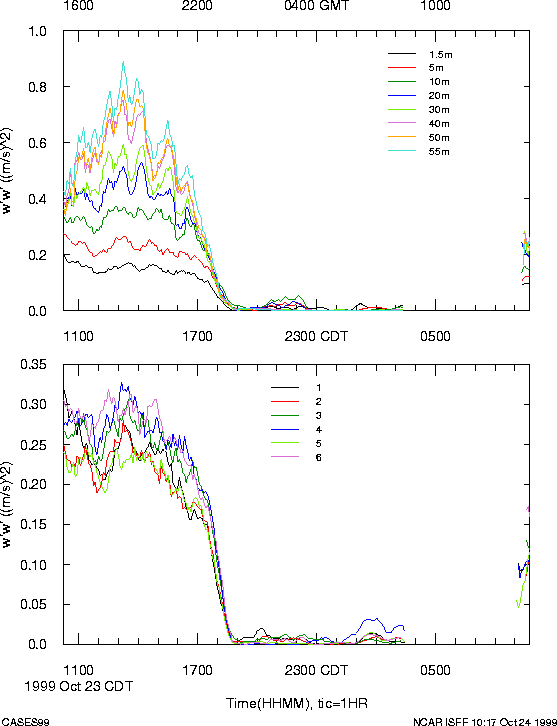
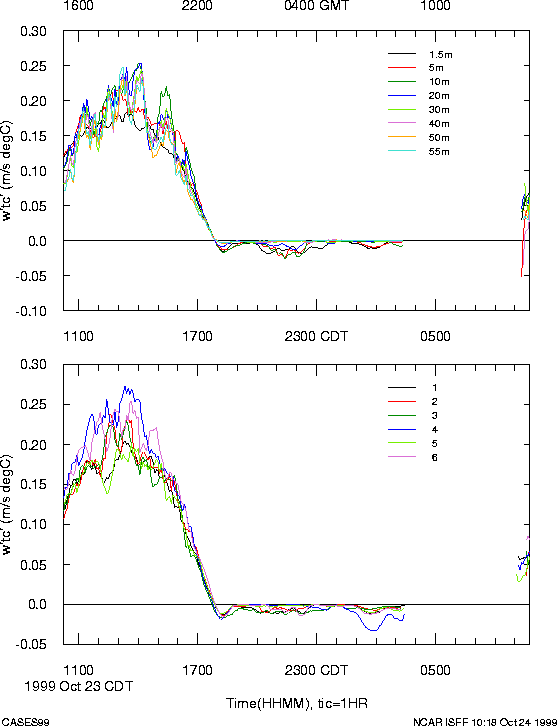
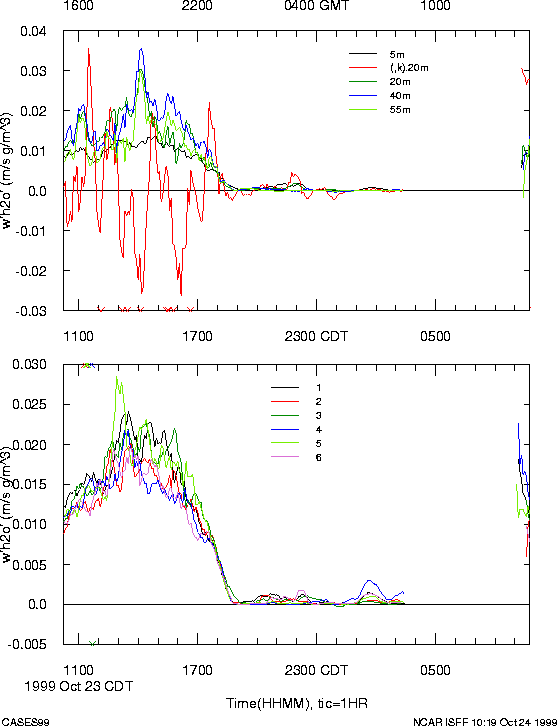
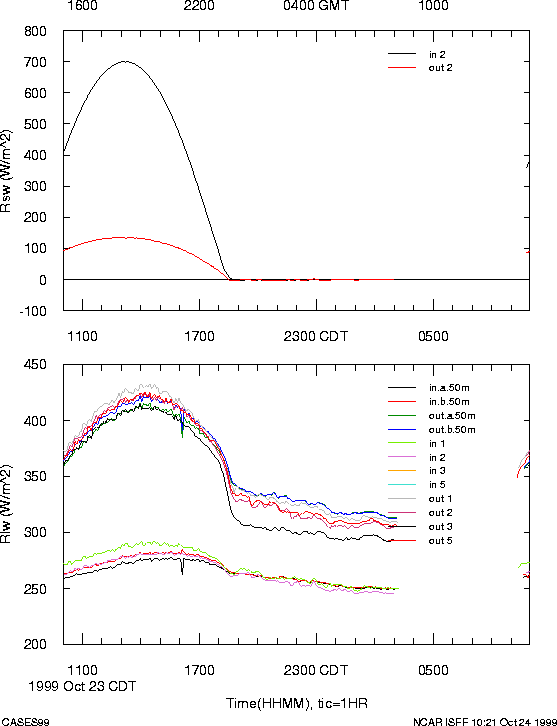
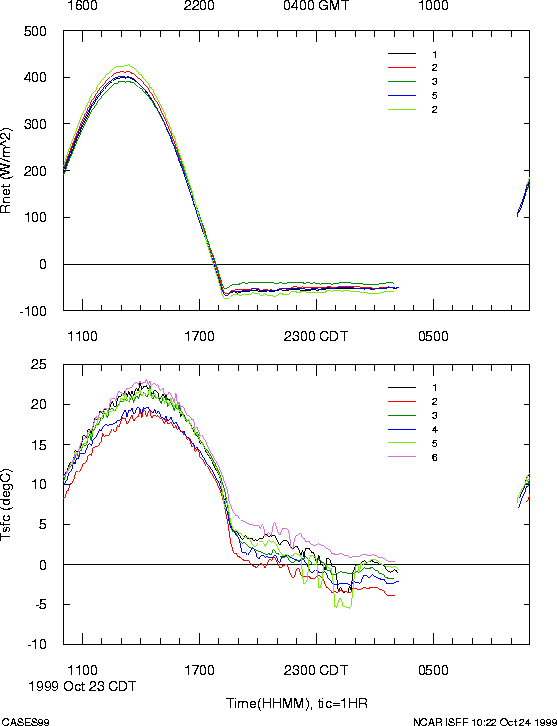
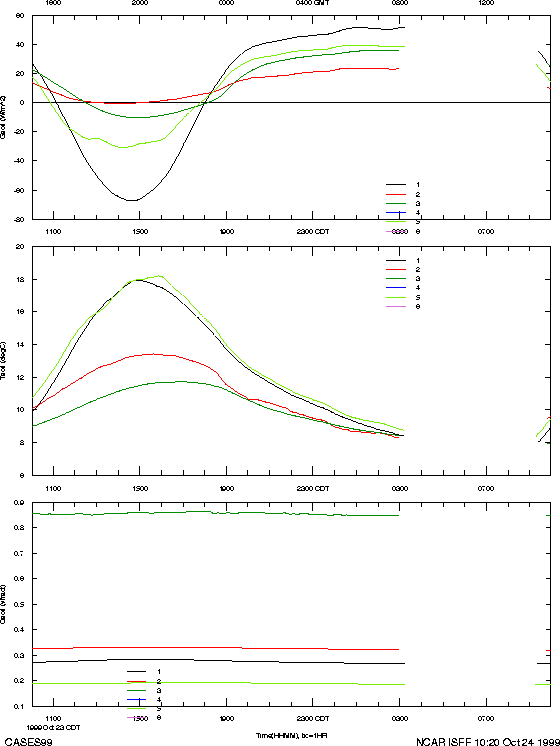
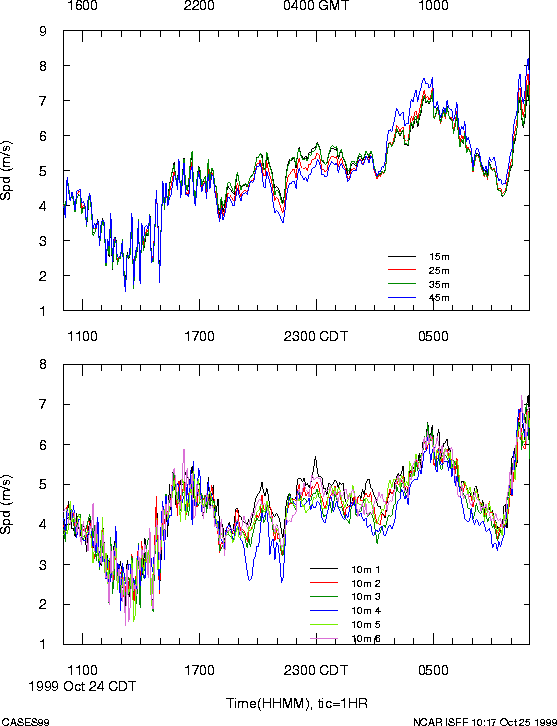
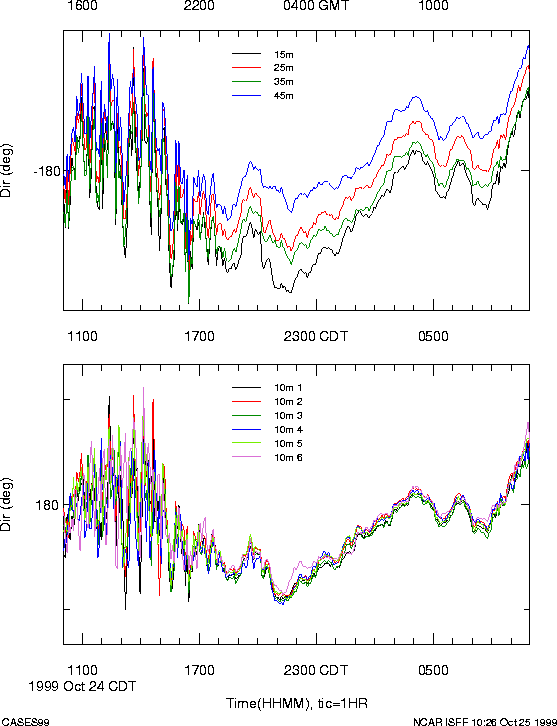
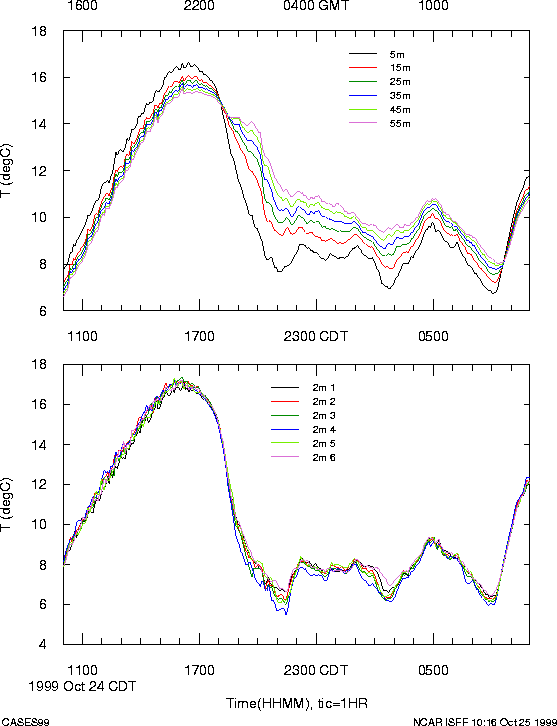
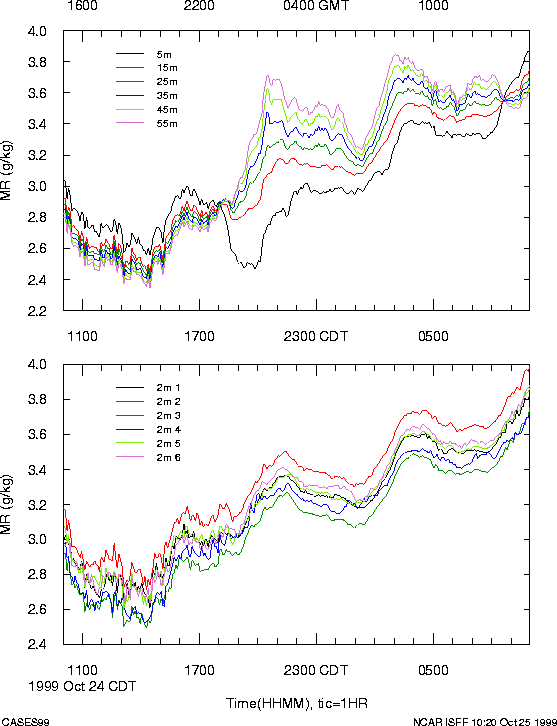
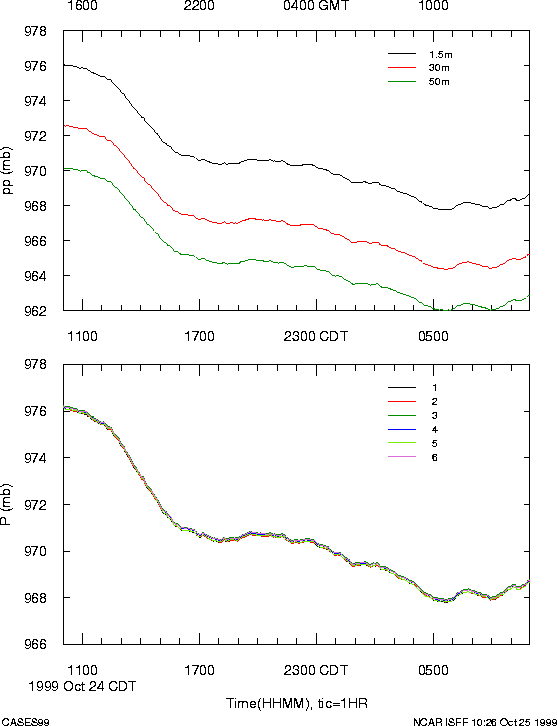
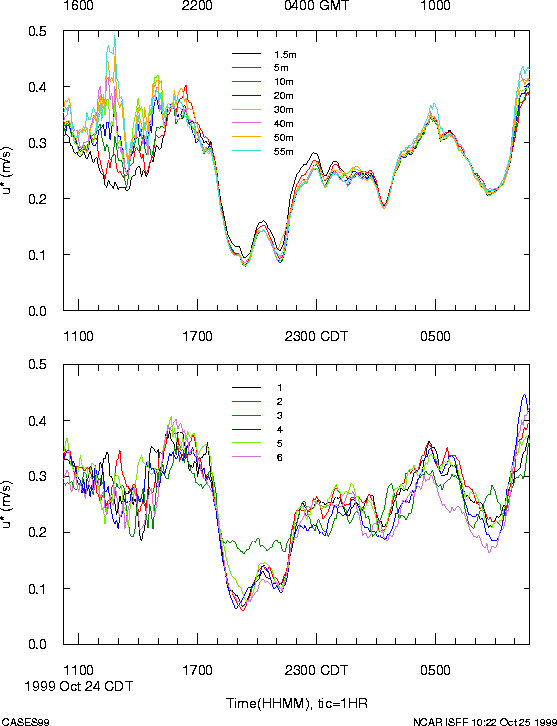
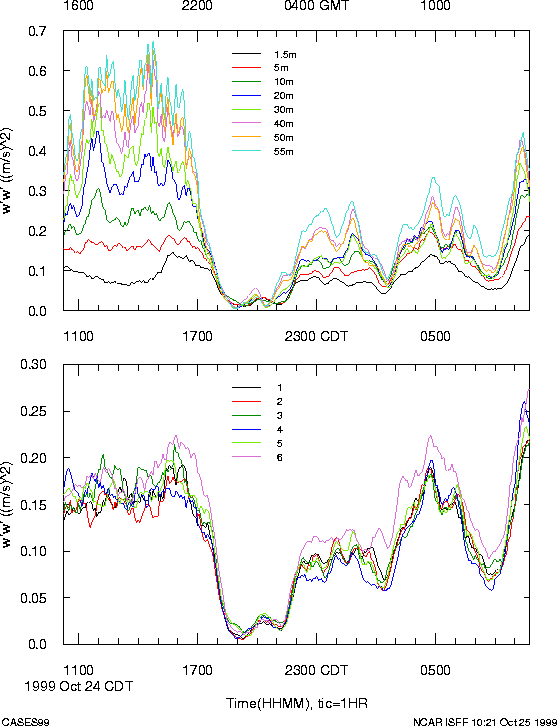
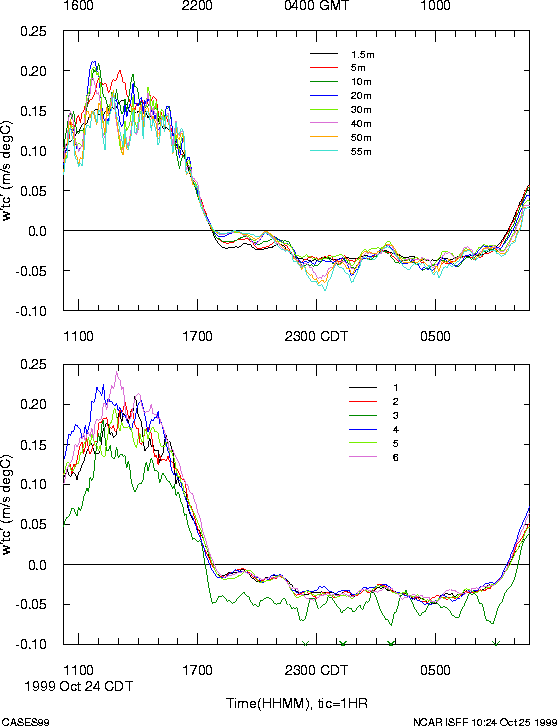
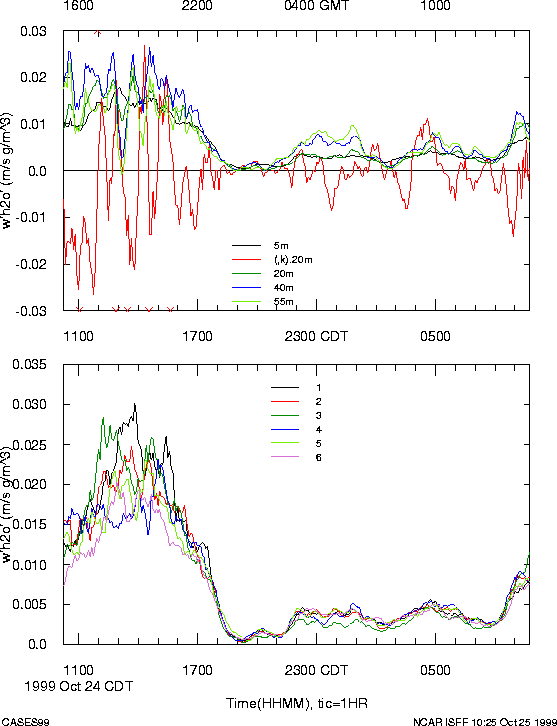
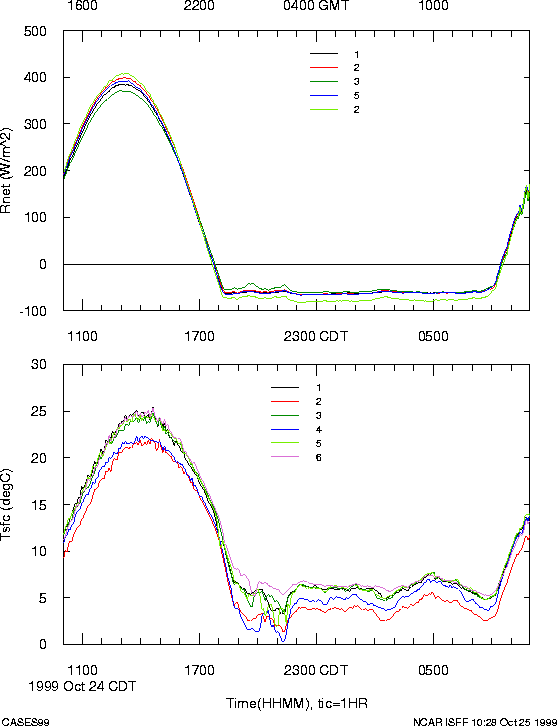
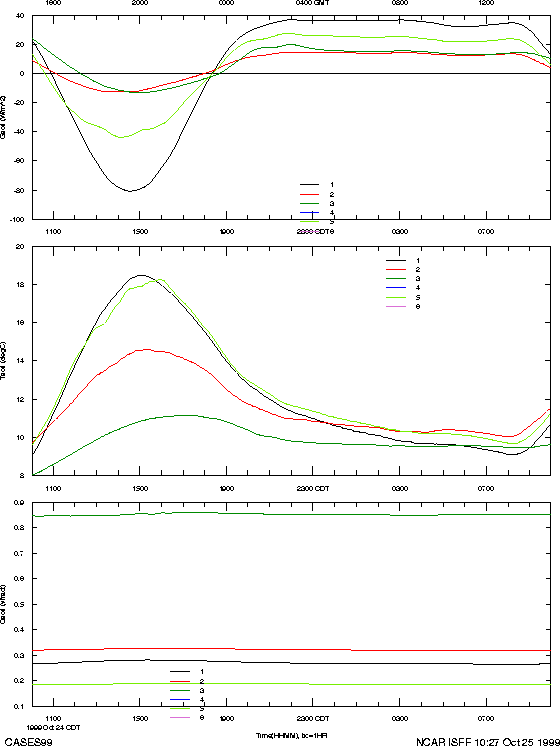
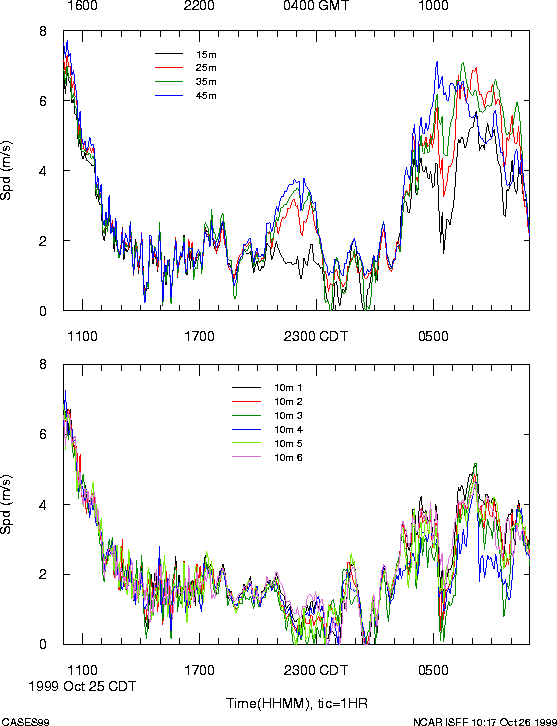
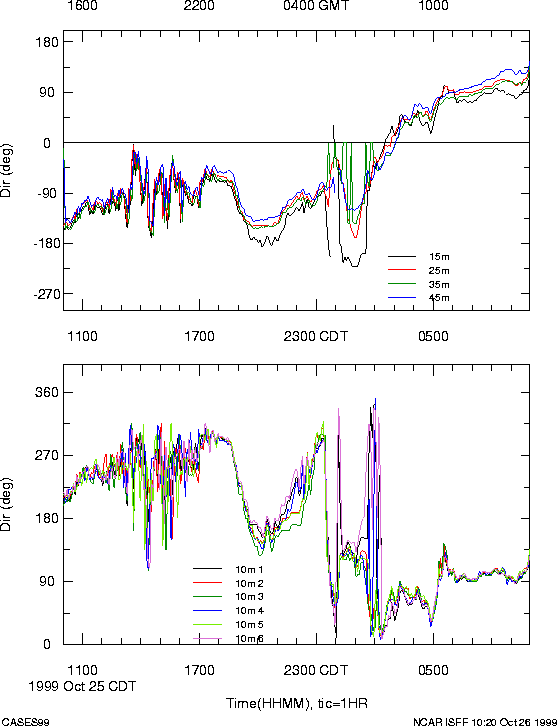
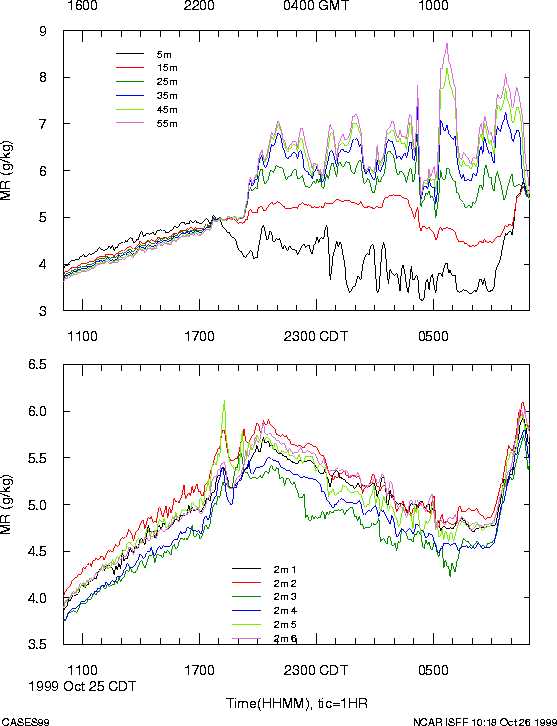
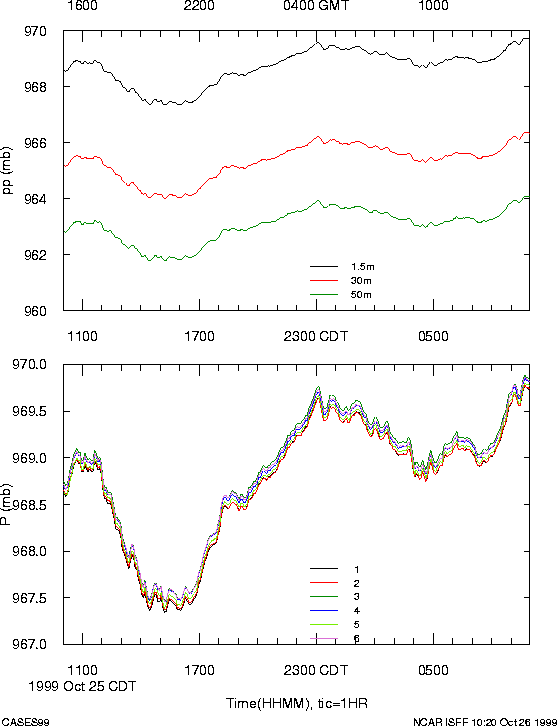
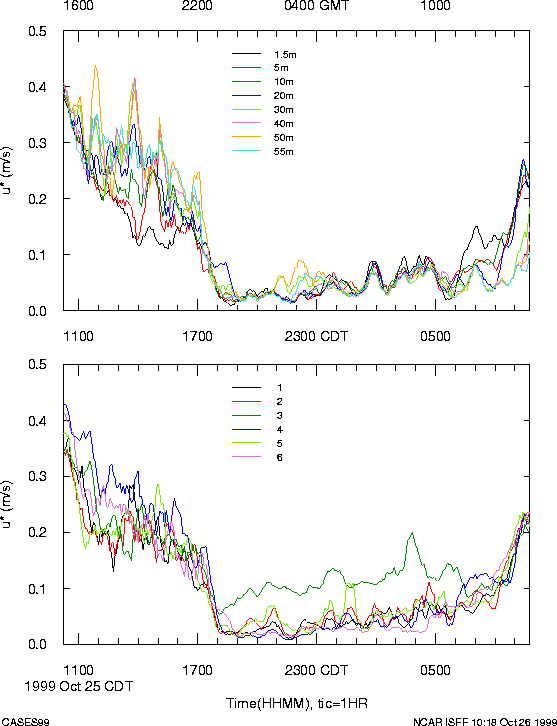
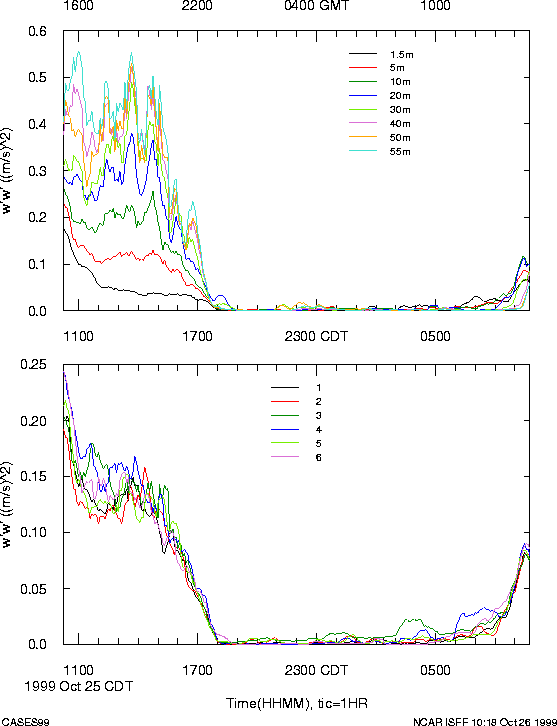
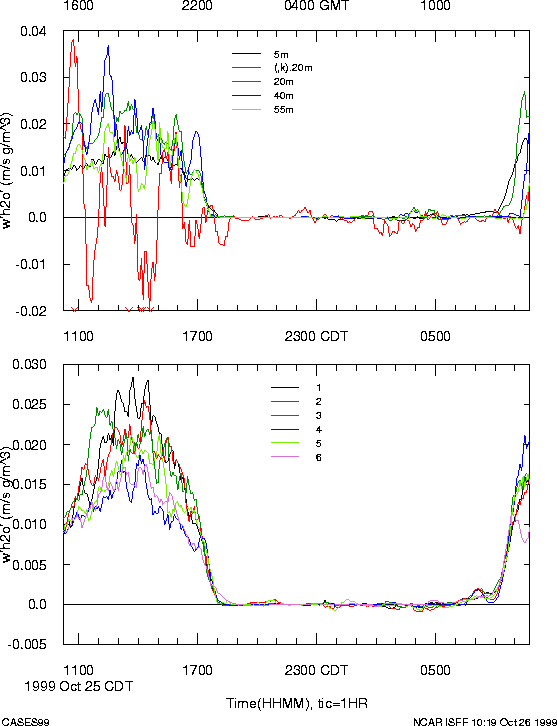
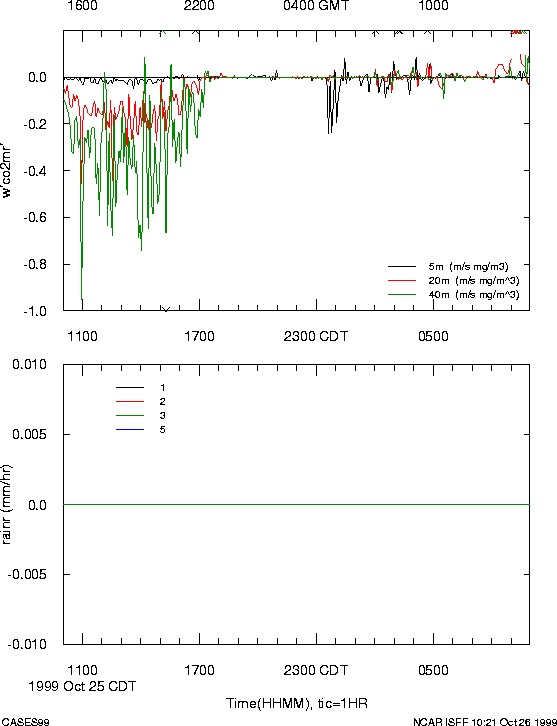
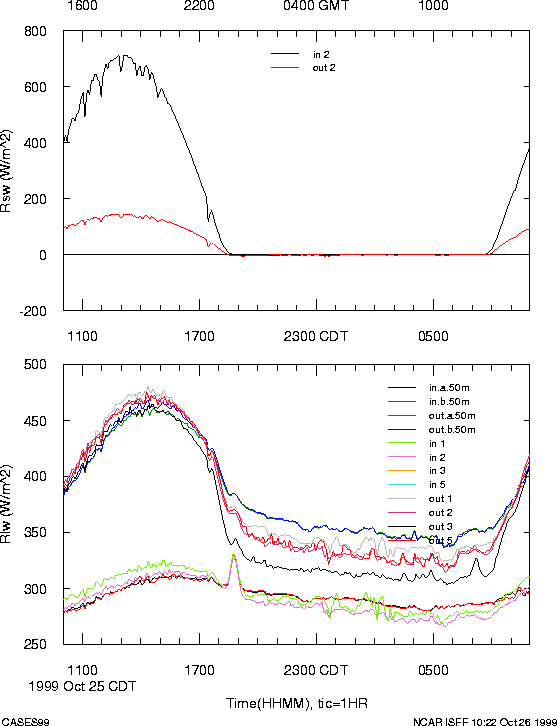
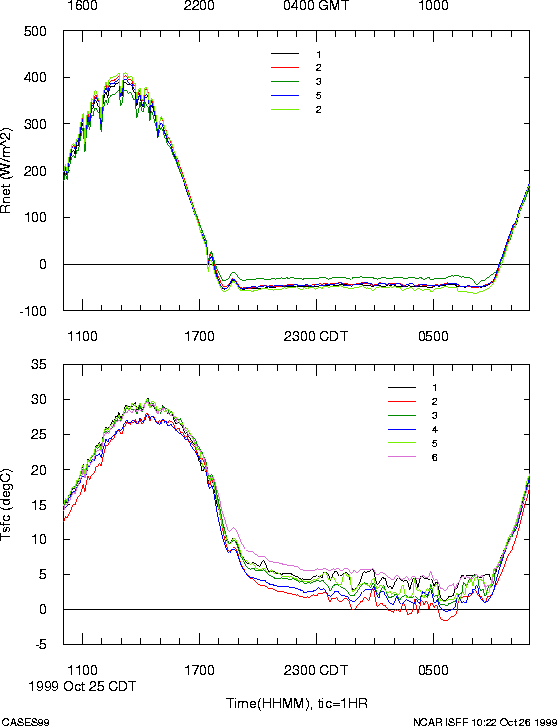
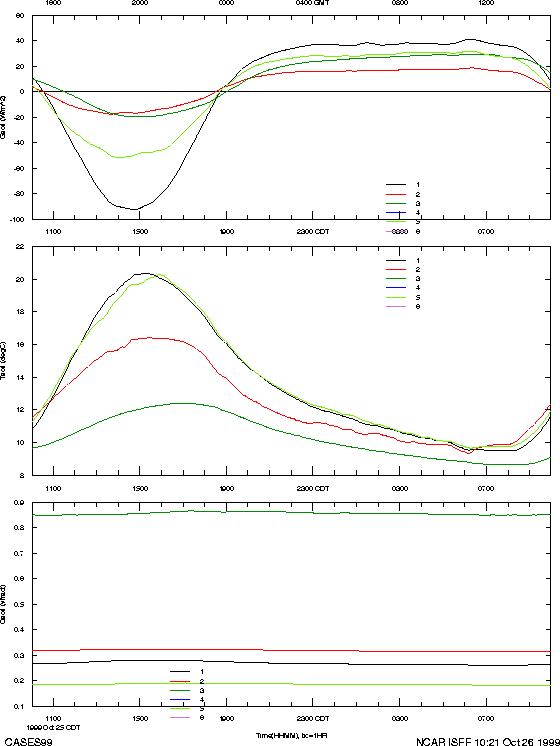
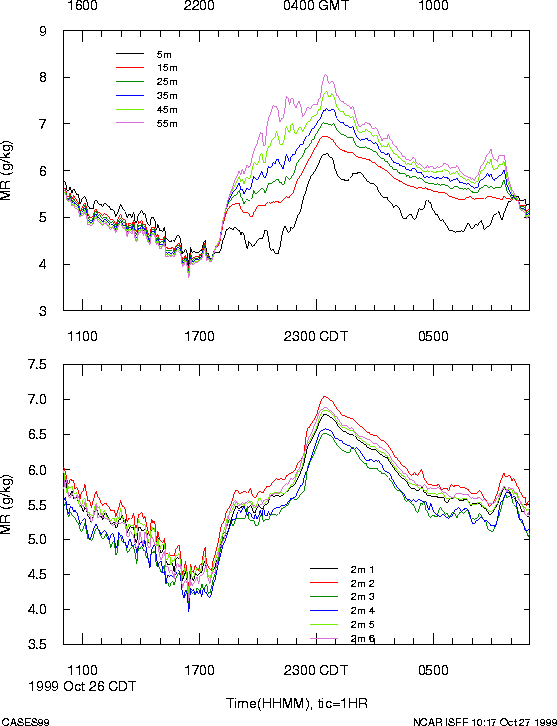
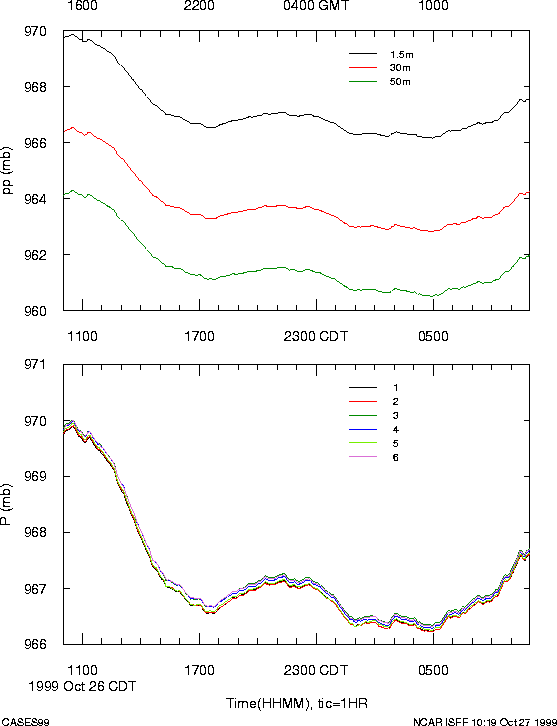
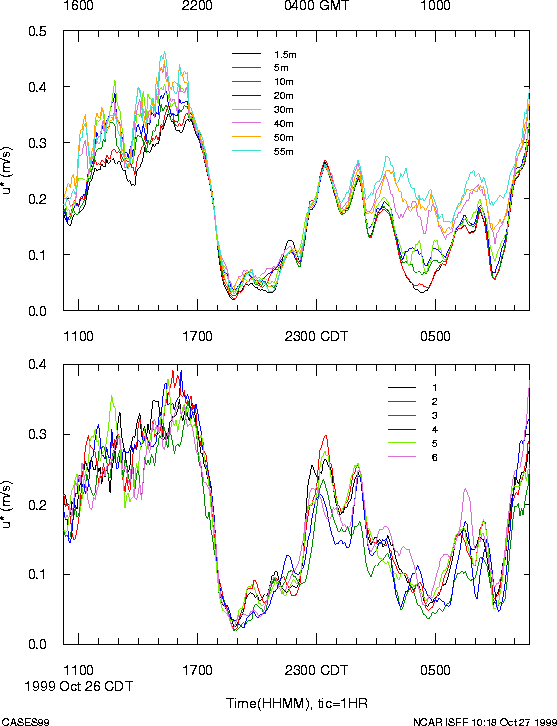
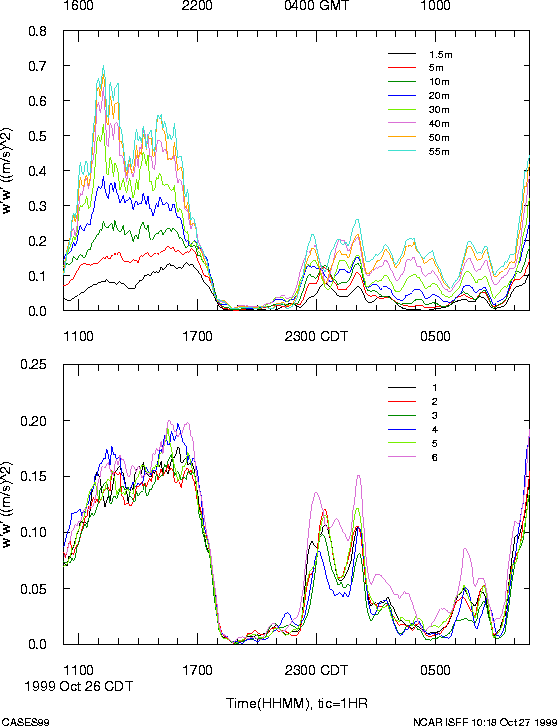
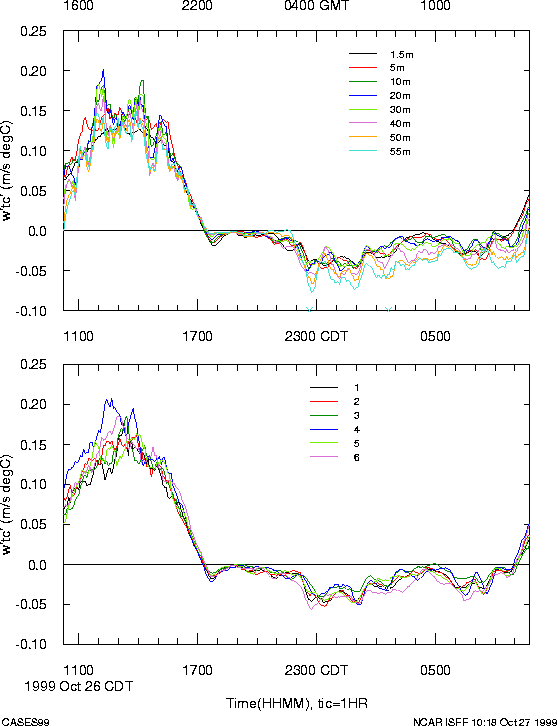
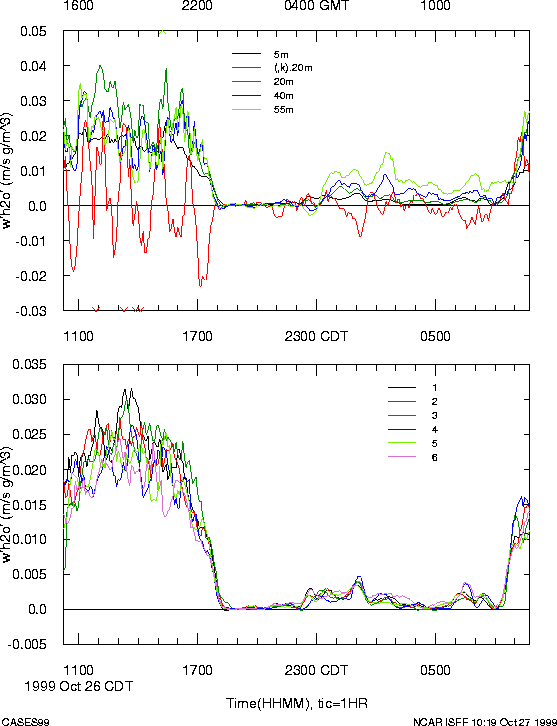
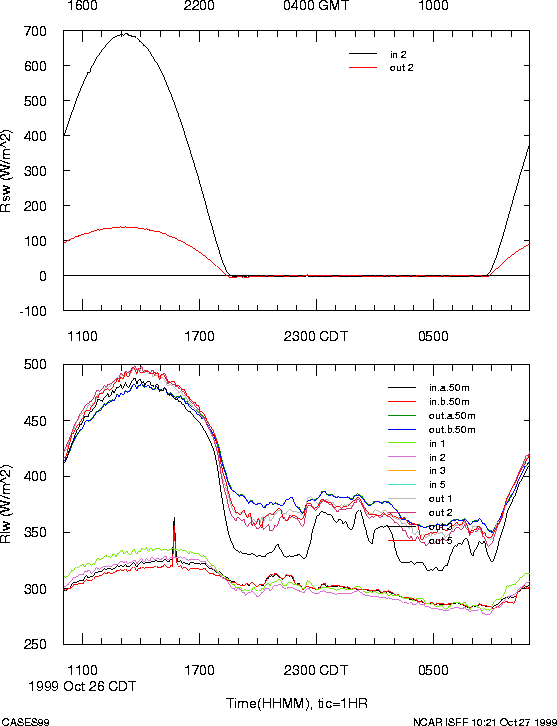
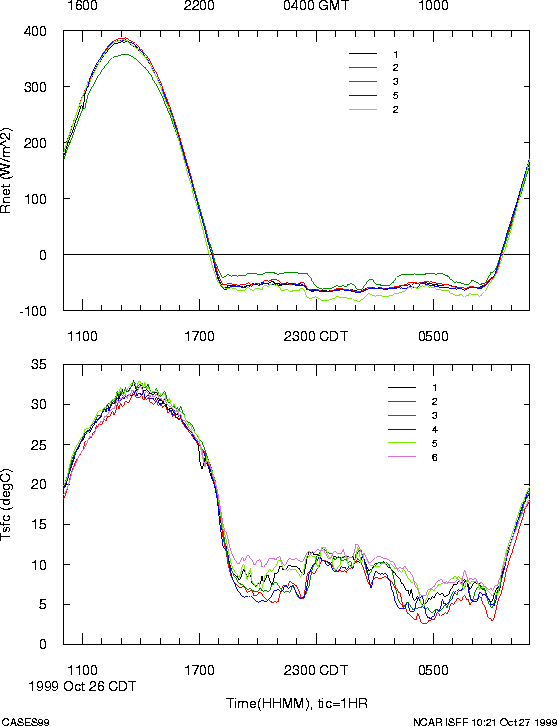
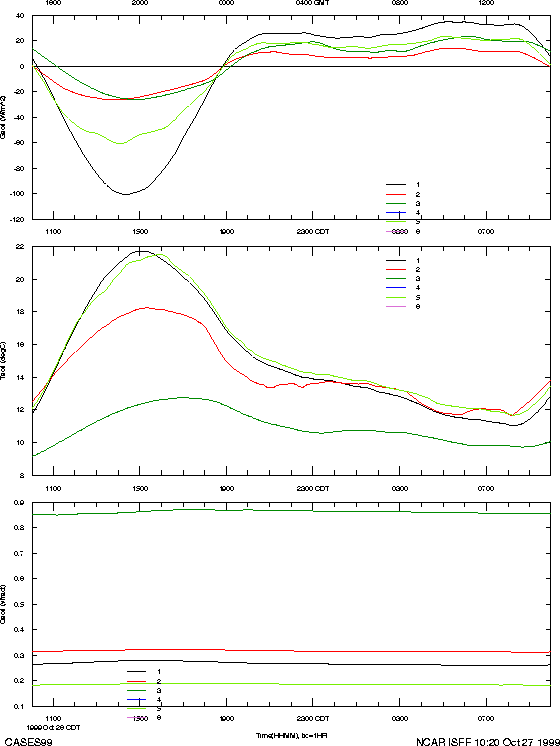
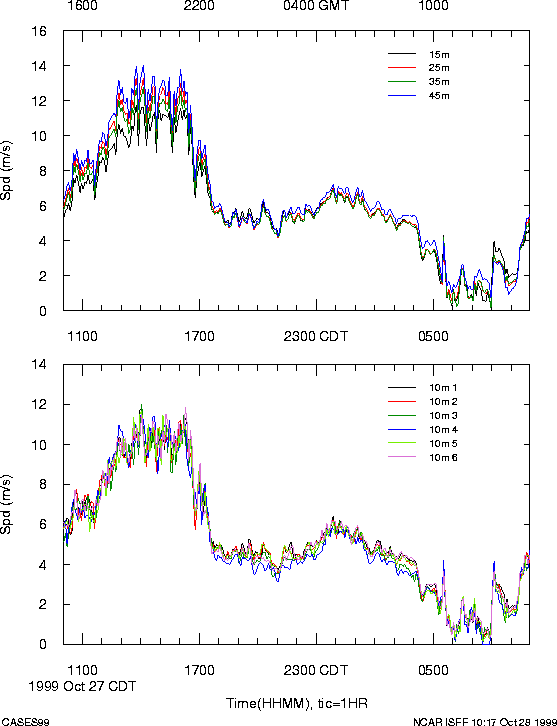
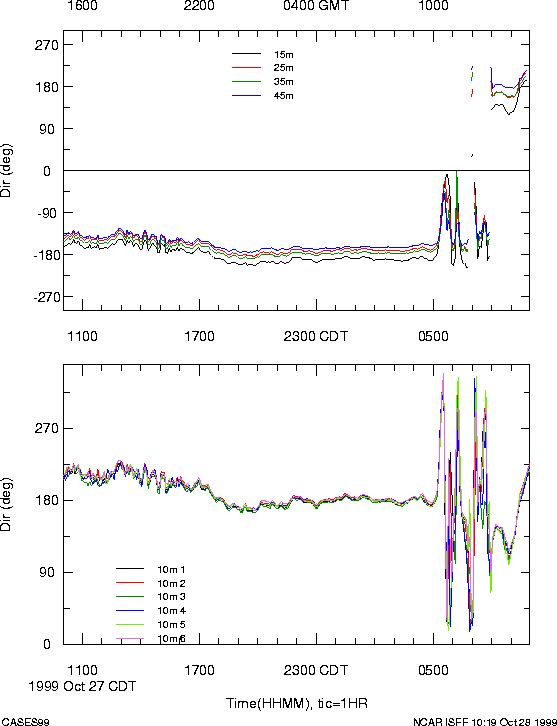
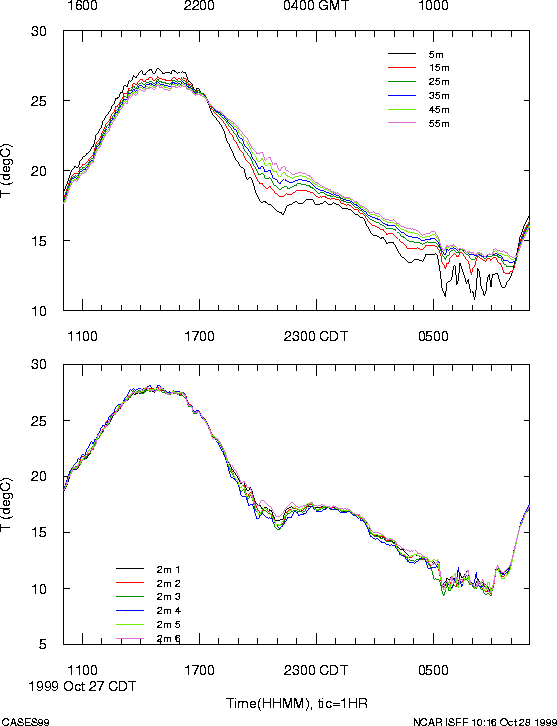
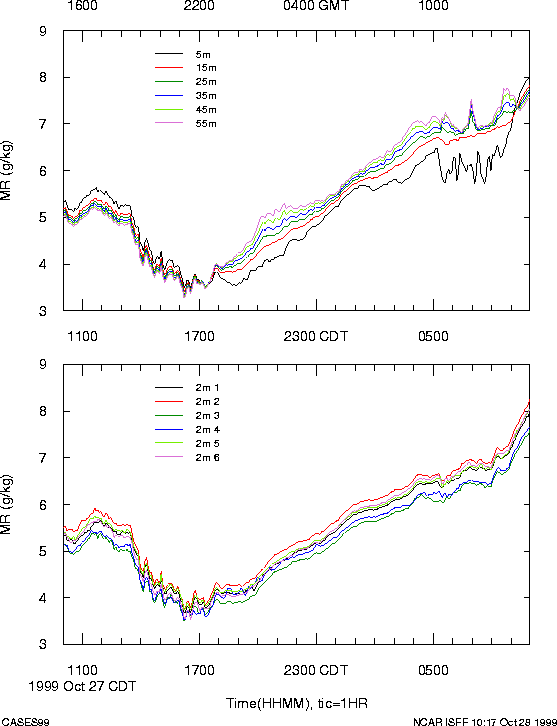
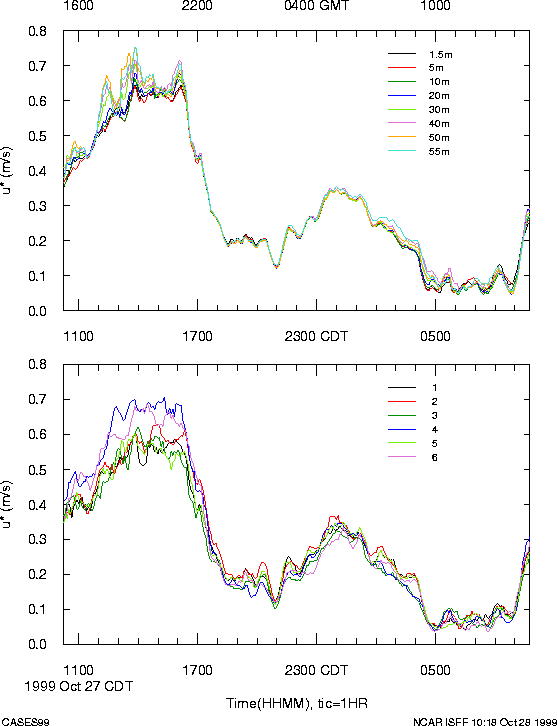
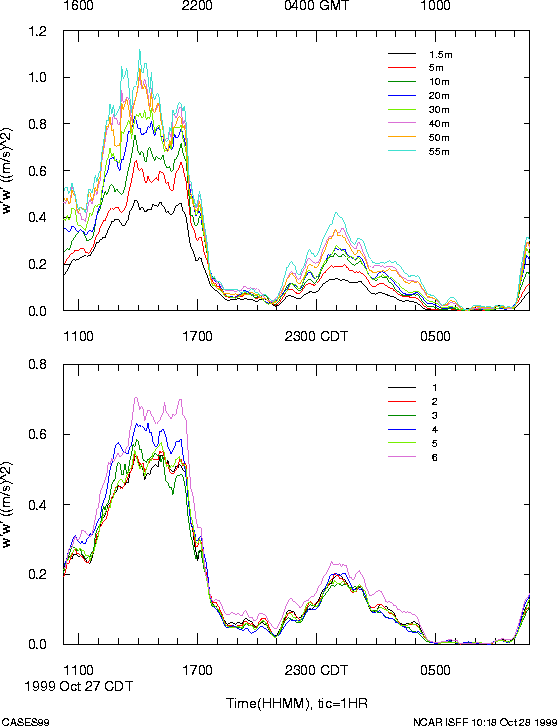
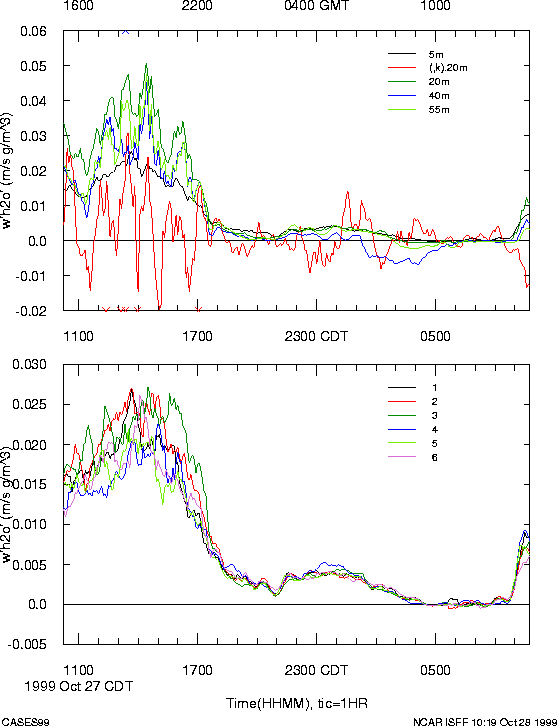
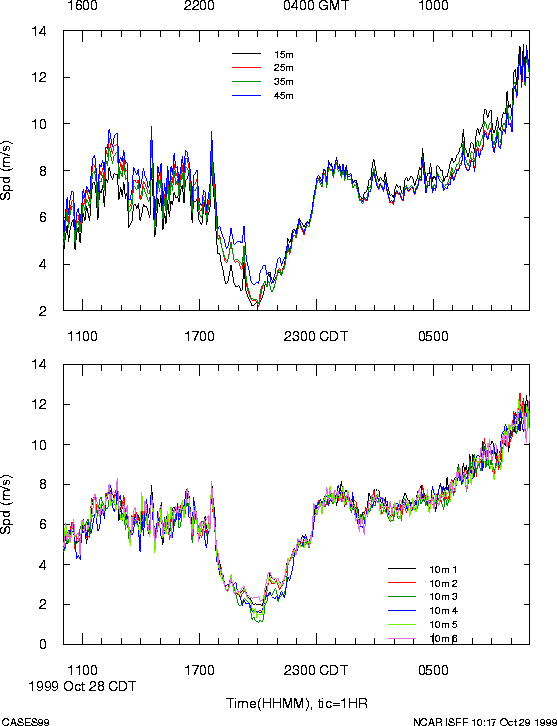
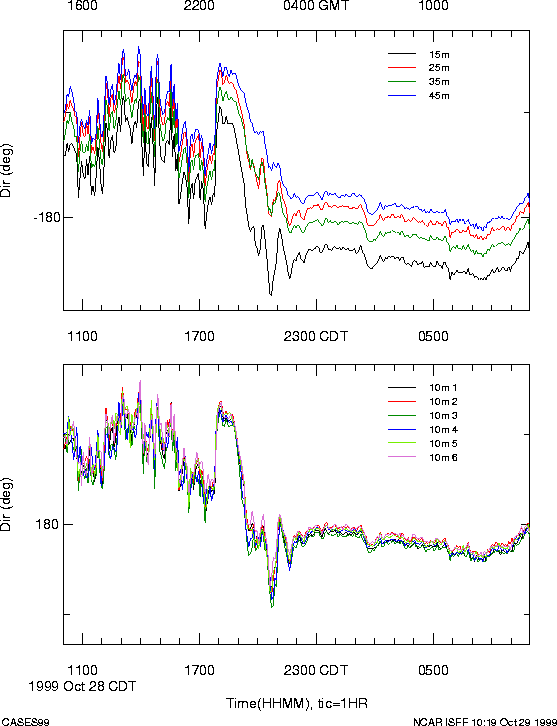
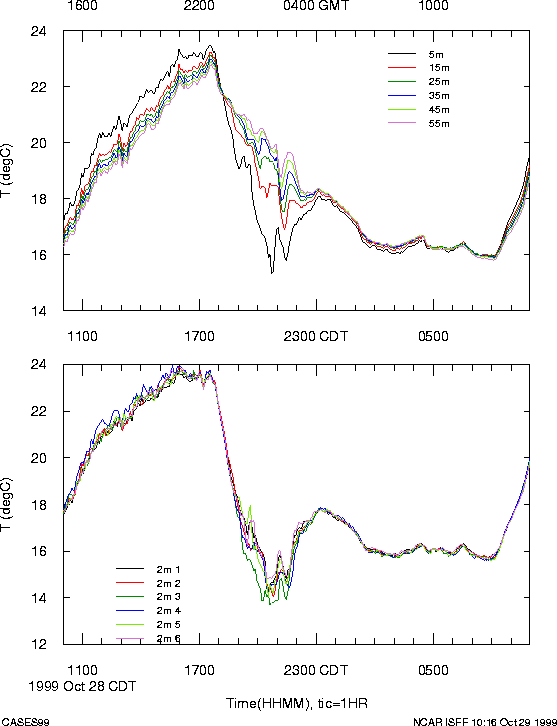
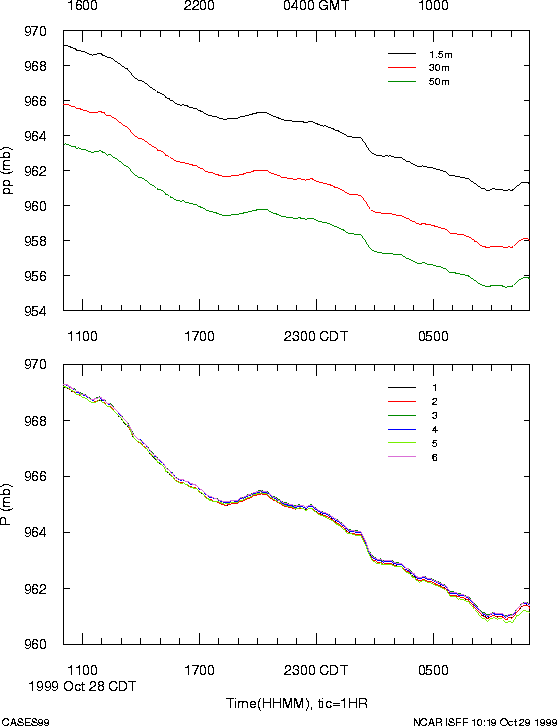
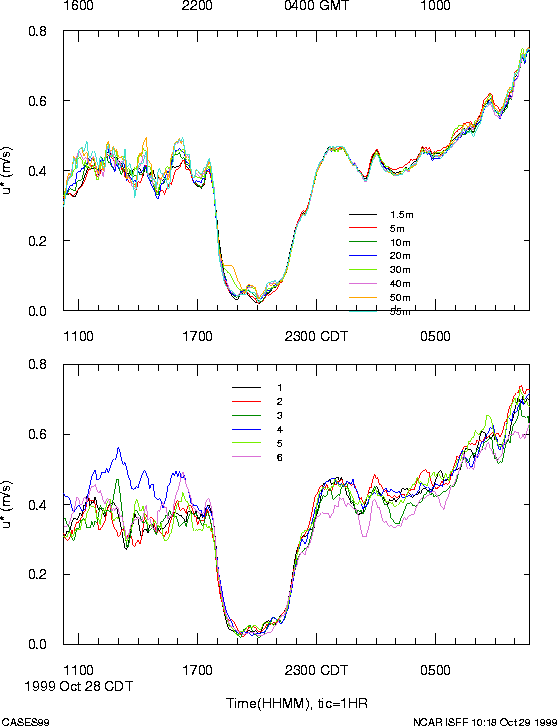
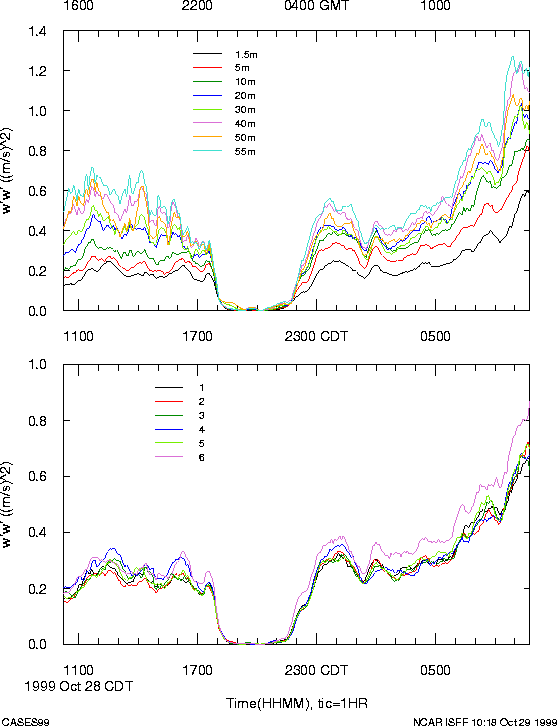
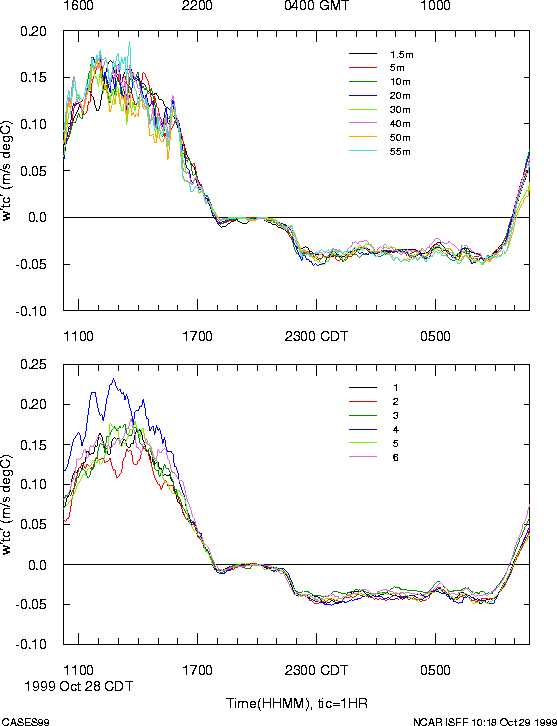
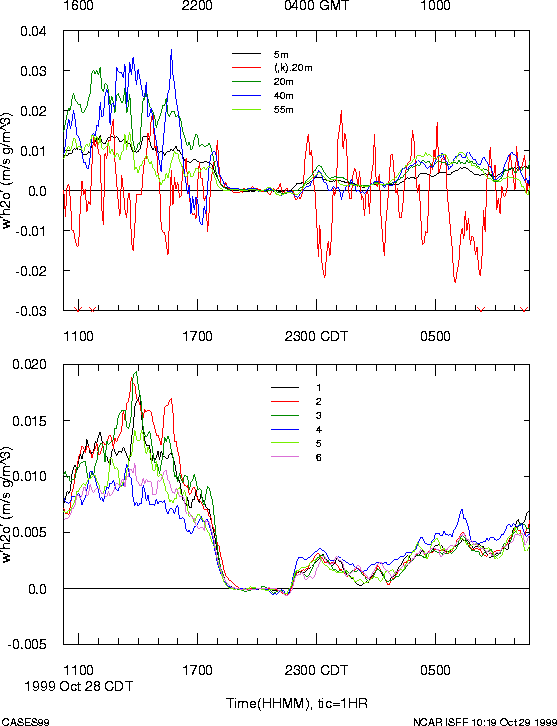
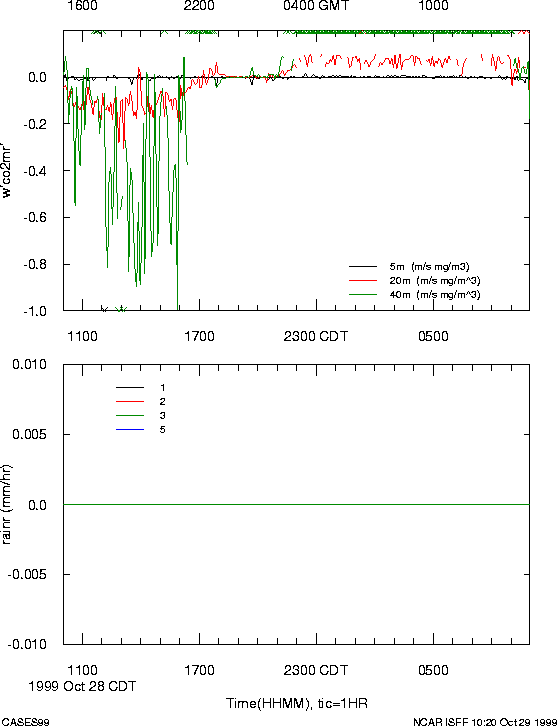
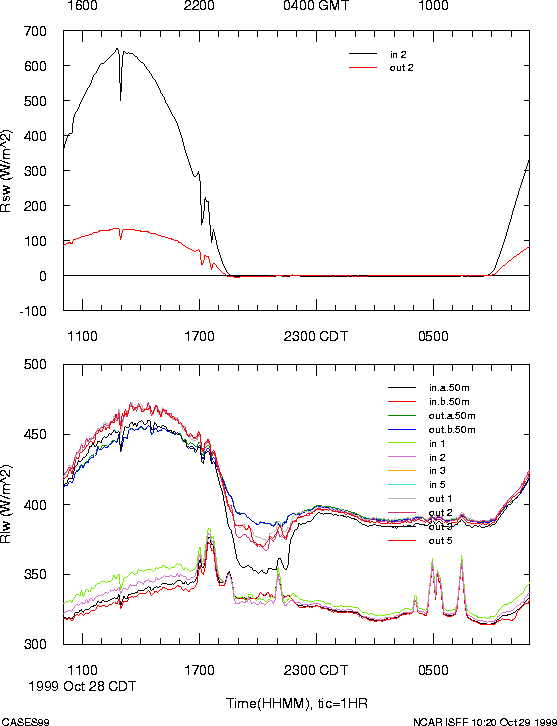
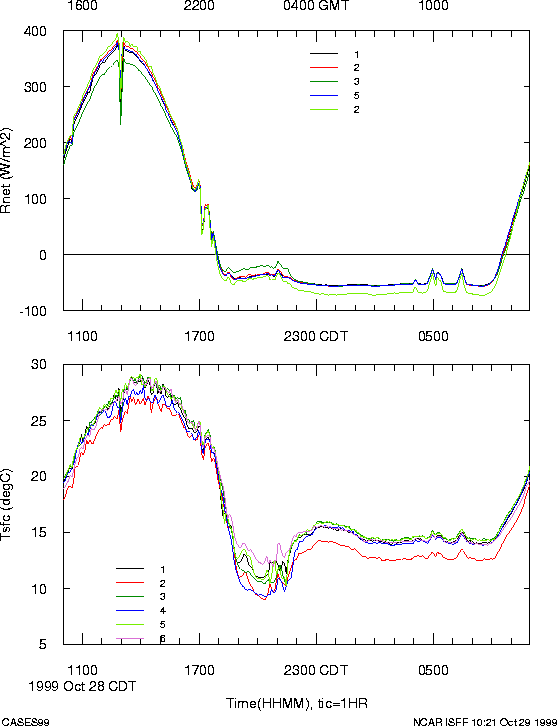
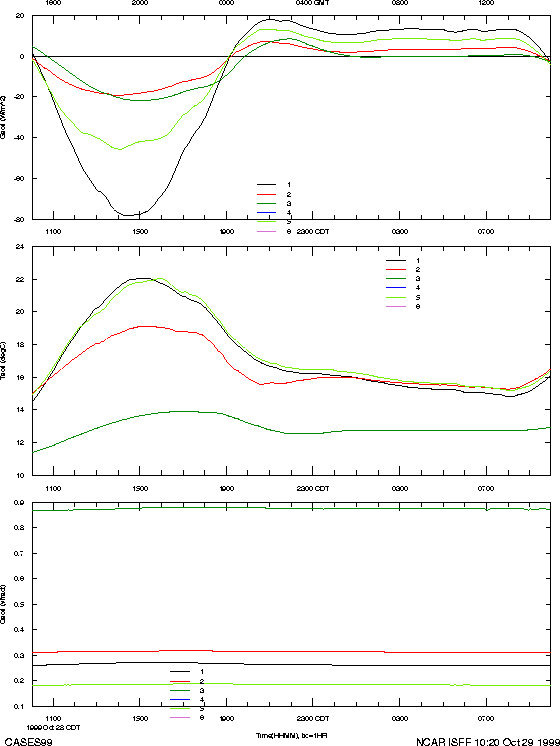
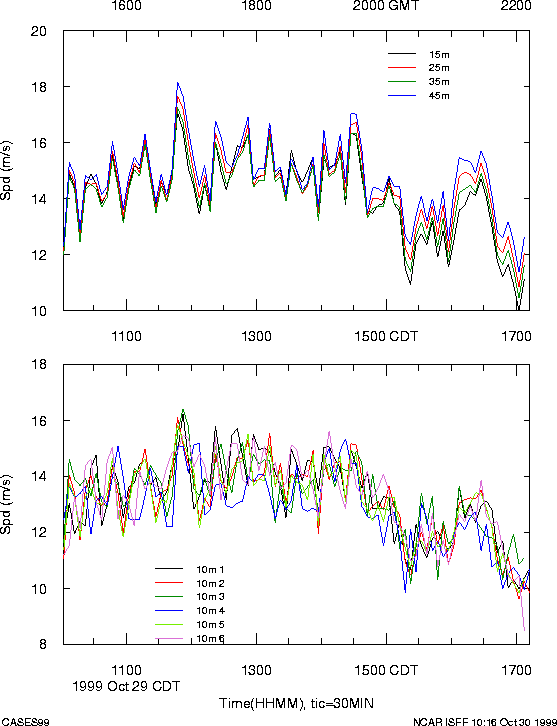
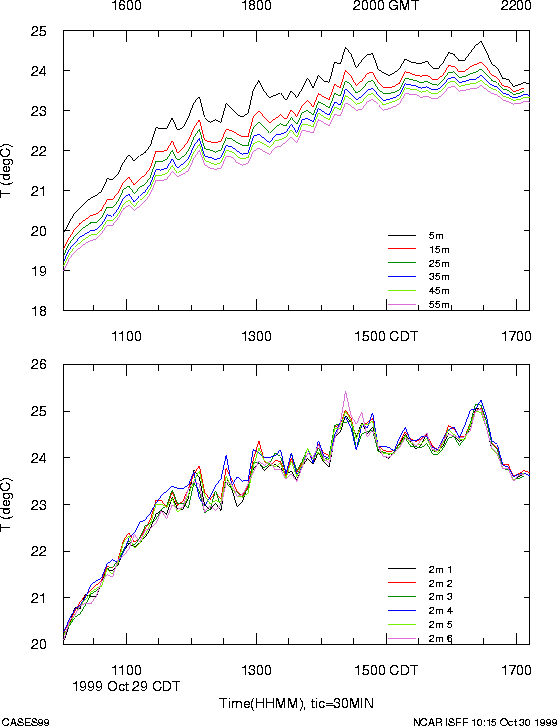
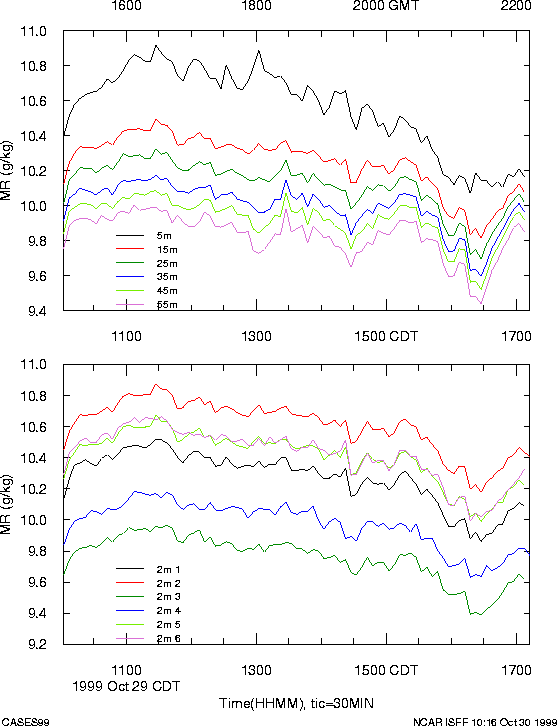
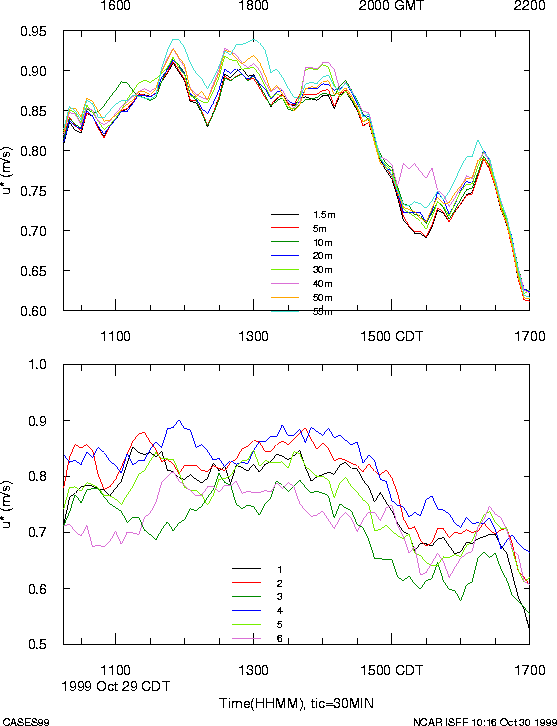
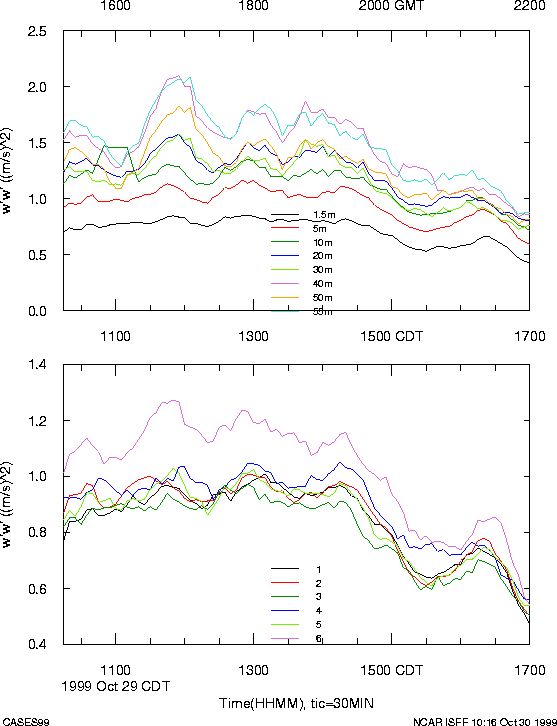
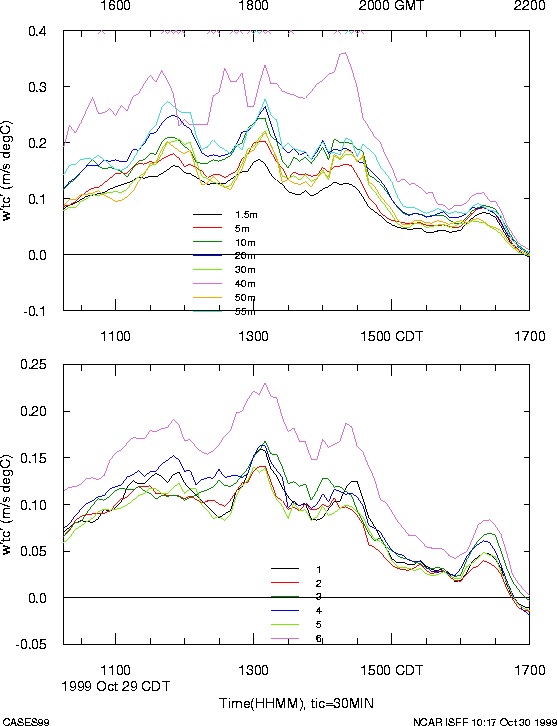
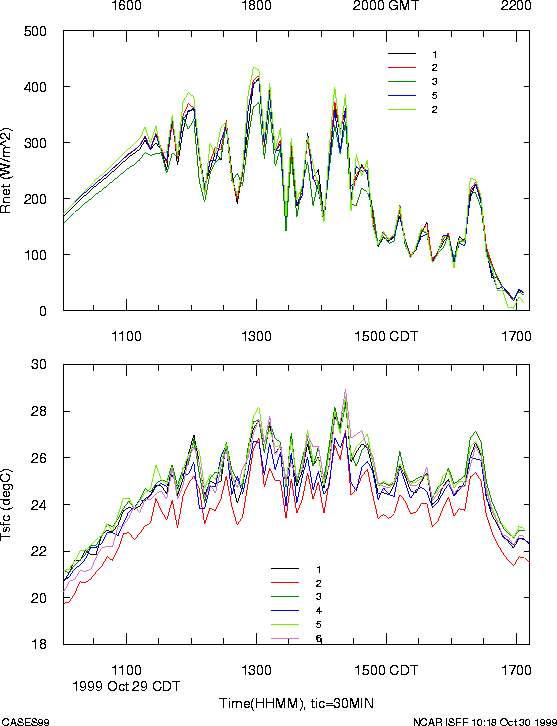
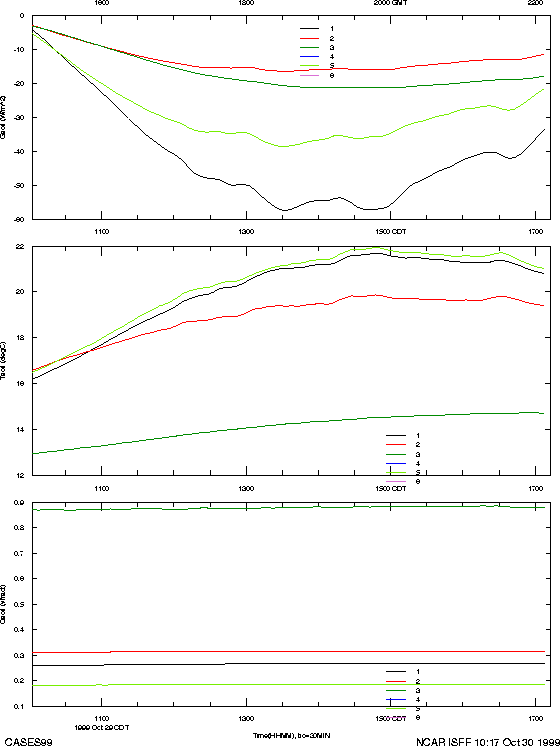
Daily Weather Plots
Click on the following to obtain once/day plots for several important measured variables. Most plots have 2 frames, with the top frame representing the measurements made on the 55m tower and the bottom frame those from the 10m towers. Each plot represents 24 hours of data, beginning and ending at 10am CDT. Please read the scales carefully for more details.