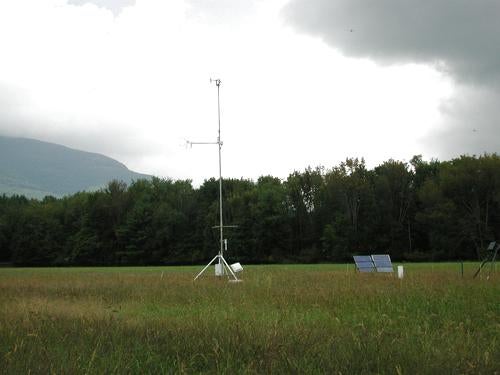
Station 7, Zena Cornfield, near Zena, New York
Introduction
This document describes the operation and measurements of the Integrated Surface Flux Facility (ISFF) during the Hudson Valley Ambient Meteorology Study (HVAMS) field experiment in 2003.
If you reached this page from a search engine, click here to see the full report, with frames.
Schedule
- Jul 7 - Sep 1, 2003
- Pre-project testing at NCAR.
- Sept 4 - Sept 11
- Setup of stations in Hudson Valley.
- Sept 15 - Oct 31
- Operations.
- Nov 1
- Tear down begins.
- Nov 4, 2003
- All stations removed.
Measurement Sites
Nine remote ISFF stations were deployed on both sides of the Hudson River along the stretch between Albany and Kingston, New York. This plot (prepared by SUNY) shows the ISFF stations as single numbers.
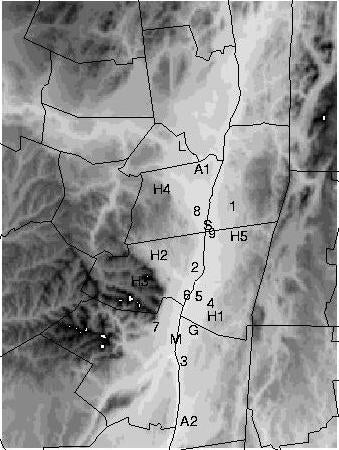
Table of Sites
| Station# | Name | Latitude (deg min N) |
Longitude (deg min W) |
Elevation (m) |
Environment | Radiometers | User Sensors |
|---|---|---|---|---|---|---|---|
| 1 | Alexander Farm | 42° 34.845'N | 73° 37.006'W | 156 | Grass Airstrip | 4-component | |
| 2 | Black Horse Farms | 42° 18.423'N | 73° 50.906'W | 47 | Fallow/Pumpkin/Squash | 4-component | uBaro,CO2,O3 |
| 3 | Southlands Farm | 41° 52.988'N | 73° 54.885'W | 45 | Pasture | 4-component | uBaro,CO2,O3 |
| 4 | Green Acres | 42° 08.887'N | 73° 45.097'W | 94 | Airport grass | Net rad + Solrad | uBaro |
| 5 | Fix Bros Farm | 42° 10.584'N | 73° 49.577'W | 108 | Apple Orchard | Net rad + Solrad | |
| 6 | Van Orden Farm | 42° 10.846'N | 73° 53.681'W | 25 | Clover/Corn | Net rad + Solrad | uBaro,CO2 |
| 7 | Zena Cornfield | 42° 02.368'N | 74° 05.105'W | 133.2 [??] | Hay | Net rad + Solrad | |
| 8 | South Albany Airport | 42° 33.542'N | 73° 50.132'W | 53 | Airport grass | Net rad + Solrad | uBaro |
| 9 | Pertgen | 42° 27.763'N | 73° 44.660'W | 76 | Hay | Net rad + Solrad | uBaro,CO2 |
Instrumentation
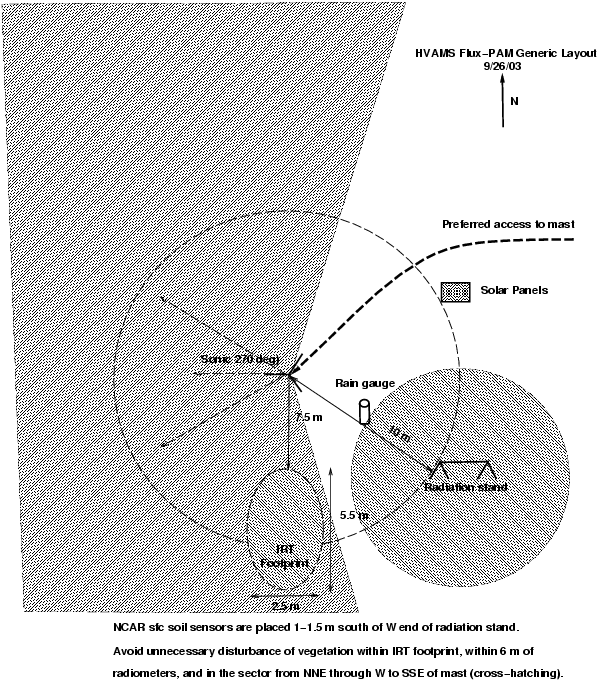
The mast, radiation stand, rain gauge, and solar panels (or transformer) were arranged in roughly the same layout at each station. The basic instrumentation at each site consisted of:
- Prop vane anemometer, RM Young 9101, for mean wind speed and direction at 10 m agl
- Vaisala 50Y Humitter to measure air temperature and RH; in NCAR aspirated radiation shield at 2 m agl
- Barometer, Vaisala PTB220B, with a single-disk static pressure port
- MRI model 302/303/304 tipping bucket rain gauge, with no wind screen
- Sonic anemometer, Campbell CSAT3 at 7m
- Fast-response hygrometer, Campbell KH2O 30cm behind the CSAT3
- Infrared surface temperature sensor, Everest 4000.4GL
- Soil heat flux plate, REBS HFT-3 at 5cm depth
- Soil temperature (REBS) averaging over 1-4cm depth
- Soil water content ( Campbell Scientific CS-615) sensor at 5cm depth
- Soil thermal properties ( Hukseflux TP01) sensor at 3-4cm depth
- Net radiometer, REBS Q*7
As listed above, all sites had net radiometers. In addition, Sites 1-3 also had radiometers for all four components:
- Incoming and outgoing long wave (Eppley PIR) and incoming and outgoing shortwave (Eppley PSP or Kipp & Zonen CM 21) radiometers
whereas Sites 4-9 just measured incoming short-wave radiation with a: Li-Cor 200SA Pyranometer. Further documentation on some of these sensors is available at the ISFF sensors page.
User-supplied sensors were installed at some sites:
- Sites 2, 3, 4, 6, 8 and 9 had microbarographs.
- Sites 2 and 3 had ozone monitors (sensor intended for site 9 never worked).
- Sites 2, 3, 6 and 9 had RMT DX6100 carbon dioxide sensors.
These sensors were installed after the NCAR stations were operational.
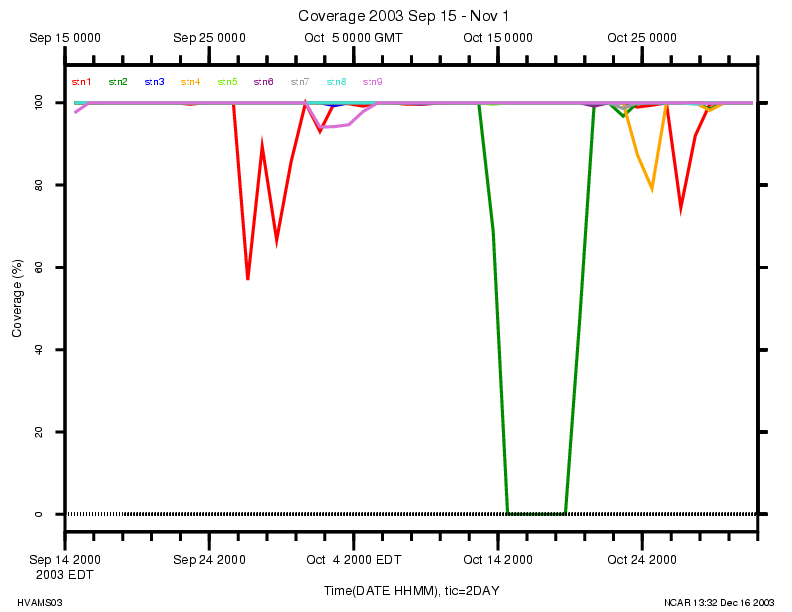
Data Coverage
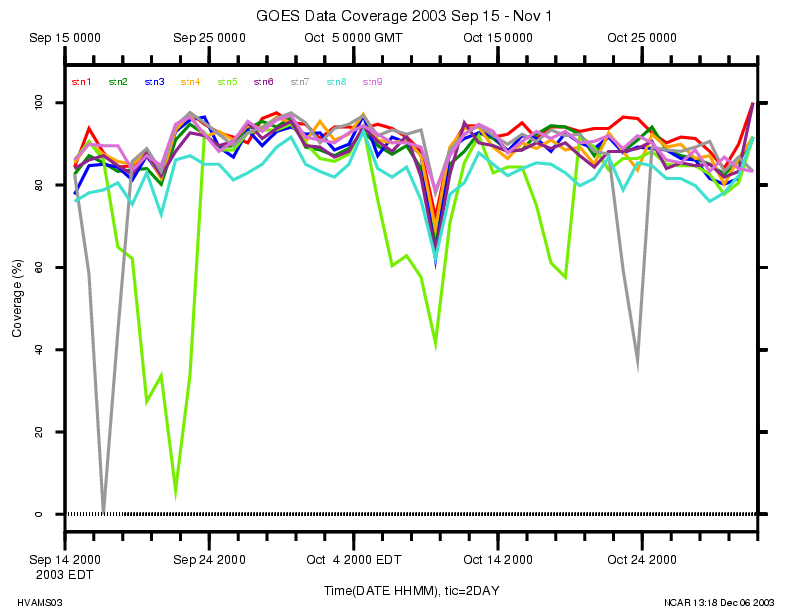
Real-time transmission of the 5-minute statistics from each station via the GOES-East satellite provided about a 85-90% data recovery rate (except at station 5), as seen in the table below. This value is similar to what was seen in the IHOP 2002 field project.
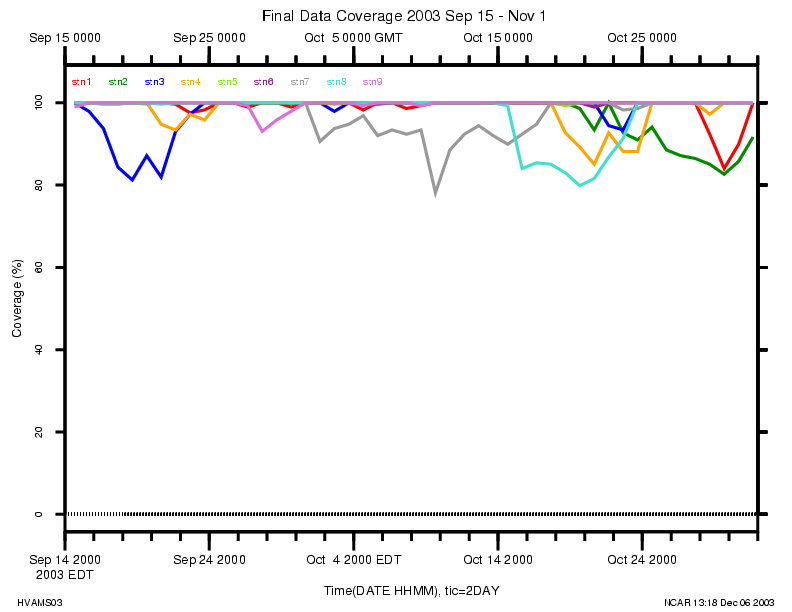
5-minute statistics were also stored locally at each station on flash disks, and downloaded periodically during station visits. Merging the local storage with the GOES data provided better than 97% recovery at all stations.
The high rate data also were stored locally on compact flash disks, using a serial data recorder (SDR). The SDR coverage values listed below are better than 97%, except for a 6-day gap at station 2. These values are the % of time that data were available for the vertical wind w, ambient temperature, T, and net radiation, Rnet.
Data recovery, Sep 15-Nov 1
| Station | Total Records | GOES Recovery(%) | Merged Recovery(%) | High rate (SDR) Recovery(%) |
|---|---|---|---|---|
| 1 | 13548 | 91.5 | 99.1 | 96.9 |
| 2 | 13548 | 88.6 | 97.6 | 87.5 [1] |
| 3 | 13548 | 88.3 | 97.9 | 100 |
| 4 | 13548 | 89.5 | 98.2 | 99.2 |
| 5 | 13548 | 76.5 | 100 | 100 |
| 6 | 13548 | 87.7 | 100 | 100 |
| 7 | 13548 | 85.5 | 97.2 | 100 |
| 8 | 13548 | 82.2 | 97.4 | 100 |
| 9 | 13548 | 90.1 | 99.7 | 99.5 |
[1] Compact flash disk failed at station 2, resulting in a data loss from Oct 14 - 20.
Data Recovery Via GOES click on a plot to expand |
Merge of GOES and Local Storage click to expand |
SDR Coverage click to expand |
The final data set has been produced by recalculating all statistics from the high-rate (SDR) data. During the two biggest data gaps -- Stn 2, Oct 14 16:25 to Oct 20 12:35 EDT and Stn 1, Sep 27 10:00 to 20:40 EDT -- the "merged" GOES plus FLASH statistics computed by EVE were inserted. The remaining data gaps (<1%) are due to outages during station visits.
Sensor Notes
GOES Transmission Noise
The local acquisition of high-rate data, in addition to the transmission, every 5 minutes of the 15 second burst of EVE calculated products, provided the opportunity to detect RF induced noise in the acquired data. The noise was first detected in the output of the user sensors. These sensors were housed in plastic boxes approximately 1 meter directly behind the GOES antenna, which were mounted low on the south east leg of the tripods. As such they were in line with the back lobe of the antenna transmission and quite without RF shielding. The noise spikes, every 5 minutes for 15 seconds was quite apparent in the data when the Flash card data was downloaded into the data stream and examined at the Base. Thus alerted to the potential for GOES transmission noise the fast data acquired from the other sensors was examined. Althouh some trace could be detected in some sensor data, the only significant contribution to the ISSF sensor data was to the temperature data from the T/RH sensor and Tsfc from the Everest. An attempt was made to provide grounding to the outer sleeve of the coaxial radiation shield but this was not really successful. A partial solution was to move the GOES antenna from their position low on the south east leg of the tripod to a separate post several meters to the west of the tripod. This involved the use of a several meter GOES antenna cable. Several of the cables were already that length and by using cable barrels, two length could be co-joined. For several stations the situation was resolved by merely moving the antenna to the south west leg of the tripod. Logbook entries #?? deal with this issue.
Since the timing of this noise is known, all T and Tsfc data during GOES transmissions have been removed. Spikes on the ozone sensor at stn3 for the entire project and the microbarographs at stns 2, 3, and 9 for the first half of October were also removed. The remaining good data are used in the 5-minute averages.
Sonic Anemometer
CSAT3 sonic anemometers were used at all sites. Some of the sites were in complex topography. We attempted to level all sonic anemometers during installation by using an electronic level to adjust (boom) guy wire tension and then attaching the anemometer. This should have been accurate to about 0.2 deg. Thus, any mean vertical flow indicates the effect of local topography on the actual air motion.
We have documented this effect using our standard tilt correction procedure. The results (including links to plots) are shown in the table below. For site 6, where an up to 3m corn crop, less than 9 m to the west of the station was harvested on 19 - 29 October have the tilt data been parsed into a prior and a post harvest.
The masts bearing the sonic anemometers were periodically lowered to affect sensor maintainance. These data from these periods have been removed from the data set.
The final data set is corrected for these tilts removed and have data during the maintainance periods removed. Winds have been rotated into geographic coordinates (+u = wind to the east; +v = wind to the north). Also, high-rate data that were flagged either by the anemometer firmware or by our adaptive despiking procedure have been replaced by "predicted values" to (partially) overcome the effects of liquid water on the transducers.
The final data set also includes derived sensible and latent heat fluxes (<w't'>, <w'h2o'>, H and LE) from these sensors, including all of our standard corrections.
Table of tilts
| Station | Start | End | lenday | ellim | w bias | lean | leanaz | plot |
| 1 | 2003 Sep 12,00:00 EST | Oct 31, 00:00 | 49 | 15 | -0.019 | 2.7 | -106.1 | stn1tilt.pdf |
| 2 | 2003 Sep 12,00:00 EST | Oct 31, 00:00 | 49 | 15 | -0.041 | 2.5 | 25.6 | stn2tilt.pdf |
| 3 | 2003 Sep 12,00:00 EST | Oct 31, 00:00 | 49 | 15 | 0.002 | 0.6 | 146 | stn3tilt.pdf |
| 4 | 2003 Sep 12,00:00 EST | Oct 31, 00:00 | 49 | 15 | 0.048 | 3.8 | 13.8 | stn4tilt.pdf |
| 5 | 2003 Sep 12,00:00 EST | Oct 31, 00:00 | 49 | 15 | -0.044 | 5.7 | 31.1 | stn5tilt.pdf |
| 6 | 2003 Sep 12,00:00 EST | Oct 31, 00:00 | 49 | 15 | 0.003 | 7.1 | -23.3 | stn6tilt.pdf |
| 6a | 2003 Sep 12,00:00 EST | Oct 20, 00:00 | 38 | 15 | -0.005 | 7.7 | -25.9 | stn6atilt.pdf |
| 6b | 2003 Oct 20,00:00 EST | Oct 31, 00:00 | 11 | 15 | 0.008 | 5.0 | -20.7 | stn6btilt.pdf |
| 7 | 2003 Sep 12,00:00 EST | Oct 31, 00:00 | 49 | 15 | -0.050 | 1.8 | 45.3 | stn7tilt.pdf |
| 8 | 2003 Sep 12,00:00 EST | Oct 31, 00:00 | 49 | 15 | 0.009 | 0.5 | 79.8 | stn8tilt.pdf |
| 9 | 2003 Sep 12,00:00 EST | Oct 31, 00:00 | 49 | 15 | -0.029 | 1.2 | -10.9 | stn9tilt.pdf |
Krypton Hygrometers
Fast response Campbell KH2O hygrometers were used at all stations. The sensors were set with an optical gap of 30 cm and mounted with a vertically oriented optical path. The sensors were mounted in this orientation to minimize of flow distortion. Unfortunately, with precipitation, water pooled on the lower window and increased the recovery time of the sensor. Rain and depositing mist were quite common during HVAMS, and this increased recovery time lead to an additional loss of data. Attention was paid to the sensor output voltage, kh2oV, and when the operating voltage persisted below 300 mV, the PAM mast was lowered and the windows of the hygrometer were cleaned. The time periods when the mast was lowered were noted in the logbook, then after the project were checked and the data for those periods flagged as invalid. It was noted that although episodes of depositing mist generally left the windows more opaque, after rainfall the window opacity remained unchanged.
The krypton data, along with the associated fluxes (including the sensible heat flux because only virtual temperature is measured), have been removed during the cleaning periods and when the output voltage was below 0.01 V (indicating liquid water on the lens). Note that this occurs due to dew at almost all sites at night. (Sensible heat can be estimated as 1004 <w'tc'> during these periods.)
Barometers
Vaisala PTB220B barometers interfaced with a horizontal single disk pressure port were deployed at all stations. They could be interfaced using either a individual serial port or a serial buss (SBUS). Some of these barometers were known to have problems when using the SBUS, but some stations required SBUS operation because the CO2 sensor required a separate serial port. During operations, more sensors developed SBUS problems and were swapped, however for 2-3 weeks two stations did not have working barometers. (At the very end of operations, it was found that RS232 could be restored to the latter units by setting an internal switch to "factory defaults".)
To minimize the effect of the loss of two Vaisala barometers, we deliberately set these two stations to be those which did have microbarographs. Unfortunately, toward the end of the deployment the batteries utilized to power the microbarometers began to fail. An attempt to power the user-supplied microbarometers from the PAM power system failed and an only partially successful program of replacement using recharged batteries was carried out over the last few days of October.
A summary of instrument movements follows. Note that there (apparently) are several typos and omissions in the logbook:
- Sites 2, 3, 5, 7, and 8 had barometers NCAR002, NCAR001, S0610001, U110001, and U110003, respectively, throughout the project.
- On 5 Oct NCAR003 and S0610002 were swapped between sites 1&9, beginning in these respective positions.
- On 9 Oct U4110004 was removed from site 6 to replace S0610002 at site 1. S0610002 was brought back to the lab. Site 6 then had no barometer.
- On 12 Oct NCAR003 was removed from site 9 and brought back to the lab. Site 9 then had no barometer.
- On 16 Oct S0610002 was returned to service at site 6, but died again and was finally taken back to the lab on 22 Oct.
- On 29 Oct, U4110004 was removed from site 1 and placed at site 9. S0610002 (now finally working) replaced it at site 1.
- Also on 29 Oct, S0610003 which had been working flawlessly at site 4 was placed at site 6. NCAR003 (now also fixed) replaced it at site 4.
All of the values that were reported by functioning sensors appear to be correct. Thus, no editing of the data is needed. (However, see the T/RH section, next.)
We have a Report about tests of these sensors after the program.
T/RH
At all stations the NCAR Temperature/Relative humidity aspirated radiation shields incorporating Vaisala 50Y Humitter were deployed. The operation of the aspiration fan was checked by monitoring the station power consumption and listening for the fan noise during each station visit. Only one T/RH (station 9 on 3 Oct) was changed because of this and no problems with the data were noticed.
On 17 Oct, station 7's TRH was swapped to reduce continous noise that was seen in the high-rate data. Later, it was found that this was due to GOES interference. Some GOES antennae were moved that reduced this problem, but all data have been reprocessed removing the periods of GOES transmissions. This will have to be done with some of the early user sensor (microbarograph) data as well.
As noted above, some of the barometers had problems operating on the SBUS. From 2-5 Oct., some of the data T/RH data at station 9 was contaminated by its barometer. These data have been despiked in the final data set.
Laboratory-based post-calibrations have been applied to all T/RH data. This reduced the magnitude of RH events greater than 100%. At most, the gain of T was changed by 0.1%, the offset by 0.05 C, the gain of RH by 5% and the offset by 4%.
As noted below, the sensors were swapped between the sites from 23-25 Oct. during the modification to acquire the Everest Tsfc signal. The following table shows all these sensor changes.
| Stn 1 | Stn 2 | Stn 3 | Stn 4 | Stn 5 | Stn 6 | Stn 7 | Stn 8 | Stn 9 | |
|---|---|---|---|---|---|---|---|---|---|
| Set-up | 101 | 8 | 5 | 3 | 7 | 502 | 701 | 206 | 702 |
| 10/3 | 204 | ||||||||
| 10/17 | 4 | ||||||||
| 10/23 | 701 | 502 | 703 | 206 | 702 | ||||
| 10/24 | 204 | 5 | 4 | 8 | |||||
| 10/25 | 101 | ||||||||
| 10/28 | 7 | ||||||||
| Tear-down | 7 | 701 | 502 | 5 | 4 | 703 | 206 | 702 | 8 |
Precipitation Gauges
MRI tipping bucket rain gauges were deployed at all stations. They were calibrated in situ using our standard calibraters that introduce an amount of water equal to 100 tips. One of the calibration units had a clogged aperture, which caused the calibration set on about 1 Oct to take over an hour. Later calibrations only took 10-15 minutes. Station 3 failed to report rain events early in the project, but worked fine during calibrations. We suspected that a break in its cable allowed rain to short the wires, though we never actually located such a break. The operational part of the gauge was replaced on 24 Sept. and this problem disappeared. Station 4 also had periods of not reporting rain late in the program that was isolated to loose terminal block screws in the data loggers fixed on 26 Oct.
The station 3 and 4 data during these failures have been removed from the final data set.
Propvanes
NO PROBLEMS
Surface Temperature
Everest 4000.4GL infrared surface temperature sensors were mounted at 10m? on every PAM mast looking down at 45 degrees to the ?southwest?. The sensors responded well throughout the program until mid October when nocturnal surface temperature fell below zero. By oversight, the data acquisition system had been set to record temperatures only > 0 degrees. Thus, we modifed the T/RHs at each station to acquire Everests' signal. This was done 23-25 Oct. In this process, all of the sensors were moved to different sites. At Station #1 the procedure failed and, as that station was capable of acquiring surface temperature from the down-looking Eppley pyranometer, the T/RH modification was undone. Data below zero prior to this modification will be set to missing values.
The variable "Tsfc.pyrg" derived from the pyranometers at sites 1-3 has been added to the final data set.
Radiometers
At all nine stations radiometers were mounted at ~ 2m on the cross beam of a radiometer stand, or Dark Horse. This stand was located approximately 4?m to the south of the PAM tripod, in the vicinity of the soil sensors, which, together with the radiometers, were cabled to the Campbell data logger mounted on the west end of the cross beam. In fact, it was the sequence of station set-up which defined the relative location of the soil sensors, the radiometer stand and the tripod. The soil sensors had to be installed several months prior to the beginning of HVAMS operation to allow them to equilibrate with the soil. Thus they were in place and marked with the strain relief stakes when the set-up crew arrived with the station paraphernalia. The radiometer stand was installed aligned east-west in a position suitable to allow the soil sensor cables to run from the strain relief stake, up the south west leg to the Campbell data logger. The PAM tripod was then erected in a position north east of the radiation stand within the range of the 8?m serial cable connecting the Campbell data logger and the EVE computer box mounted at the base of the PAM mast. The solar panels were then emplaced to the north east of the tripod resulting in the configuration illustrated in the generic layout of the mast, radiation stand, rain gauge, and solar panels at each station.
Stations #1, #2, and #3 were equipped with full four component radiation systems, while Stations #4, #5, #6, #7, #8, and #9 were equipped with simpler radiometer sets of net radiometers and solar pyranometers.
The four component radiation system comprised of upward- and down-ward looking long- and short-wave radiometers, to accurately measure the four components of the atmospheric radiation. The two long-wave radiometers were Eppley PIR pyranometers with custom-installed three dome temperature thermistors and voltage standard subsystems. These radiometers were calibrated at the NOAA Atmospheric Radiation MMMMM? in Boulder Colorado several months before the HVAMS03 deployment. The two short-wave radiometers were Kipp and Zonen CM21 pyranometers which had also been calibrated at the NOAA Atmospheric Radiation MMMMM? in Boulder Colorado, but the previous year. All four radiometers were mounted on a leveling platform attached to the radiometer stand cross beam.
The simpler radiometer set comprised of a REBS Q7 net radiometer, for which we used the factory supplied calibration which utilizes separate coefficients for daytime, when short wave radiation dominates and nighttime, when long-wave radiation dominates. A simple Li-Cor 200SA pyranometer using the standard calibration coefficient measures the incoming short-wave radiation. These radiometers also were leveled using a center bubble level device.
All radiometers were cleaned during station visits and the up-looking radiometers of the four component array were subjected to shadow tests to define the short-wave interference contribution to the long-wave measurements.
The wind speed correction given by the Campbell Scientific manual has been applied to the final data set. This correction requires an estimate of the wind speed at the radiometer height (~1.5m). Since no anemometer was at this height, the sonic anemometer wind speed at 7m height was used and corrected assuming a logarithmic wind profile (an obviously VERY crude assumption for some sites). [U_Rnet = U_sonic log((1.5-D)/zo) / log((7-D)/zo).] As input to this correction, we (Oncley) crudely estimated the displacement height and roughness length at each site (in cm) as:
| Station | H | D | zo |
|---|---|---|---|
| 1 | 20 | 15 | 2 |
| 2 | 80 | 40 | 5 |
| 3 | 10 | 5 | 2 |
| 4 | 10 | 5 | 2 |
| 5 | 400 | 100 | 40 |
| 6 | 10 | 5 | 1 |
| 7 | 50 | 40 | 5 |
| 8 | 15 | 10 | 1 |
| 9 | 30 | 20 | 2 |
Several things have been done to the final data set:
- The wind speed correction to Rnet
- Rsw.in.s2 data removed due to loose wire until 11 Sep
- Tdome and Rsw corrections to Rlw applied.
- The variables Rlw.in and Rlw.out were generated and Tsfc.pyrg and Tsky from them.
- Data removed during cleaning.
A comparison of the sum of the radiation components versus Rnet for stations 1-3 is generally good, except for station 3 after 16 Oct. Lab testing of this Rnet sensor a year later showed no response. We suspect that rain damaged this sensor. However, since we do not yet know, these data have been left in the final data set.
Soil Sensors
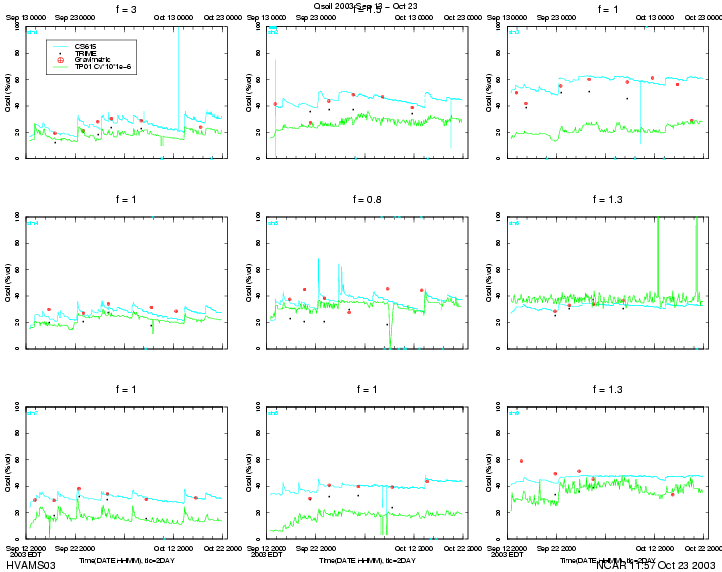
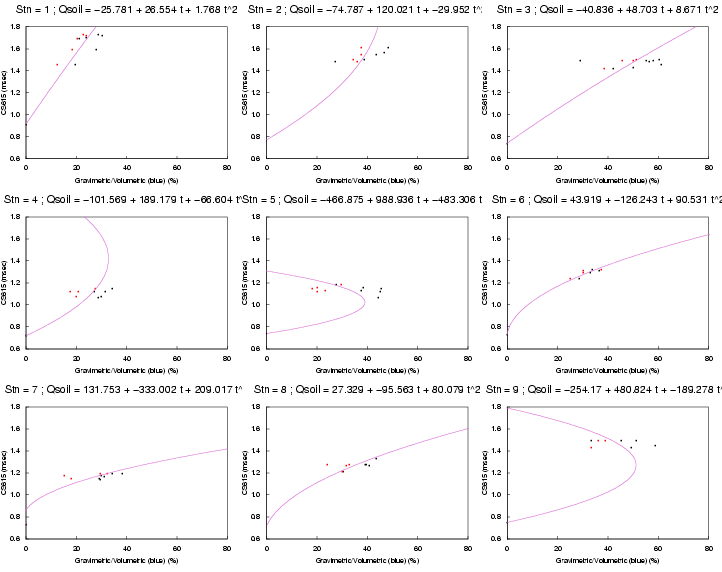
To calibrate our soil moisture (CS615) sensors, we regularly took both gravimetric and hand held (TRIME) volumetric soil moisture samples during site visits. The gravimetric values were from a soil core 3-6 cm deep. By weighing the total mass of this core, bulk density was obtained to convert the gravimetric soil moisture fractions to volumetric values. (The median of 2-4 density determinations at each site was used in the plot below.) The TRIME volumetric readings are supposed to be valid for a wide variety of soil types (though I note that the manual refers to a calibration procedure to be done if probe elements are changed, which was not done after the FLOSS-II project). The median of the 3 readings done during each site visit is shown in the plot. Finally, HVAMS was our first deployment of the TP01 probes in normal (not frozen!) soil, from which we can compute soil heat capacity (which changes with soil moisture.)
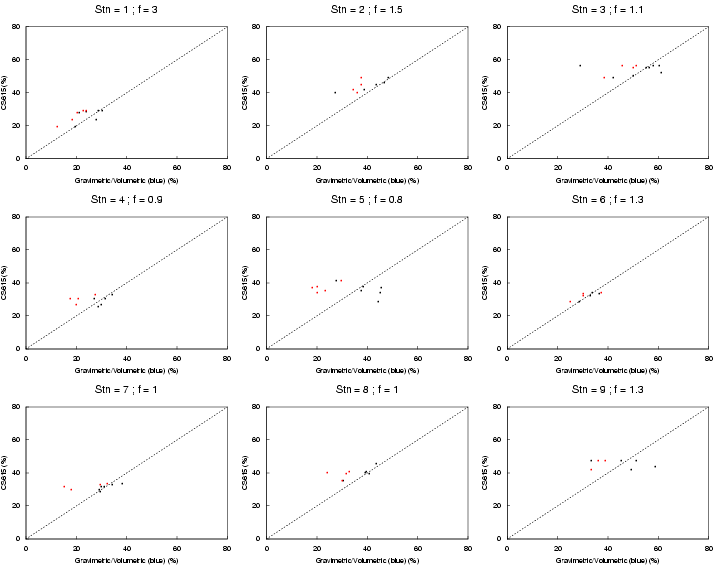
A plot of all of these measurements shows several good and bad features. In general, the TP01 Cv values track changes in moisture measured by the CS615 quite well. (Site 8 has some drift at the beginning of the project.) Many of the sites, especially 6-9, have little variation in soil moisture, presumably due to the soil being near saturation (field capacity). However, somewhat large scaling factors (from 0.8 to 3.0) were needed to get the CS615 values to match the gravimetric values even approximately. Furthermore, differences between the gravimetric and TRIME values are quite large for several sites, especially for sites 3 and 5. These variations are more than can be explained by inhomogeneities in the soil, since TRIME readings were taken at 3 locations within a radius of about 30cm from the core location and generally were within a few percent. Finally, we note that with the small variations in soil moisture at many of the sites, a good calibration of the CS615 probably is not possible.
A scatterplot of these measurements shows a wide range of quality of these calibrations. We tried a more sophisticated fitting procedure -- second order in the raw time measurement, including zero offsets -- but the fits were terrible (see plot). Therefore, the data have been processed using the nominal calibration adjusted linearly by these scaling factors.
The final data set processing includes:
- Calibrate the CS615 values.
- Recompute maximum, rather than average, values from the TPO1 sensors (as EVE did in real time). These variables called "Vpile_max", "Vheat_max", and "Tau63_max".
- Derive "Cvsoil", "lambdasoil", and "asoil" from the TP01.
- Derive "Gsfc" (including heat storage using TP01 and Tsoil data)
- Some obviously bad values removed.
- Remove the last day(s) of data when the soil sensors were pulled from the ground.
User Sensors
These were installed at the following times:
| Station | Microbarograph | Ozone | CO2 |
|---|---|---|---|
| 2 | 10/2 | 9/6 | 10/6 |
| 3 | 10/3 | 10/3 | 10/8 |
| 4 | 10/3 | ||
| 6 | 10/6 | 10/16 | |
| 8 | 10/2 | ||
| 9 | 10/2 | 10/2 [removed 10/3] | 10/16 |
A RMT DX6100 sensor was used for carbon dioxide. See our Usage Notes for its configuration and variables.
Some of the microbarograph and ozone sensors also picked up the GOES noise mentioned above. Note that these signals show the noise ~5 seconds delayed, e.g. the station 2 transmission starting at 00:30 shows up in 00:35. Also, the O3 noise appears to have an effect lasting ~20s after transmission (see plot). This noise persisted even after the GOES antennae were moved mid October. These spikes have been removed from the average data, but are still present in the high-rate data.
Finally, we note that the microbarographs appear to have clipped a low-pressure (<981 mb) event on 15 Oct, 02:30-13:00 EDT.
Power
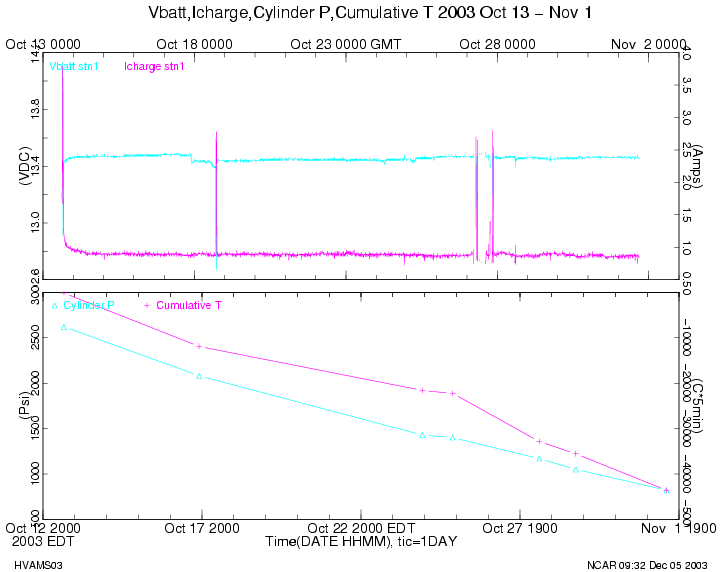
All of the stations were set up in the standard configuration with a bank of 6 solar panels charging 3 truck batteries. (At stations 3 and 7, one of the panels was used to charge a 4th battery connected to an electric fence.) On 13 Oct (about half-way through the program), the solar panels were disconnected at station 1 and replaced by the fuel cell as the only source of power to the battery charger. We used a demonstration hydrogen cell system (H-Power D35 -- no longer available), supplied by a 300 cubic foot cylinder of ultra pure (99.995%) hydrogen. Because the the fuel cell was rated at 35W and the station power peaks at 50W during GOES transmissions, one battery was left connected. This station ran for 19 days at a constant 12 W (and nearly constant voltage of 13.4 V) until tear-down as the cylinder pressure went from 2620 to 820 Psi (see plot). Extrapolating, it could have run for almost 28 days on just the one cylinder. We consider this a very successful demonstration of the applicability of fuel cells for this use.
Shown in this plot is (the negative of) the accumulated sum of temperature to indicate the temperature affecting the fuel cell. There is a slight hint that the H2 consumption is related to temperature, though more testing is needed.
Photographs
Station Photos
 Station 1 |
 Station 2 |
 Station 3 |
 Station 4 |
 Station 5 |
 Station 6 |
 Station 7 |
 Station 8 |
 Station 9 |
Field Logbook
A computer-readable field logbook of comments by NCAR and other personnel is available in read-only html form.
Data Tables and Plots
Click on the above link to view tables and plots.
The tables display mean, deviation, number of missing values, and number of clipped values for each HVAMS03 variable, from 0:00-6:00, 6-12:00, 12-18:00 and 18-24:00 each day.
The 5 minute statistics for most variables are shown on time-series plots.
Spectra plots of high-rate data from 00:00-00:30 and 12:00-12:30 local time each day are provided as available.
Data Download
The NCAR HVAMS03 data is available for download in the following forms:
- 5-minute statistics in NetCDF form
- 1-minute averages in NetCDF form
- High rate data in ASCII or NetCDF(via a Java application)
Other Links


