Search
Publication or Paper A Climatology of Thundersnow Events over the Contiguous United States
Deployments and Class Procedures
Overview and Scheduling
 |
|
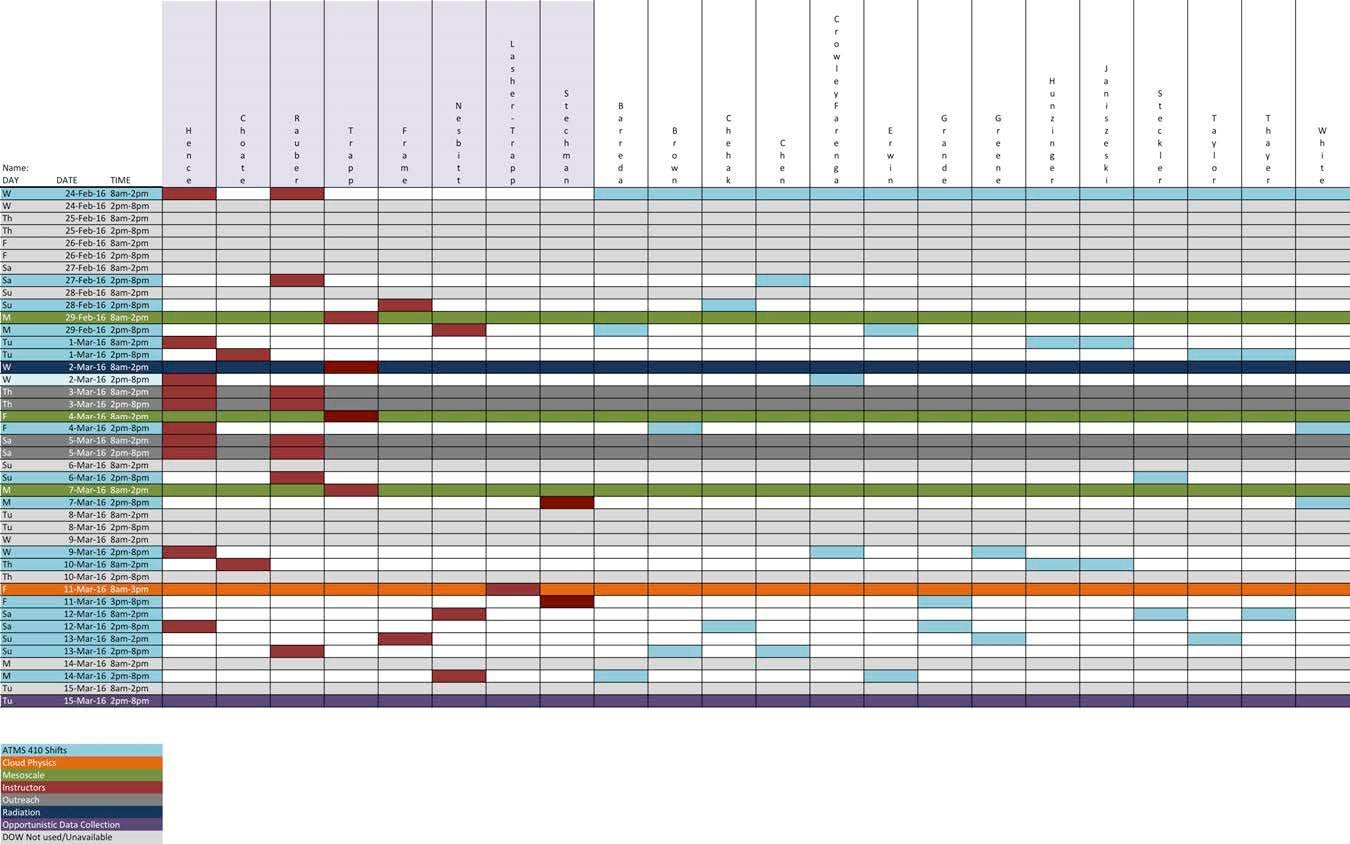
Table 1. Student and Faculty deployment schedule during UIDOW 2016.
|
Table 1 [right] shows the scheduling for the students of ATMS 410 as well as the 8 scientists (6 professors, 2 experienced graduate students) that contributed to the deployments. Each student in ATMS 410 was able to deploy with the radar at least twice, and additional students not in ATMS 410 were included as space and time allowed. In addition to these deployments, the radar was reserved for the use of ATMS 314, where students accompanied Professor Trapp in groups of 3-4. The DOW was reserved for the use of ATMS 306 for one class period, with a focus on how radar retrievals can be used to characterize cloud physics and microphysical retrievals. In addition, ATMS 304 (Radiative Transfer- Remote Sensing) also reserved the radar for a class period to discuss how the principles of radiative transfer apply to active remote sensing. Because of overlap between the classes, some students were able to interact with the radar on multiple occasions with different contexts, which allowed them to see how these principles they were learning in the disparate classes applied to radar remote sensing. Professor Frame and a graduate student coordinated providing us with weather forecasts throughout the deployment, to notify us of potential opportunistic data collection days.
Table 2 [below] outlines the weather sampled with each of the DOW deployments. Professors Hence and Rauber performed site surveys to identify several of the sites prior to the arrival of the DOW, although further sites were identified during the course of the deployment. The DOW time at UIUC was bookended by two examples of severe weather: a blizzard that reached full intensity during the first full day of the DOW being at the university; and an outbreak of severe convection across central Illinois on the final day. In between these extreme events, the students examined frontal passages with associated precipitation, regions of stratiform precipitation, thick lightly precipitating cloud layers, scattered convection that underwent a convective-stratiform transition, and a relatively frequent occurrence of clear air days. In addition, we were able to sample in the parking lot near the Atmospheric Science building to do a cross-calibration of the department's new MRR on the same day as our campus community outreach day. This activity provided valuable data that can be cross-analyzed and used for future research, but also enabled many students on and off of our campus to witness data collection from two radars in real-time.
Highlights
 |
|
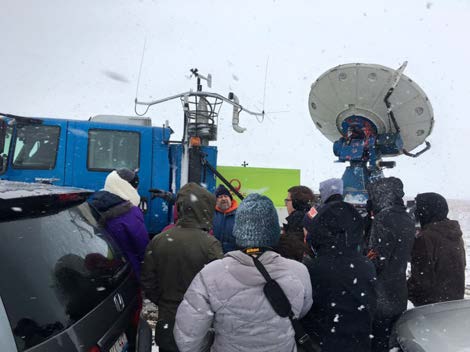
Figure 2. Professor Rauber explaining the external components of the DOW to the students.
|
Blizzard hits first full day
The first full day with the radar was reserved for an introduction to the radar and the deployment for ATMS 410, and what a start! As a data collection opportunity and in partnership with researchers from the UI Energy Farms, the radar deployed to a pre- determined research field southeast of campus. The radar performed PPI and RHI scans as Professors Rauber introduced the students to the internal and external components of the radar in strong winds and blowing snow. Students were shuttled back and forth to the radar (only a few miles from the department) during the course of the deployment.
Clear air and non-precipitating cloud studies
 |
|
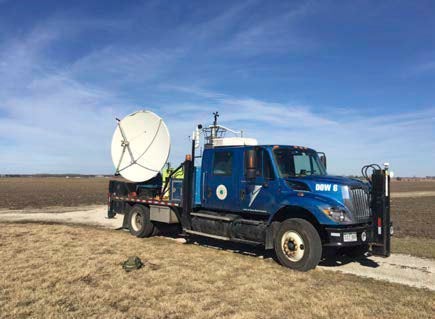
Figure 3. The DOW parked at the SOY-FACE farm south of campus.
|
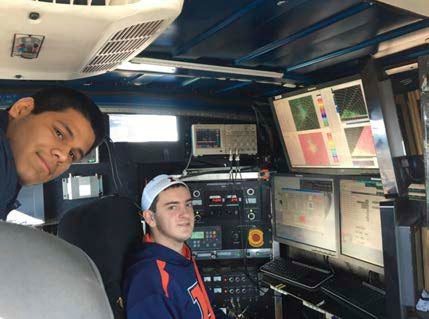
We used the several instances of clear weather days to put students in the operation seat for the radar to teach the students various calibration and clutter identification techniques. Given that this was the most frequent weather occurrence, almost every student was given opportunity to perform site surveys, map ground clutter, test various scan strategies, and examine other non- meteorological returns such as those from trains, planes, power lines, and sun spikes. When the opportunity arose, students also examined cirrus cloud generating cells, haze, and thick low-level cloud layers using a variety of scan strategies and experimenting with the effects of using different pulse repetition frequencies. In their final projects, all ATMS 410 students will be required to use the data from clear air retrieval days to identify and investigate strong sources of ground clutter.
Light to Moderate Precipitation Cases
 |
|
Figure 4. Students examining clear air returns.
|
On days where precipitation was present, students were able to examine the particle and velocity characteristics of the precipitation in real-time and were given the opportunity to alter the scan strategies.The students were encouraged to examine both the horizontal and vertical distribution of precipitation targets and think about how the different parameters and settings of the radar impacted their ability to retrieve useful information. In one case of a cold frontal passage, the students were able to witness the transition from rainfall to snow and the wind shift in real time via the velocity and dual-polarization parameters. During a different deployment, during which we shuttled numerous students back and for, the students examined the transition of scattered convection into stratiform precipitation.
Severe convection near Springfield, IL
 |
|
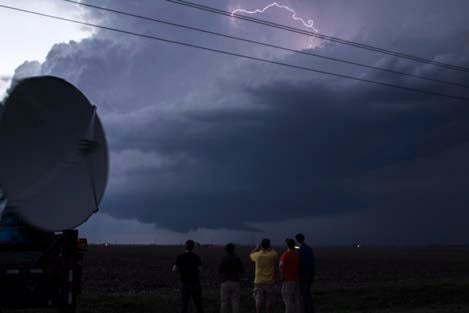
Figure 5. Professor Frame with students sampling a tornadic supercell.
|
One of the most exciting and rewarding days was the final day of the deployment, which not only was an excellent data collection day but also showed everyone the power that social media can have in science. When forecasts indicated that Central Illinois was primed for severe convection, Professor Frame coordinated with both graduate and undergraduate students to collect data near the Springfield area. Through Professor Frame's active use of Twitter, an opportunity for collaboration arose when students from Purdue University notified him that they were in the same area collecting data of their own. Professor Frame and students from both universities were able to coordinate a joint operation and were able to successfully capture the tornado that touched down in the region.
Table 2: Missions during UIDOW 5 (2016).
|
DAY |
DATE |
TIME |
Orientation |
Mission Weather |
Scientist |
|
W |
24-Feb |
8am-2pm |
|
Class Introduction; Blizzard |
Hence, Rauber |
|
W |
24-Feb |
2pm-8pm |
|
|
|
|
Th |
25-Feb |
8am-2pm |
|
No Mission |
|
|
Th |
25-Feb |
2pm-8pm |
|
|
|
|
F |
26-Feb |
8am-2pm |
|
|
|
|
F |
26-Feb |
2pm-8pm |
|
|
|
|
Sa |
27-Feb |
8am-2pm |
|
|
|
|
Sa |
27-Feb |
2pm-8pm |
|
Ground Clutter Mapping |
Rauber |
|
Su |
28-Feb |
8am-2pm |
|
No Mission |
|
|
Su |
28-Feb |
2pm-8pm |
|
Frontal Passage with Precipitation |
Frame |
|
M |
29-Feb |
8am-2pm |
|
Clear Air: PRF testing, elevation and RHI scans |
Trapp |
|
M |
29-Feb |
2pm-8pm |
|
Clear Air |
Nesbitt |
|
Tu |
1-Mar |
8am-2pm |
|
Frontal Passage with Precipitation |
Hence |
|
Tu |
1-Mar |
2pm-8pm |
|
No data collection – Generator Failure at Site |
Choate |
|
W |
2-Mar |
8am-2pm |
|
Radiation Class Demo |
DiGirolamo |
|
W |
2-Mar |
2pm-8pm |
|
Mission Cancelled |
|
|
Th |
3-Mar |
8am-3pm |
South |
Parkland Community College Tours, Campus Open House, MRR/DOW calibration tests |
Hence, Rauber, Nesbitt |
|
F |
4-Mar |
8am-2pm |
|
Clear Air, Clutter Mapping, Site Survey |
Trapp |
|
F |
4-Mar |
2pm-8pm |
|
Clear Air, Clutter Mapping, Site Survey |
Hence |
|
Sa |
5-Mar |
11am-3pm |
|
Community Engagement Day |
Hence, Rauber |
|
Su |
6-Mar |
8am-2pm |
|
No Mission |
|
|
Su |
6-Mar |
2pm-8pm |
|
Clear air, cirrus generating cells, sun spikes |
Rauber |
|
M |
7-Mar |
8am-2pm |
|
Clear air |
Trapp |
|
M |
7-Mar |
2pm-8pm |
|
Clear air, cirrus generating cells, sun spikes |
Stechman |
|
Tu |
8-Mar |
8am-2pm |
|
No Mission: DOW Generator Maintenance |
|
||
|
Tu |
8-Mar |
2pm-8pm |
|
|
|
||
|
W |
9-Mar |
8am-2pm |
|
convection, convective-stratiform transition, gust front |
Hence |
||
|
W |
9-Mar |
2pm-8pm |
|
No Mission |
|
||
|
Th |
10-Mar |
8am-2pm |
|
Distant showers |
Choate |
||
|
Th |
10-Mar |
2pm-8pm |
|
No Mission |
|
||
|
F |
11-Mar |
8am-3pm |
|
Cloud Physics Class, |
Computer Failure |
|
Lasher-Trapp |
|
|
|||||||
|
F |
11-Mar |
3pm-8pm |
|
Mission Cancelled |
Stechman |
||
|
Sa |
12-Mar |
8am-2pm |
|
Very weak precipitation |
Nesbitt |
||
|
Sa |
12-Mar |
2pm-8pm |
|
Weakly precipitating cloud layers |
Hence |
||
|
Su |
13-Mar |
8am-2pm |
|
Stratiform precipitation |
Frame |
||
|
Su |
13-Mar |
2pm-8pm |
|
Stratiform precipitation |
Rauber |
||
|
M |
14-Mar |
8am-2pm |
|
Mission Canceled |
|
||
|
M |
14-Mar |
2pm-8pm |
|
Stratiform precipitation |
Nesbitt |
||
|
Tu |
15-Mar |
8am-2pm |
|
No Mission |
|
||
|
Tu |
15-Mar |
2pm-8pm |
|
Severe deep convection, Tornado |
|
||
|
W |
16-Mar |
8am-2pm |
|
No Mission - DOW Departed |
|
||
Outreach Activities
Campus and Community College Outreach
 |
|
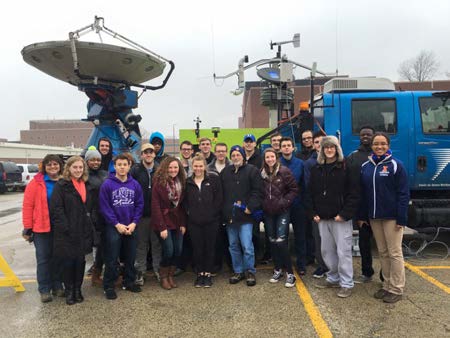
Figure 7. A class visit from Parkland Community College.
|
We held two outreach events: one geared towards our campus community and visits from Parkland Community College, and one later in the week for the community. Given that the DOW visit corresponded with National Severe Weather Awareness Week, as well as the first tests of the local tornado sirens of the season, Professor Hence coordinated with two graduate students (one active in emergency management research, the other active in K-12 outreach and education) as well as the UIUC Student Chapter of the American Meteorological Society (SCAMS) to organize the events around severe weather awareness and hazard preparation.
The campus outreach event was held in the DOW's parking space next to Atmospheric Sciences, which we had rented from the university for the duration of the campaign. The campus event was advertised to all of the Office of Inclusion and Intercultural Relations cultural houses, science and engineering-focused registered student organizations, as well as to faculty and staff through the various campus newsletters and publications (Inside Illinois, Eweek, etc). A press release was also sent to the Daily Illini (student newspaper).
 |
|
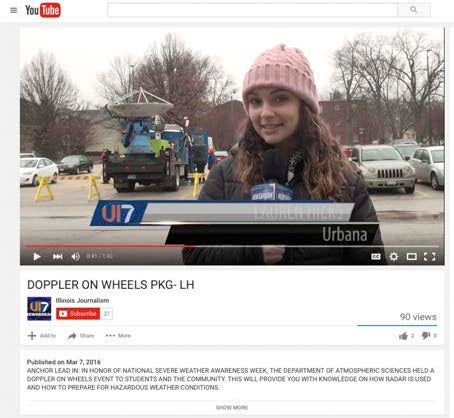
Figure 8. A science journalism student doing her class project on the DOW. View online.
|
Unfortunately, likely due to cold, wet weather attendance was low, but as planned three classes (ranging from 10-20 students per class) from Parkland Community College's Weather 101 class came for tours of the DOW, as well as a scattering of other students throughout the open house period of the day. A science journalism student interviewed Professors Rauber, Frame, and Hence as well as covered the two events as one of her class projects, which was put on YouTube as well as on the local student television station. In these ways, we contributed to the education of a variety of students in our collegiate community.
Community Engagement
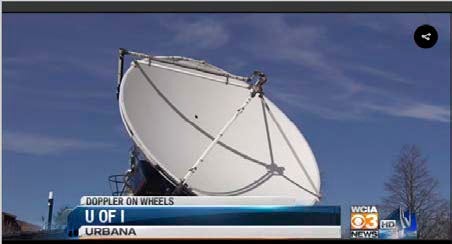
Although it was still a bit cold and windy, the severe weather preparedness community event met with greater success. The Illinois Exchange advertised the event as part of their own severe weather preparedness community outreach. The department issued press releases to Channel 3 WCIA, the News-Gazette (local newspaper), and WILL (local NPR station). WCIA interviewed Professor Rauber and notified the community of the event. Local schools were notified of the event and flyers were distributed for children to take home. The event was held in a highly visible, well- trafficked parking lot on the south side of campus, close to the athletic fields and campus arboretum.
 |
|
Figure 9. Local news coverage of the severe weather preparedness event. View online.
|
In addition to giving tours of the DOW, we were able to have a representative from the American Red Cross available to give community members informational pamphlets and coloring books for children. We also had two informational posters; one poster explained the meanings of watches and warnings in relation to typical Illinois hazardous weather phenomena, while the other had examples of a variety of emergency preparedness kits for adults, children, and pets. Professor Hence contributed her home emergency kits as hands- on visual examples. All told, the event reached 50-60 people over a 4 hour period and reached a range of children, with some visitors being as young as 3-6 years old.
Lessons Learned
 |
|
Figure 10. Local severe weather interest blog advertising our community outreach event.
|
As has been experienced previously with UIDOW, we discovered that having enough activities to keep students engaged on clear air days is a challenge. Although making sure the students take the reins and get the experience of setting up and operating the radar themselves is important overall, this is even more so critical on clear air days.
In general, although our undergraduate students are typically drawn to our program out of an interest in severe weather, we need to make sure to stress more clearly that all weather data collection is important, and not just the "exciting" part. An introduction to some of the tedium that is data collection better introduces them for the challenges of doing this in the future. Having the support of the operator to help make the student experience on "boring" days as engaging (or as close to as can be managed) as those with precipitation will be very helpful on future deployments. In particular, having students do manual solar calibration and other activities can be very educational.
We got a first taste of coordinating with other colleges and universities in the area for educational and data collection opportunities with the DOW, and this is something we will explore more in future deployments.
Finally, we learned the hard way that corn fields, even ones presumed frozen, are not good for DOW hydraulic feet.
 |
 |
||
|
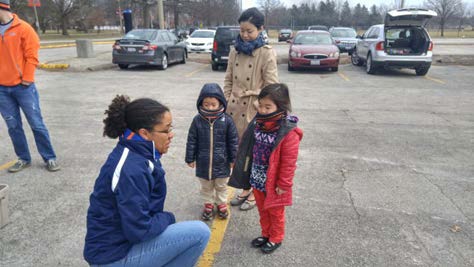
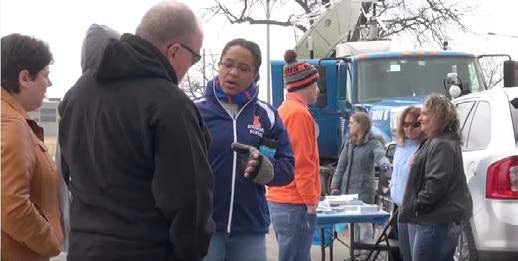
Figure 11 a & b. Professor Hence, various students, and a representative from the American Red Cross interacting with members of the public.
|
|||