Professor Paul Kaye
Science & Technology Research Institute
Univ. Hertfordshire, England
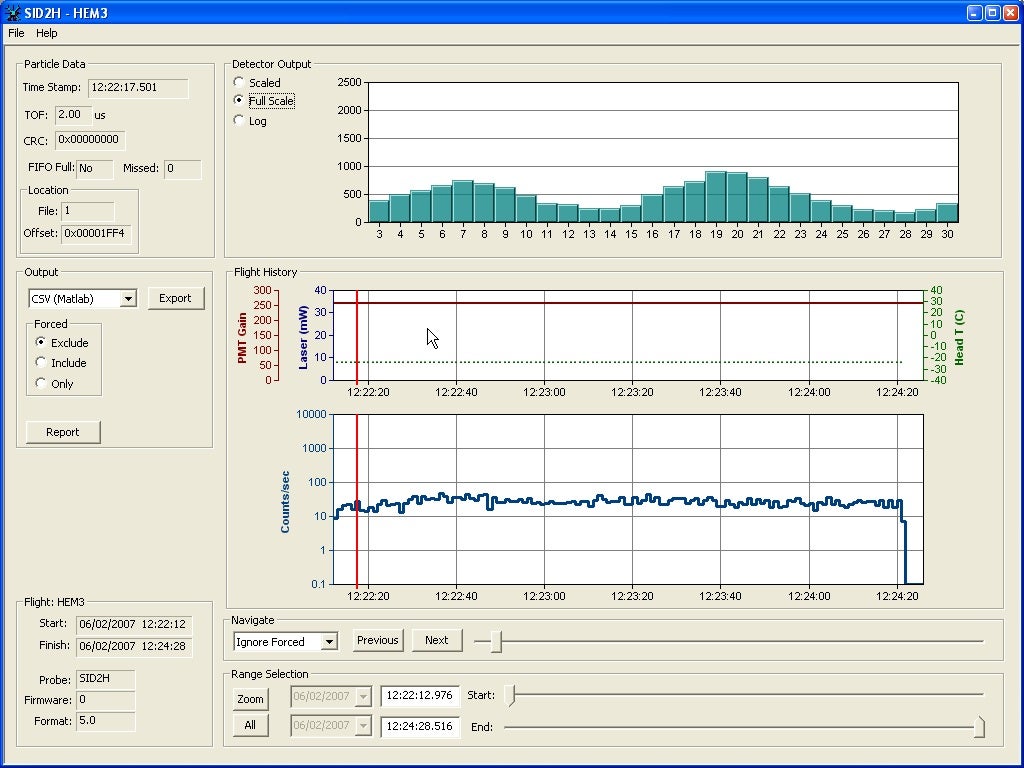
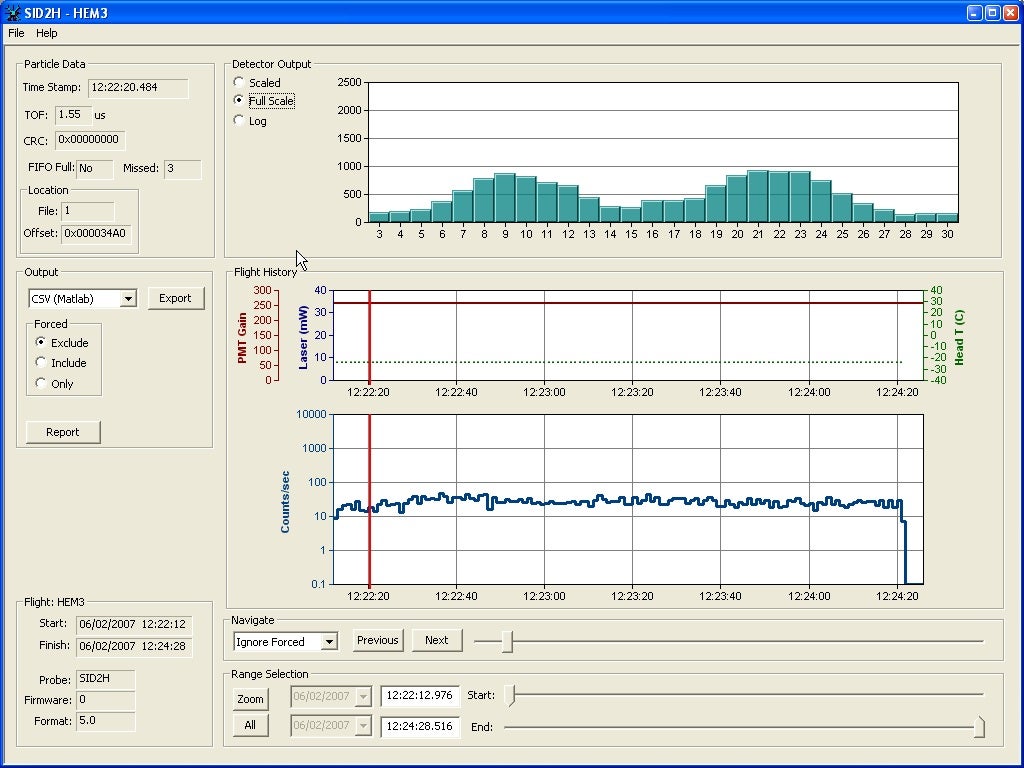
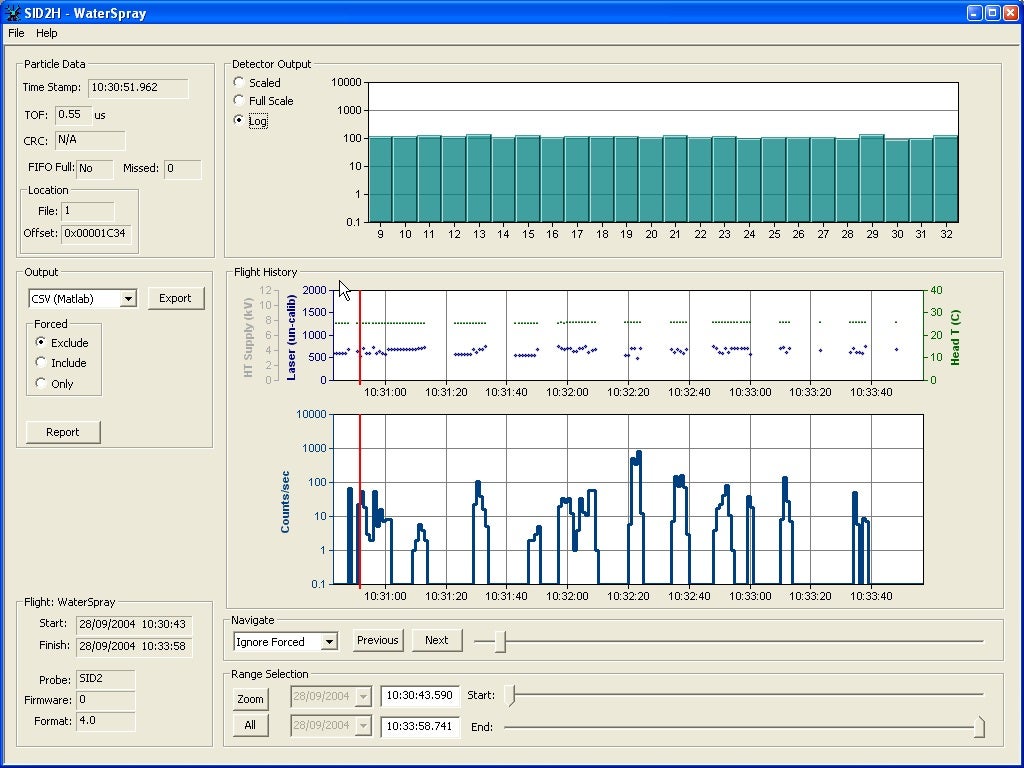
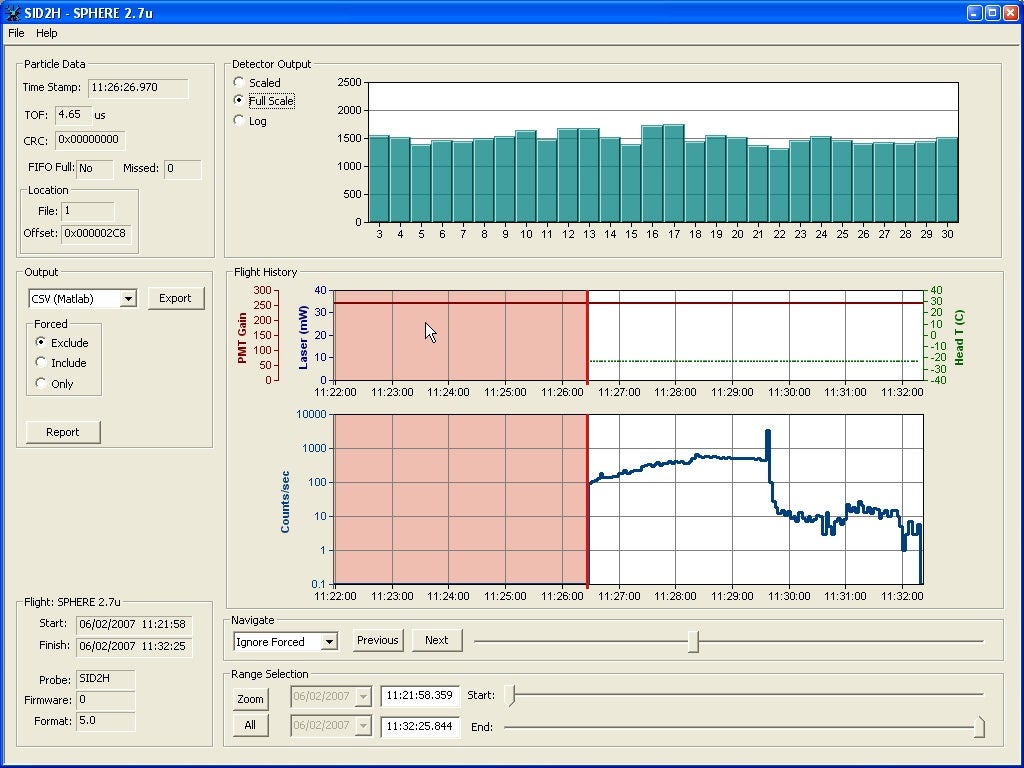
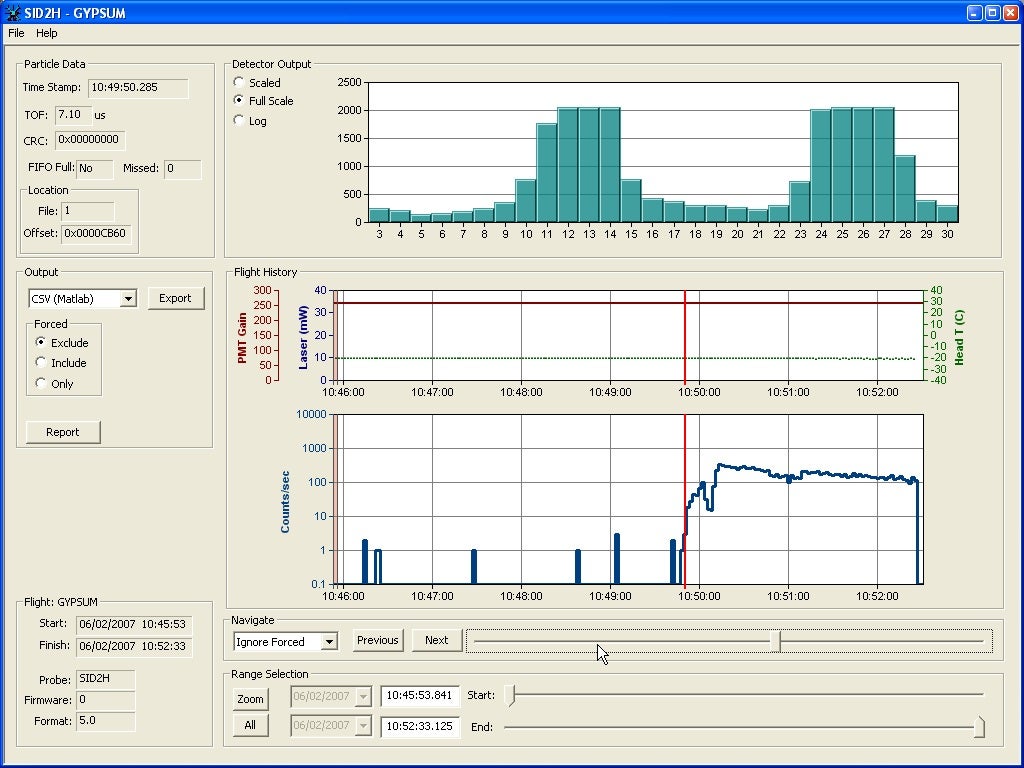
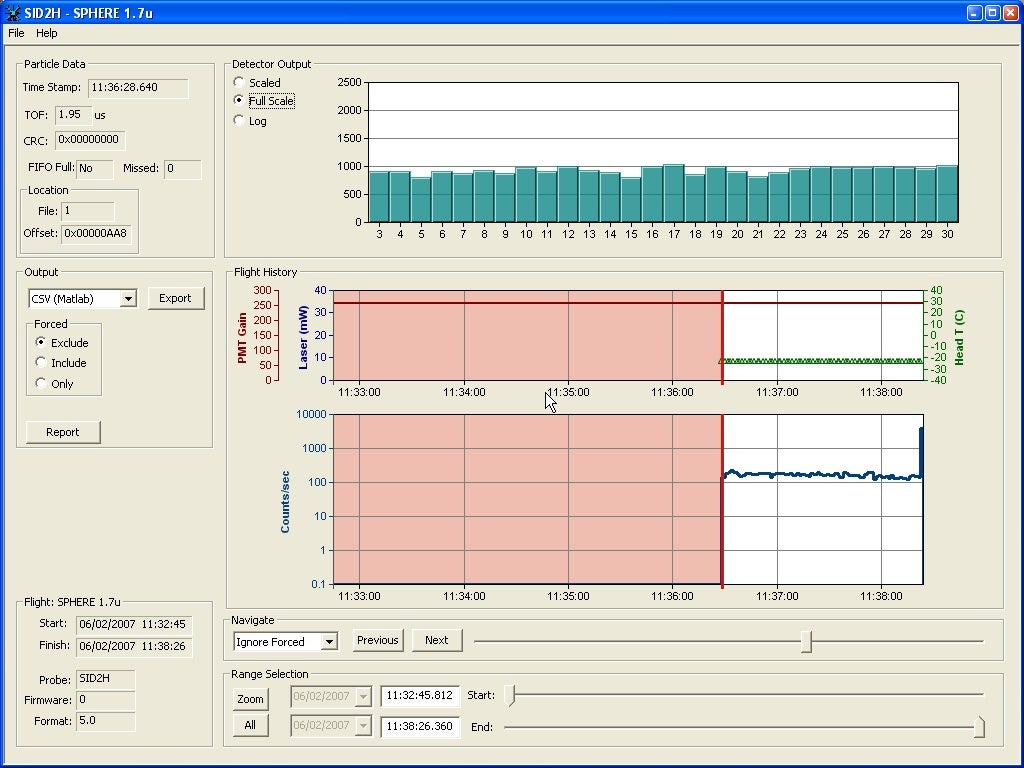
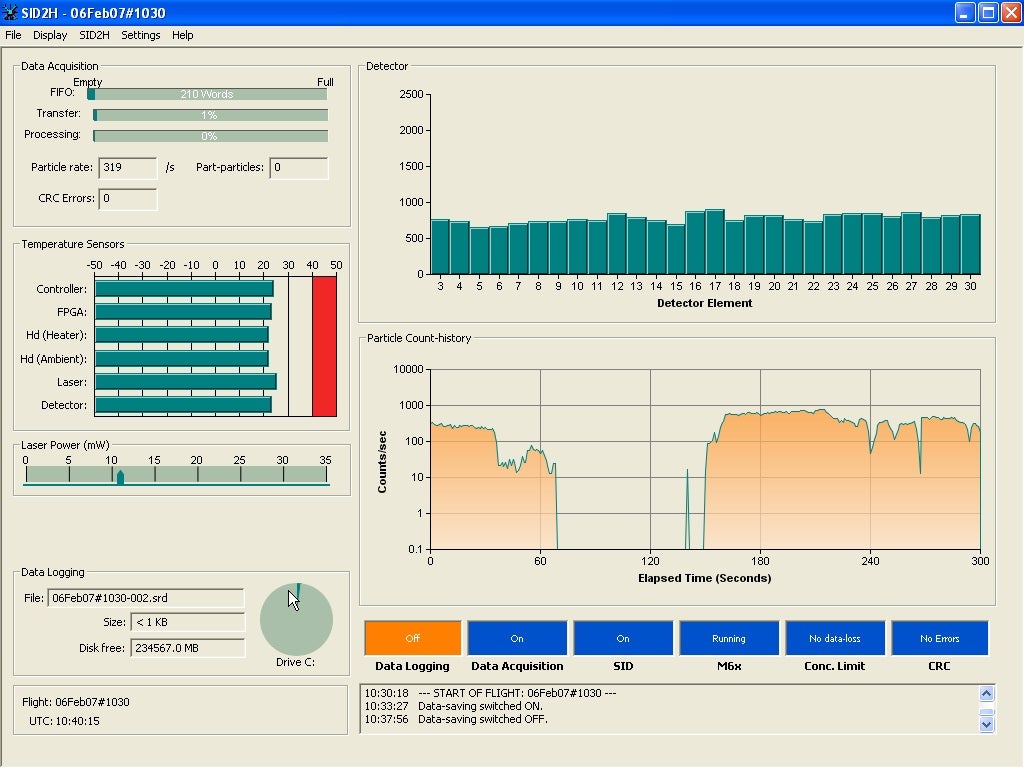
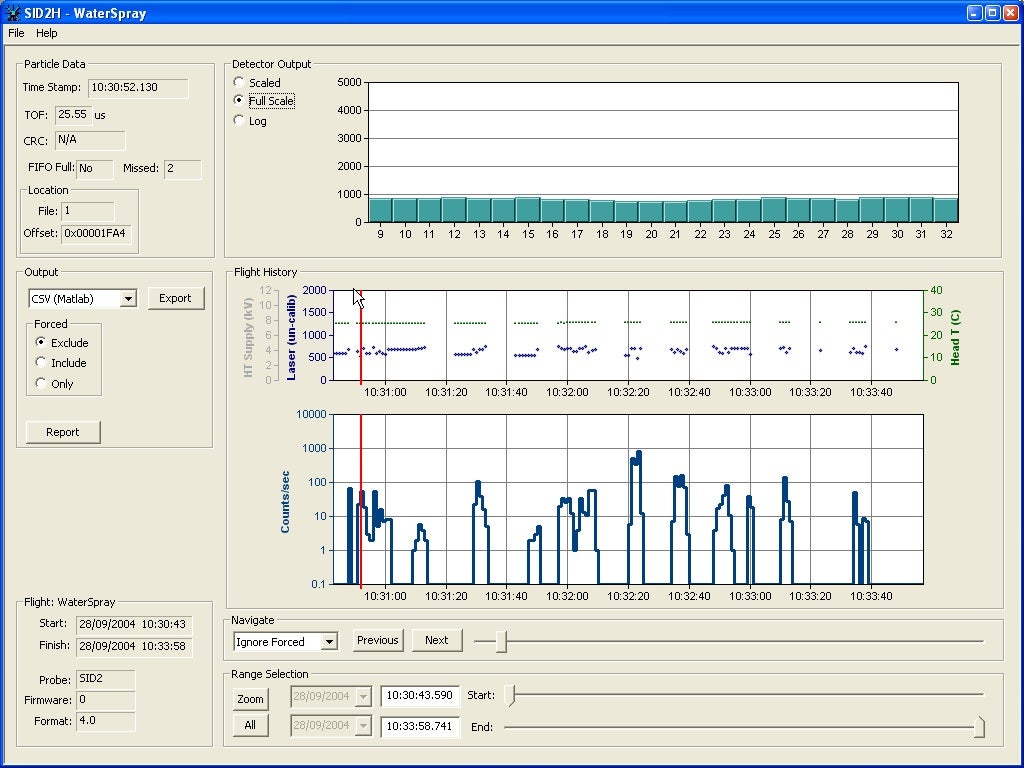
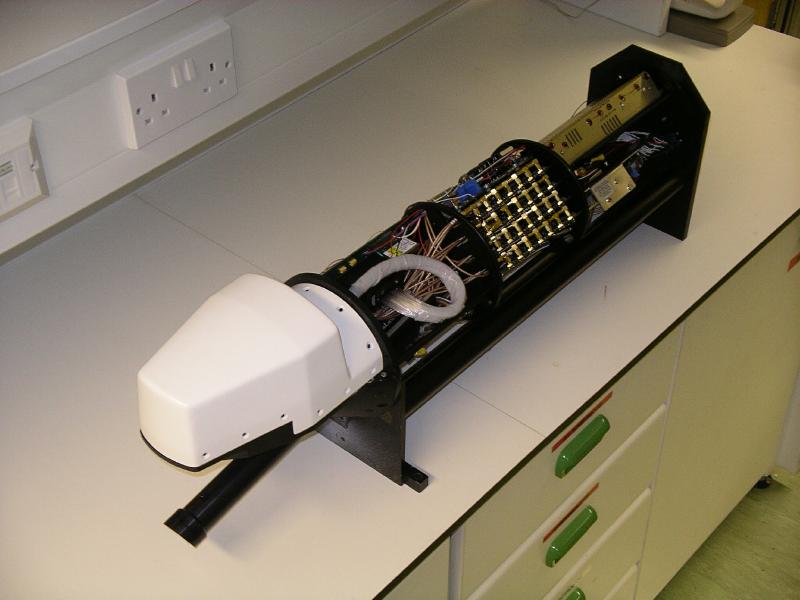
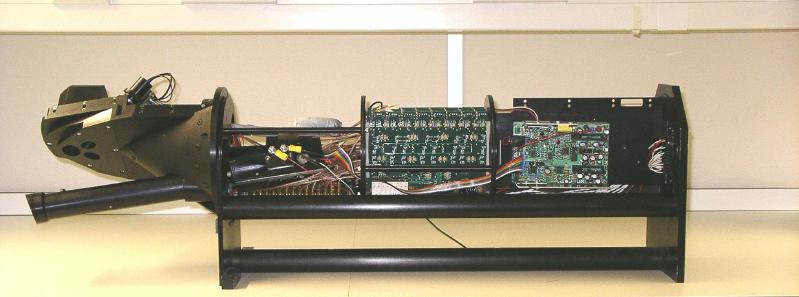
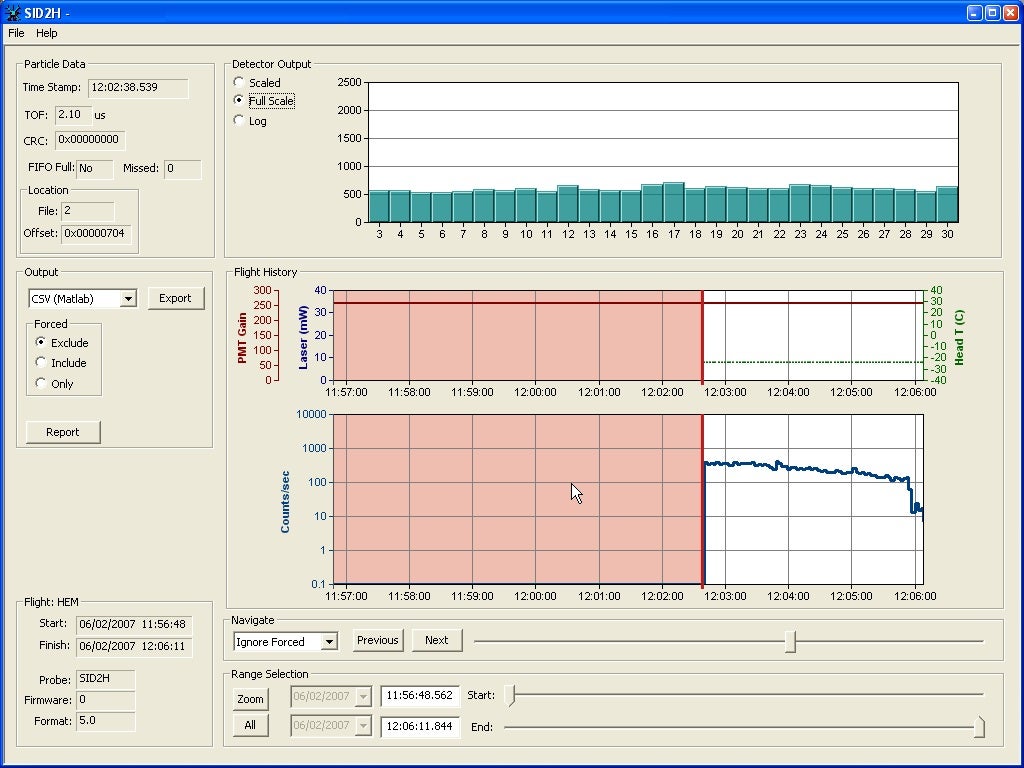
For interest I also include some screen dumps that we have recorded in the lab when testing the probe against various aerosols containing particles of fairly simple morphologies. Most of the screen dumps show the data replay screen (to be used in post-flight analysis), but one shows the in-flight screen for comparison. The aerosols we used were generated into a large ballast chamber which was then pressurised slightly to drive an aerosol stream at realistic velocities through a small nozzle towards the SID sensing volume.
The data shown in the screen dumps are raw, in other words we have yet to apply the offset values and gain correction coefficients (these will be automatically applied in real-time in the delivered probe). The ‘offsets’ are to correct for very small dc values for each detector channel that arise from slight variations in the switch capacitance of each sample-and-hold chip. The ‘gain-coefficients’ are to correct for slight differences in the gains of 32 PMT channels. Both are systematic and can therefore be corrected for.
The ‘particle shape’ histogram data for the 1um, 1.7um, and 2.7um PSL (polystyrene latex spheres) are, as one would expect, essentially equal in magnitude. The variations that do appear are largely due to the offset and gain correction factors which in these examples were set arbitrarily to 0 and 1 for every channel. The final histograms should be smoother for spherical particles.
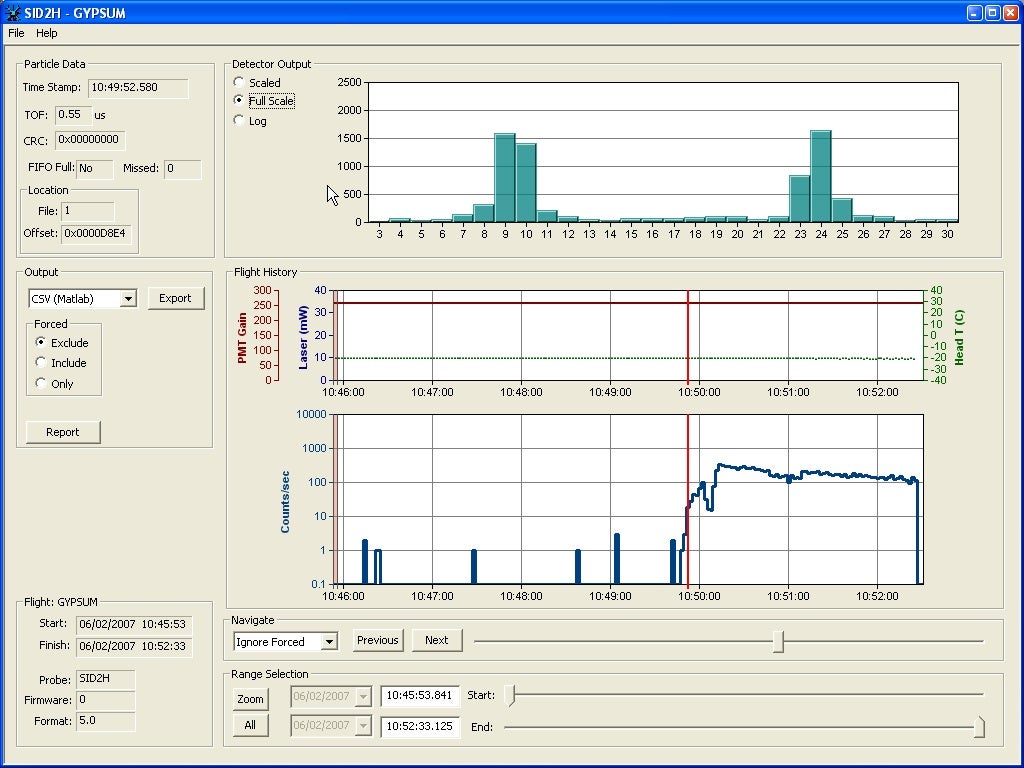
histogram is single particle data so it gives the observer the opportunity to see at a glance whether the particle is spherical (ie: all histogram elements equal) or some more complex shape (as illustrated by the gypsum and haematite examples). The red line is a feature Richard has built into the software. It defines the exact time that the particle data shown in the histogram was recorded. You can use the line to scan through the datafile forwards and backwards and see visually the type of particle shapes that were present in the cloud.
The ‘gypsum’ examples are from calcium sulphate fibre particles (a rough approximation to columnar ice crystals). These have sizes from a couple of microns in length and sub-micron diameter, to ~10+ um length and 1-2 um diameter. I have included one of each size, and you can see that at the PMT gain setting we were using, a few of the channels for the largest particle are saturated. You will have software control over the PMT gain setting so if saturation becomes a problem you can reduce the gain accordingly. Note that both patterns are characteristic of what you get with elongated particles, ie: two peaks caused by the narrow band of scattering emanating roughly perpendicular to the particle’s long axis. If the particle lies in the plane perpendicular to the laser beam, the scattering bisects the detector ring and the separation of the peaks is 180 degrees of azimuth. If the particle is angled away from this plane the peak separation becomes asymmetric, say 140 and 220°, depending on the inclination of the particle. (Essentially the particle scattering is a conic section).
For interest I have attached a couple of scattering patterns from micrometre-sized water droplets too since these are what you will be seeing in the field.
(ps: in the in-flight display screen, ignore the laser power reading. We have yet to add in the calibration factor. Done next week. The actual laser power at the scattering volume is >100mW).
The ‘Hem’ examples are from Haematite particles grown under forced hydrolysis. These are ellipsoidal particles ~2um length and 1 um diameter. You can see that the lower aspect ratio of these compared with the gypsum particles results in broader scattering peaks. (ie: it is possible to estimate the particle asymmetry from the peak width).
Hope you find these pictures of interest. Overall, the probe seems to be working well.
