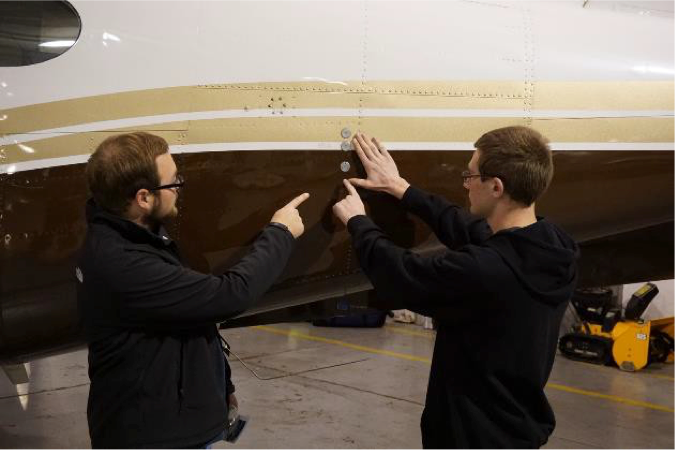
Aircraft rely on a static pressure sensor to determine airspeed and altitude from measured pressure outside the aircraft. Figure 29 shows two students identifying the location of the static pressure port on the King Air before the RF10 mission on 14 NOV 2017. The dynamic (ram) pressure data is obtained from the pressure transducer on the tip on the gust probe on the nose boom as illustrated in Fig. 30. There are static pressure ports on the nose boom as well (see Fig. 30), but they are not used in this analysis.
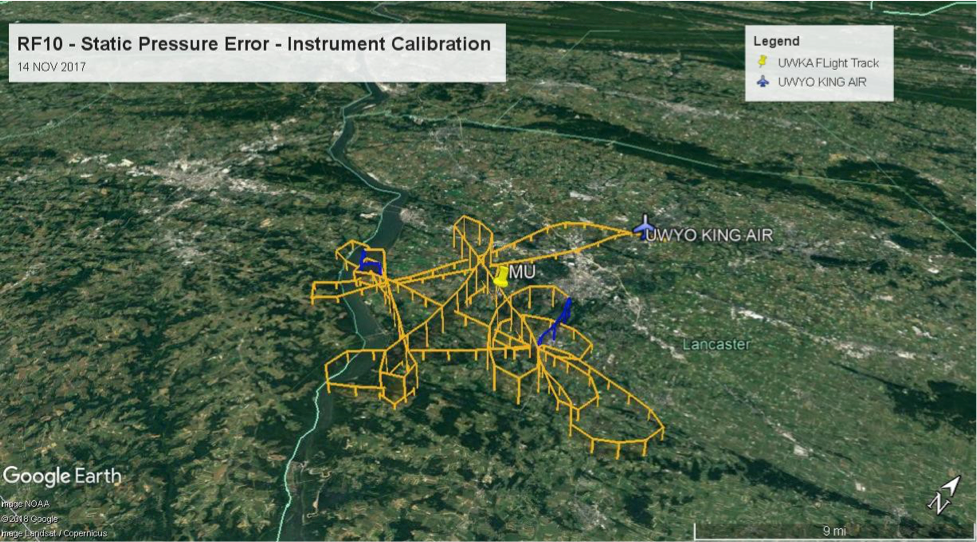
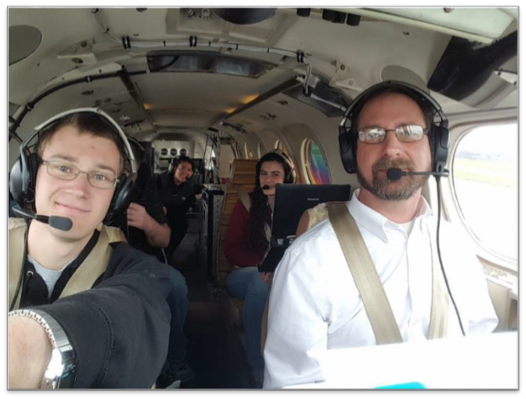
The static pressure measurements contain an inherent error or defect due to the turbulence fluctuations that impact the static pressure ports. Using data obtained during a specialized series of flight maneuvers of the UWKA, mathematical algorithms are being developed that will model the relationship between the variability in static pressure measured at the static port as a function of aircraft parameters pitch, roll, yaw, and airspeed. Statistical methods will be employed to quantify and reduce the uncertainty to a minimum. An algorithm can be used as an alternative in place of more expensive and time-consuming methods of static defect determination such as the trailing cone or tower fly-bys. The flight pattern was designed by the students, project scientists, and the UWKA crew, including the pilot (Fig. 31). The flight pattern is one of the more arduous and taxing on the crew. Students were informed before flying that in all likelihood they would experience some degree of motion sickness, and they did, but they deplaned smiling and enthusiastic.
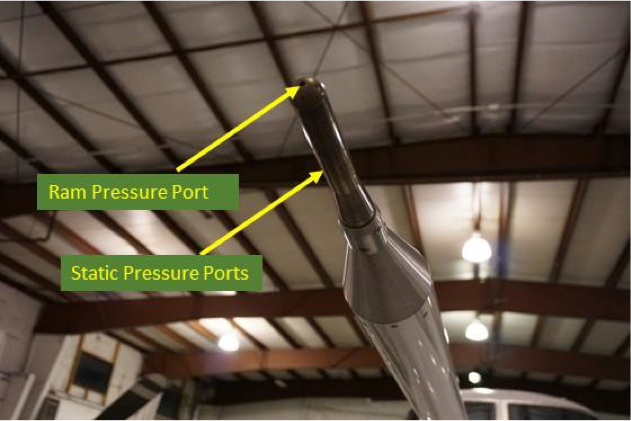
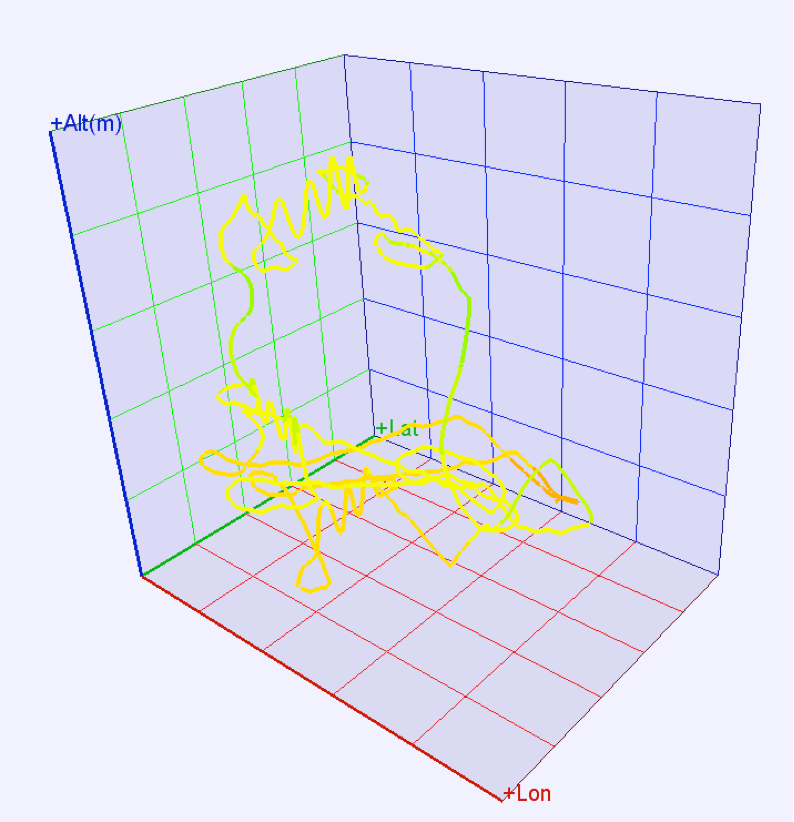
To determine fluctuations in static pressure defect, the UWKA research aircraft performed a series of variations in aircraft parameters along three spatial axes to isolate the effects of each maneuver. Pitch, yaw (heading), and airspeed were varied through a full range of aircraft motion for two minutes each at three different altitudes. The aircraft measures static pressure using two independent Rosemount 1501 High Accuracy Digital Sensing (HADS) pressure ports, two each for pilot and copilot systems, and a Weston digital vibrating cylinder pressure system. Static pressure ports are mounted aft of the wings on the fuselage (Fig. 29) and on the gust probe (Fig. 30), with each system having a static pressure port on each side of the aircraft. Data was collected at 100 Hz temporal resolution.
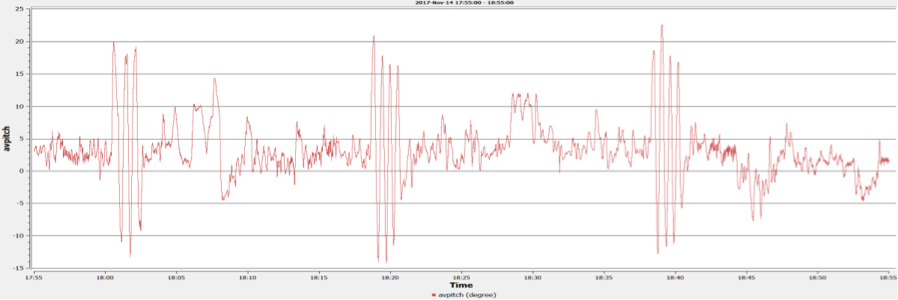
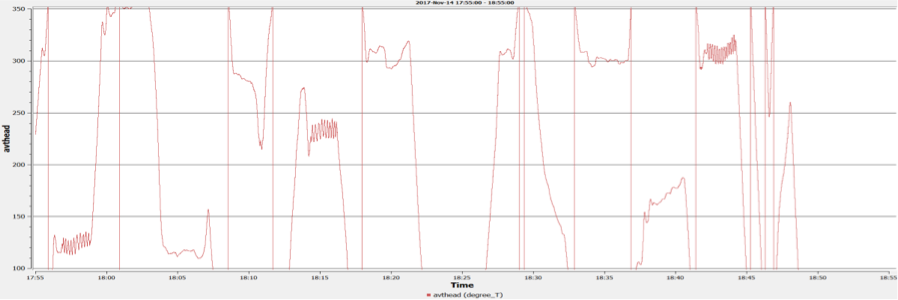
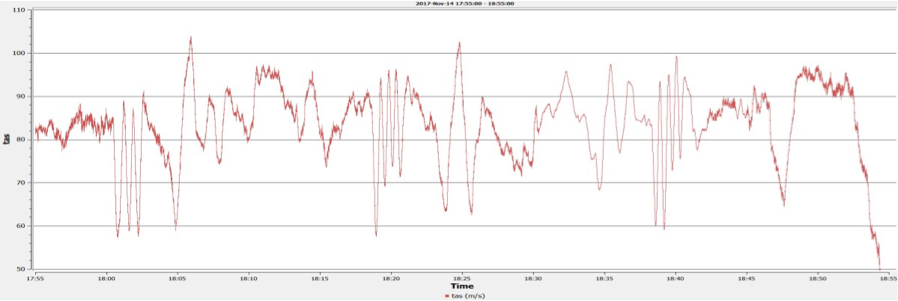
Time series of aircraft parameters pitch (Fig. 34), yaw or heading (Fig. 35), and true airspeed (Fig. 36).
Atmospheric conditions during the flight were stable, featuring light winds and a thin stratus layer with a ceiling of 4000 ft. Each aircraft parameter was varied according to the flight plan at 1000 ft, 3000 ft, and 7000 ft AGL, and with different headings to capture variability caused by wind direction and altitude. The flight pattern followed a diamond shape with orthogonal bisecting flight legs and 270° turns at each vertex, with only minor deviations due to conflicting air traffic. The next step in this study will be to use the data collected during RF10 to develop an empirical model of the static pressure defect using a multidimensional polynomial and regress the coefficients.