PHOENIX-78
PHOENIX 1978
The name PHOENIX was chosen because the convective Planetary Boundary Layer (PBL), like the bird of mythology, rises anew each day out of the “ashes” of the PBL from the previous day.
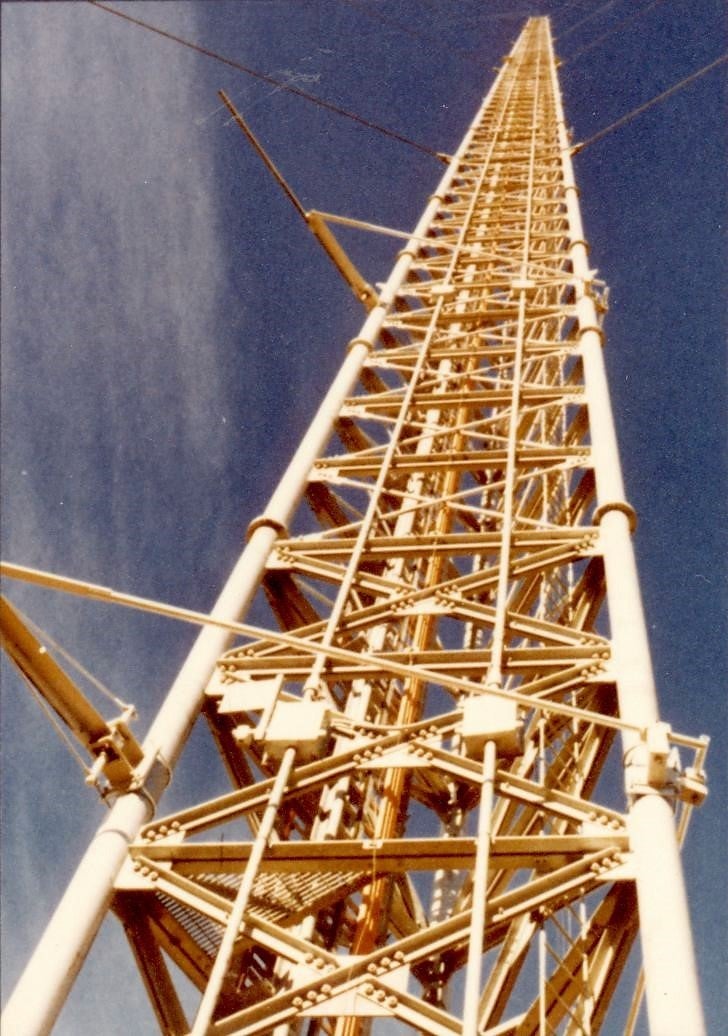
The PHOENIX experiment, coordinated by NOAA’s Wave Propagation Laboratory (WPL) and NCAR’s Field Observing Facility (FOF), is best understood as one step in a progressive sequence of Planetary Boundary Layer (PBL) experiments conducted in the past 30 years and expected to continue for 3 decades more. The contribution of PHOENIX is the combined use of instrumented aircraft as well as latest sophisticated ground-based remote sensing systems, such as radars, lidars, or acoustic sounders. The project encompassed an area of 100 square km centered around the Boulder Atmospheric Observatory (BAO) 300-m tall tower, located near Erie, CO, in gently rolling terrain (consisted primarily of grasses broken by small clusters of buildings and trees), perfect for conducting PBL studies while simultaneously evaluating and testing meteorological instrumentation. Major instrumentation coordinated for PHOENIX (during the month of September 1978) included the NCAR Portable Automated Network (PAM), two NCAR Queen Air instrumented aircraft, a rawinsonde, a NCAR C-band Doppler radar, and WPL X-band Doppler radars, and a variety of surface-based radiometers. In addition, other remote sensing systems (both operational and experimental) were deployed as available.
 |
EXPERIMENTAL GOALS
The PHOENIX experimental goals are categorized under three main groups: (1) Dry processes - Obtain a definitive, essentially complete, and (where possible) redundant dataset on dry PBL dynamics over the BAO terrain; (2) Moist processes – Developing a dataset on clouds, cloud processes, and cloud environments in the layer directly above the PBL; and (3) Instrument evaluation - Participating laboratories evaluated, tested, and compared the performance of a wide variety of atmospheric remote sensors. Specific studies of the PBL included the role of the PBL convection, comparison of Eulerian and Lagrangian turbulence statistics, the nocturnal PBL, low-level terrain effects, long-path, near ground statistics of aerosol distribution, and development of datasets for use by the wind-energy community.
One of the unique efforts by PHOENIX was to obtain as many redundant independent atmospheric variable measurements as possible to better compare and evaluate the discrepancies between instruments, calibration issues, and data processing routines. All these ancillary efforts help to create a more quality controlled and accurate dataset for use in PBL studies.
PROJECT OPERATIONS
In the course of PHOENIX, tower measurements at the BAO site were recorded in either one of two modes. During times when the multiple Doppler X-band radars and the NCAR aircraft were recording, tower data was recorded at a 1 or 10 Hz rate. In the alternate mode, only 20-min summary data were recorded. As a rule, radar operations coincided with other PHOENIX operations, primarily the flights of the aircraft. Radiometer operations were from 0600 to 1400 MDT each day from 5 to 28 September, excluding weekends.
 |
 |
 |
OBSERVATIONS/DATA
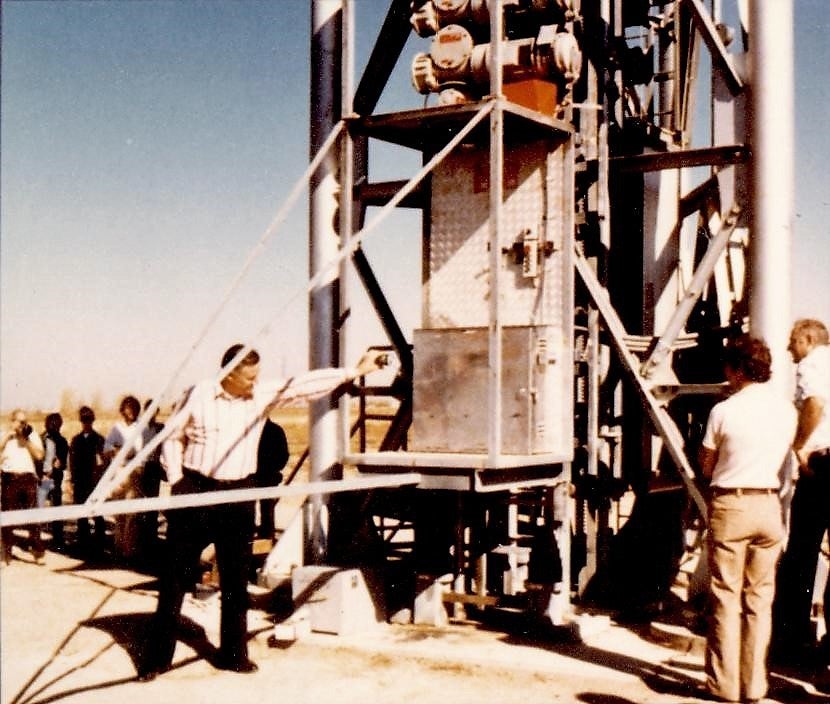
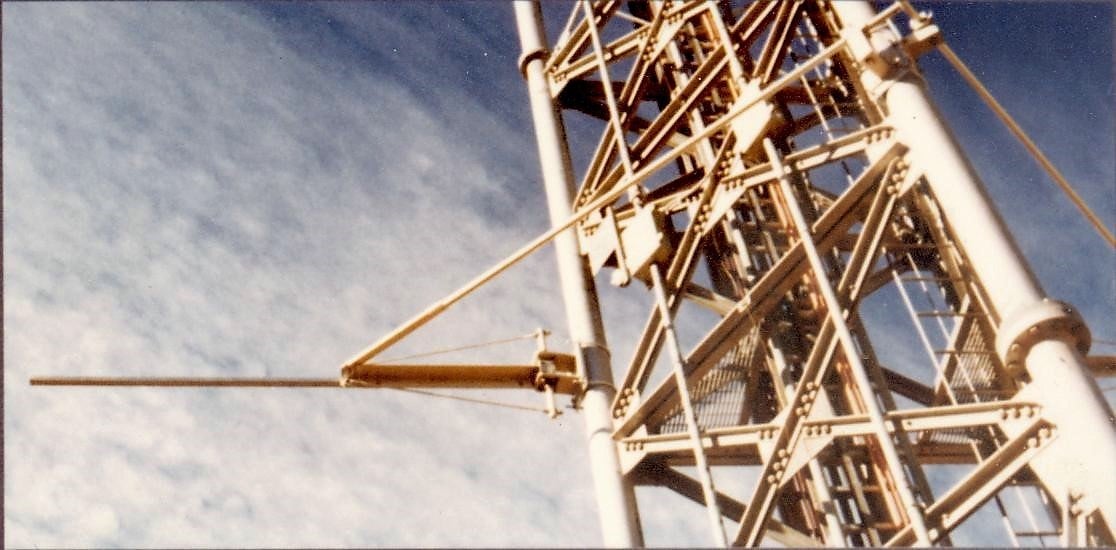
The BAO tower was identically instrumented at eight (8) fixed levels (heights of 10, 22, 50, 100, 150, 200, 250, and 300 meters). It consisted of sonic anemometry and conventional wind sensors, platinum wire and quartz thermometers for mean and temperature fluctuations, and cooled mirror hygrometers for relative humidity. In addition, surface measurements included pressure, solar radiation, acoustic Doppler (winds), and a microwave radiometer.
A network of 27 NCAR PAM surface stations were deployed around the BAO tower site, spaced approximately 1 mile apart (area of coverage approx. 100 square km). In addition, NOAA/WPL operated a microbarograph array (200-m on a side) at the BAO tower site.
NCAR released routine rawinsondes (GMD system) from the BAO tower site. Thirty-eight (38) releases (1 to 3 per day depending on operations) were performed from 5-28 September. Two types of Lagrangian measurements were made by NOAA/WPL including: (1) Standard 30-g neutral pilot balloons (PIBALS) tracked by double theodolites; and (2) 300-m altitude tetroons (super-pressurized polyester film bags) tracked by the WPL dual-Doppler radar system. During two periods (29 August to 1 September and 18 to 22 September), 13 tetroons and 20 PIBALS were tracked.
The NCAR C-band radar (CP-4), located to the W-SW of the tower, operated at a wavelength of 5.49 cm with a 1 deg beamwidth. NOAA operated two (2) identical X-band radars to the E-NE and E-SE of the tower with a wavelength of 3.22 cm, and beamwidth of 0.8 deg. The Doppler array formed a triangle of approx. 7-14 km on a side with the BAO tower in the middle. The NOAA radars operated in “Coplan” mode while CP-4 operated most of the time in constant elevation mode. In addition, the mobile NOAA/WPL 10-cm FM-CW radar as well as the 8-mm TPQ-11 cloud radar operated at the BAO tower.
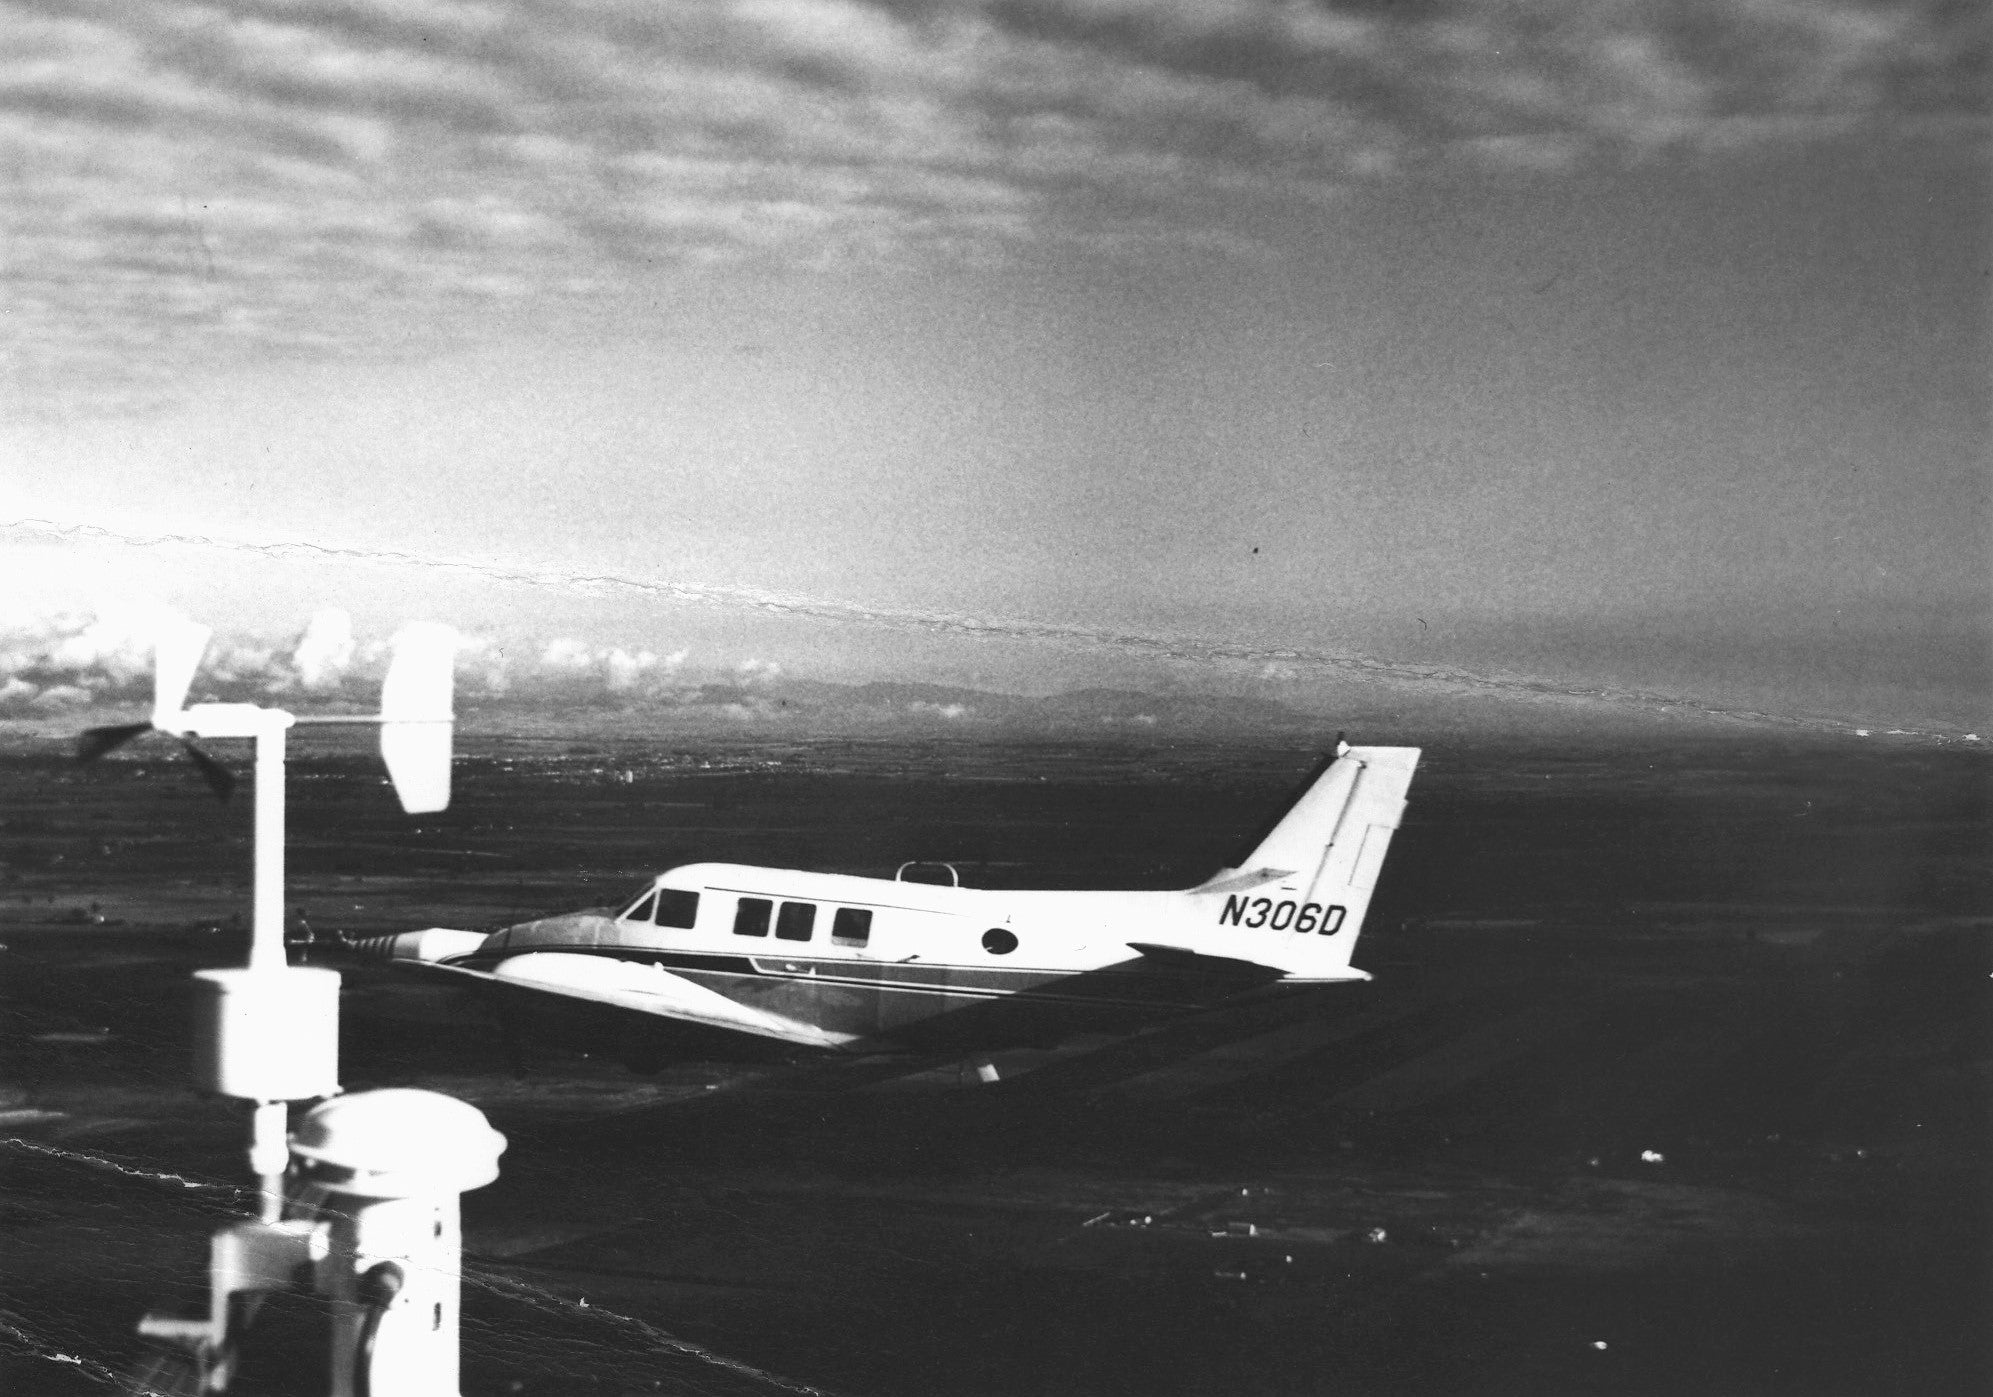
Two NCAR Queen Air Aircraft flew 4 basic flight patterns during PHOENIX: (1) Flux; (2) Sounding; (3) Cross-section; and (4) Mountains. Multiple flights were flown on a total of 9 days, primarily 0900 to 1600 MDT (prior to 21 September), and 0900 to 1900 MDT (on and after 21 September).
The NASA/JPL Scanning microwave spectrometer (SCAMS) and Nimbus E microwave spectrometer (NEMS) were ground-based 5-channel radiometers located at the BAO tower. They were co-located with the NOAA Microwave Temperature Sounder (MTS), a 12-channel radiometer identical with corresponding channels of the SCAMS. In addition, a NOAA/WPL pulsed ruby lidar system and various acoustic echo sounder systems operated at the BAO tower site.
NOAA/WPL deployed two triangular arrays of optical sensors for measurement of surface-level convergence and divergence. The smaller triangle was equilateral (450 m on a side) at the tower site, while the larger one was NE of the BAO site with triangle legs of approx. 6 km.
| Aircraft | NCAR Queen Air aircraft (Tail numbers N304D and N306D) |
|---|---|
| Lidar | NOAA/WPL pulsed ruby lidar system |
| Radar | NCAR C-band (CP-4) deployed E-SE of BAO tower site |
| Radar | Two (2) NOAA X-band radars deployed E-NE and E-SE of the BAO tower site |
| Radar | NOAA/WPL FM-CW 10-cm mobile radar and TPQ-11 8-mm cloud radar deployed at the BAO tower site |
| Radiometer | NASA/JPL SCAMS Radiometer at BAO tower site |
| Radiometer | NOAA MTS Radiometer at BAO tower site |
| Photography | All-sky camera at the BAO tower site |
| Surface | Two (2) triangles of NOAA/WPL Optical wind sensors |
| Surface | 27 NCAR PAM station network |
| Surface | NOAA/WPL Microbarograph array at the BAO tower site |
| Upper Air | NCAR rawinsonde releases from the BAO tower site |
| Upper Air | NOAA/WPL neutral buoyancy pilot balloons released from the BAO tower site |
| Upper Air | NOAA/WPL 300-m altitude tetroons |
| Upper Air | NOAA/WPL Various acoustic sounding systems located at the BAO tower site |
NETWORK MAPS
 |
 |
|
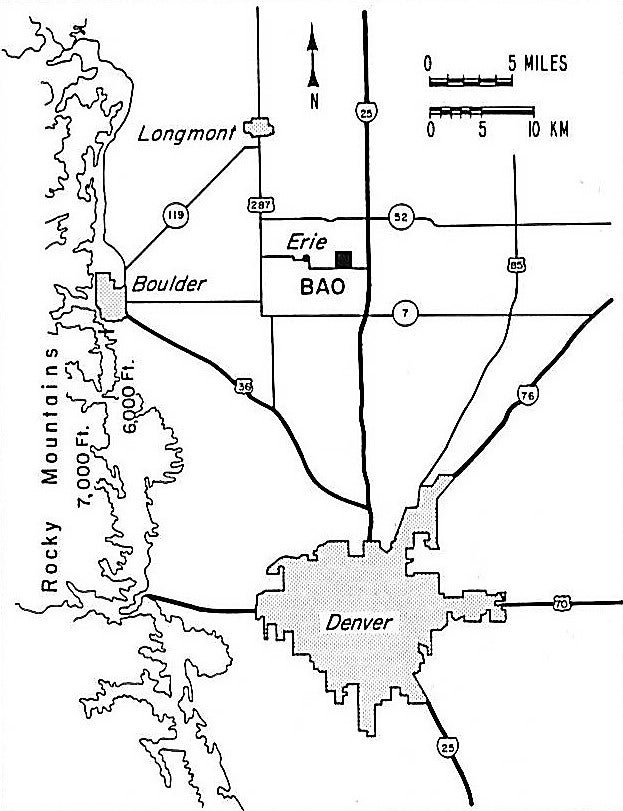
Map showing the geographical area of the PHOENIX Project
|
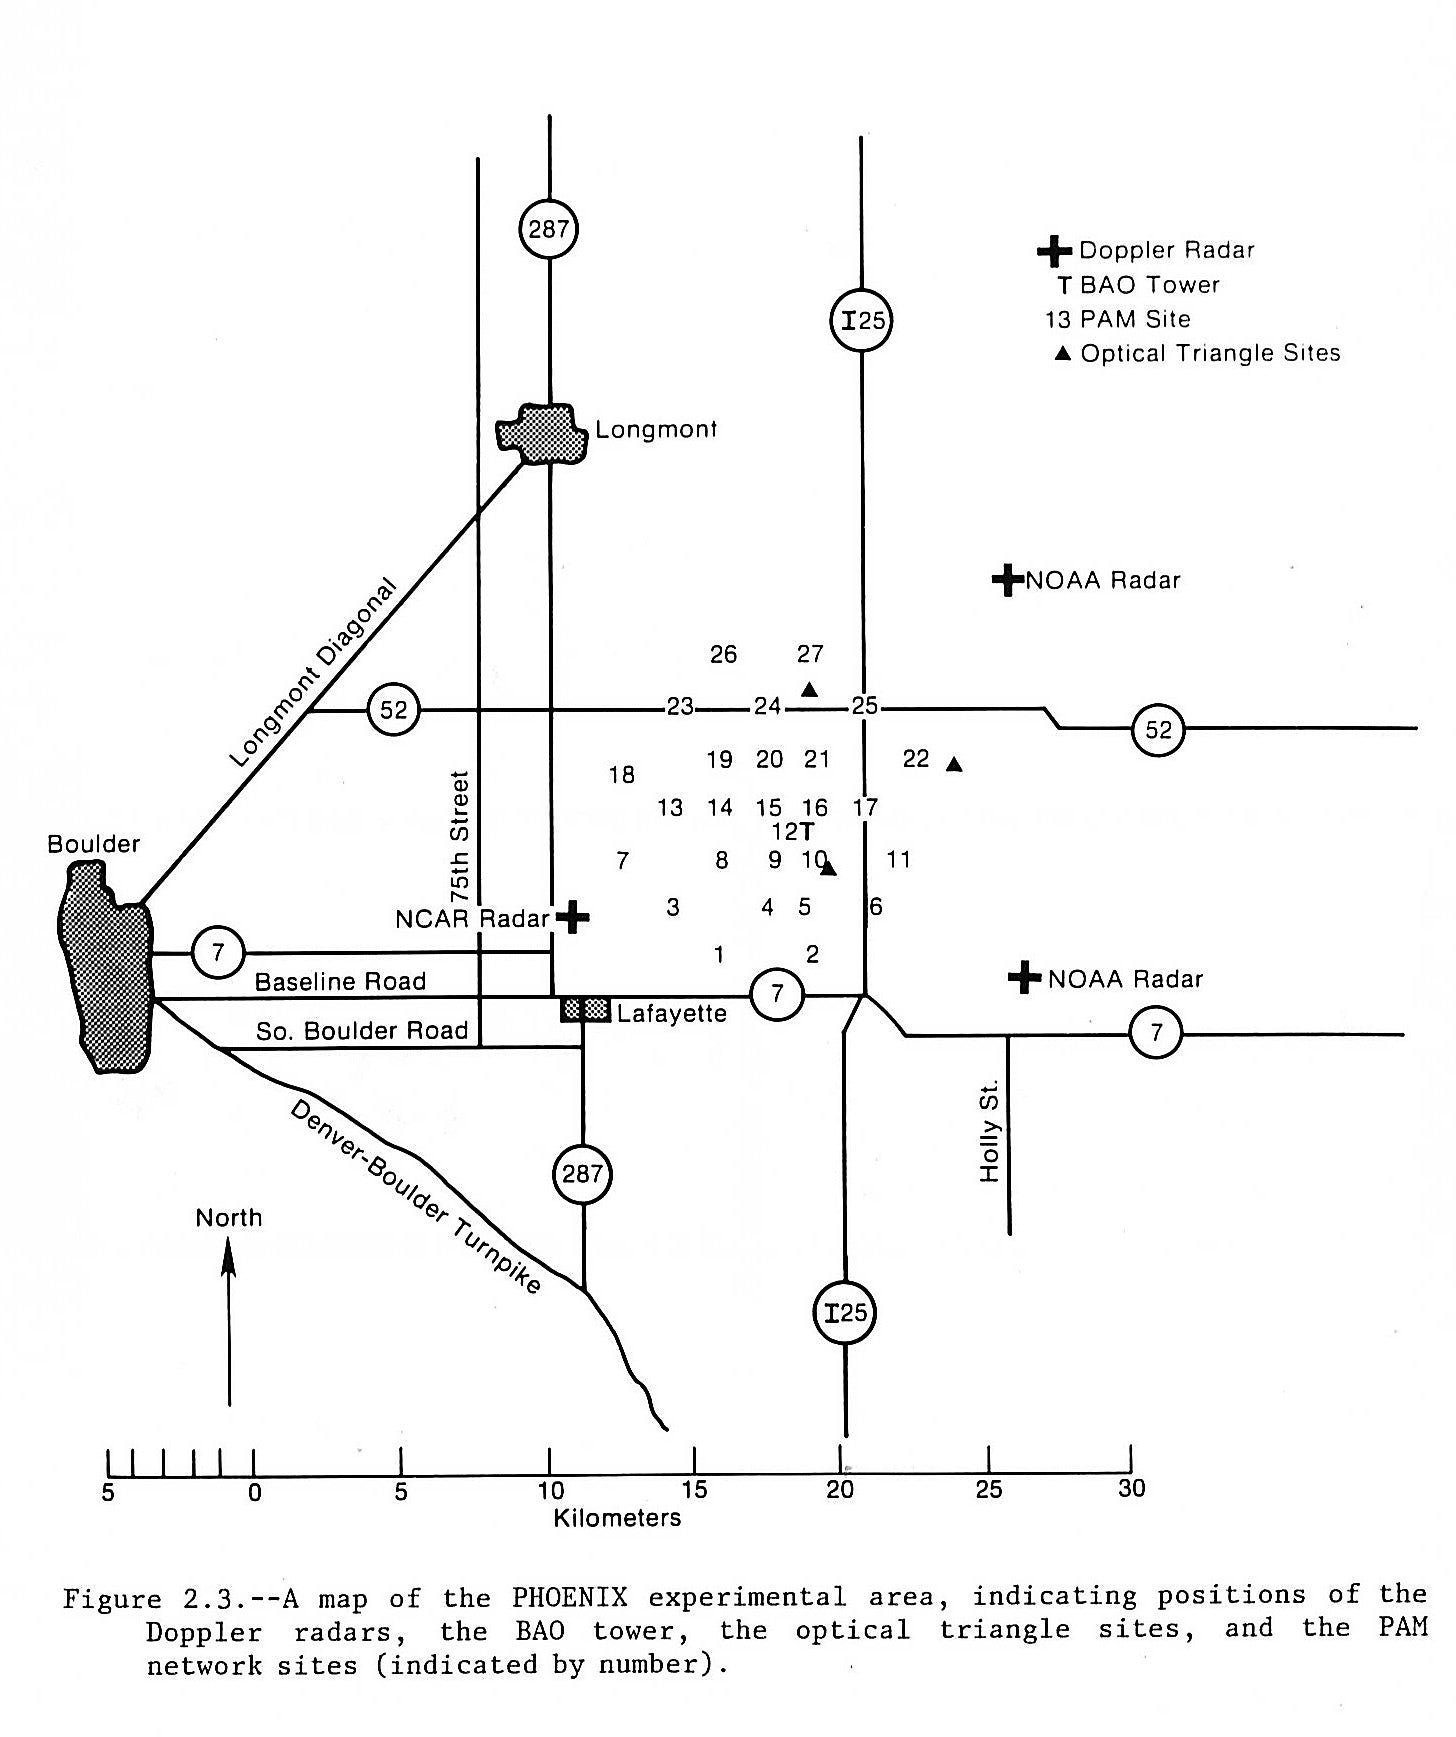
Map of the PHOENIX Project Network, indicating positions of the Doppler radars, the BAO Tower, the optical triangle sites, and the PAM network sites (indicated by number)
|
Photo gallery (click images for full resolution):