JASIN
Joint Air Sea INteraction experiment
The Joint Air Sea INteraction (JASIN) project was an International project to study the interaction of the atmospheric and oceanic boundary layers with the larger-scale motions of the sea and air as part of the Global Atmospheric Research Program (GARP). JASIN involved an intensive study (for about 2 months) of the atmospheric and oceanic boundary layers over an area of deep water in the North Rockall Trough (1000m - 2000m), located several hundred kilometers across off the northwest coast of Scotland. The JASIN domain (~150 km across), was instrumented with buoys, ships, balloons, and aircraft, to observe the structure of the layers and their interaction with the larger-scale synoptic features.
More than 50 teams of investigators from 9 countries participated, using 14 ships and 3 aircraft. There were 32 mooring systems deployed, 10 of which were within a 5 km square Fixed Intensive Array (FIA) area centered at 59°N, 12°30/W. The experiment was divided into three phases, comprising two intensive measurement periods during Phases 1 and 2, preceded by a preparatory testing period (Phase 0). Within the phases there were shorter periods when intensive measurements or intercomparisons were made with nearly all platforms involved in a particular part of the program in position. Measurements were made in a number of nested and partially nested regions with the most intensive measurements being confined to the smallest scale regions. The five study regions were defined as: (1) a Large Scale Area (LSA), - 300 km square; (2) Hydrographic Survey Area (HSA) - 150 km square; (3) a Meteorological Triangle - 180 X 180 X 220 km; (4) a Oceanographic Intensive Area (OIA) - a circle 100 km in diameter; and (5) a Fixed Intensive Array (FIA), 5 km square.
Scientific Objectives:
JASIN’s primary goals were to: (1) observe and distinguish between the physical processes causing mixing in the atmospheric and oceanic boundary layers and relate them to mean properties of the layers; and (2) examine and quantify aspects of the momentum and heat budgets in the atmospheric and oceanic boundary layers and the fluxes across and between them. The strategy was to nest both meteorological and oceanographic components.
Meteorological Component - An important aspect of the experiment was to obtain information concerning the interaction of the boundary layer with mesoscale structures that may be embedded in it or extend beyond it depending on the degree of atmospheric disturbance. The atmospheric state was classified as follows:
1) Undisturbed conditions - This situation occurred when there was a relatively shallow (<1.5 km) inversion capped boundary layer present with no clouds or clouds only associated with the inversion such as stratocumulus and cumulus humilis. In this case the mesoscale structures such as plumes, helical rolls, and convective cells were effectively part of the boundary layer structure.
2) Moderately disturbed conditions - When the organized convection penetrated through the boundary layer and extended well beyond it, the interaction between the boundary layer and the mesoscale system became much more complex. The plan was to study cases in this category that can be clearly identified from satellite imagery or by other means.
3) Fronts - A special effort was made to study the structure of the boundary layer before, during, and after frontal passages. The selected fronts were well defined and passed the array in a relatively short time frame.
Oceanographic Component - Many factors influenced the development of the upper ocean boundary layer, including the wind, surface heating and cooling, the surface and internal wave fields, the stability of the underlying thermocline, frontal and intrusive structures in the thermocline, mesoscale deep ocean eddies, and tides. Each factor separately produced substantial variability on much the same vertical scales, up to the mixed layer depth, and on horizontal scales from a few meters to hundreds of kilometers. Because of the complexity of these phenomena and because of the difficulties of making measurements in the surface layers in the presence of surface waves, the understanding of the upper-ocean structure is poor. Through careful comparisons and joint analyses of the different data sets, it will be possible to identify the contributions of each of the phenomena to the creation and maintenance of the structure of the mixing layer and seasonal thermocline.
Project Operations and Observations:
 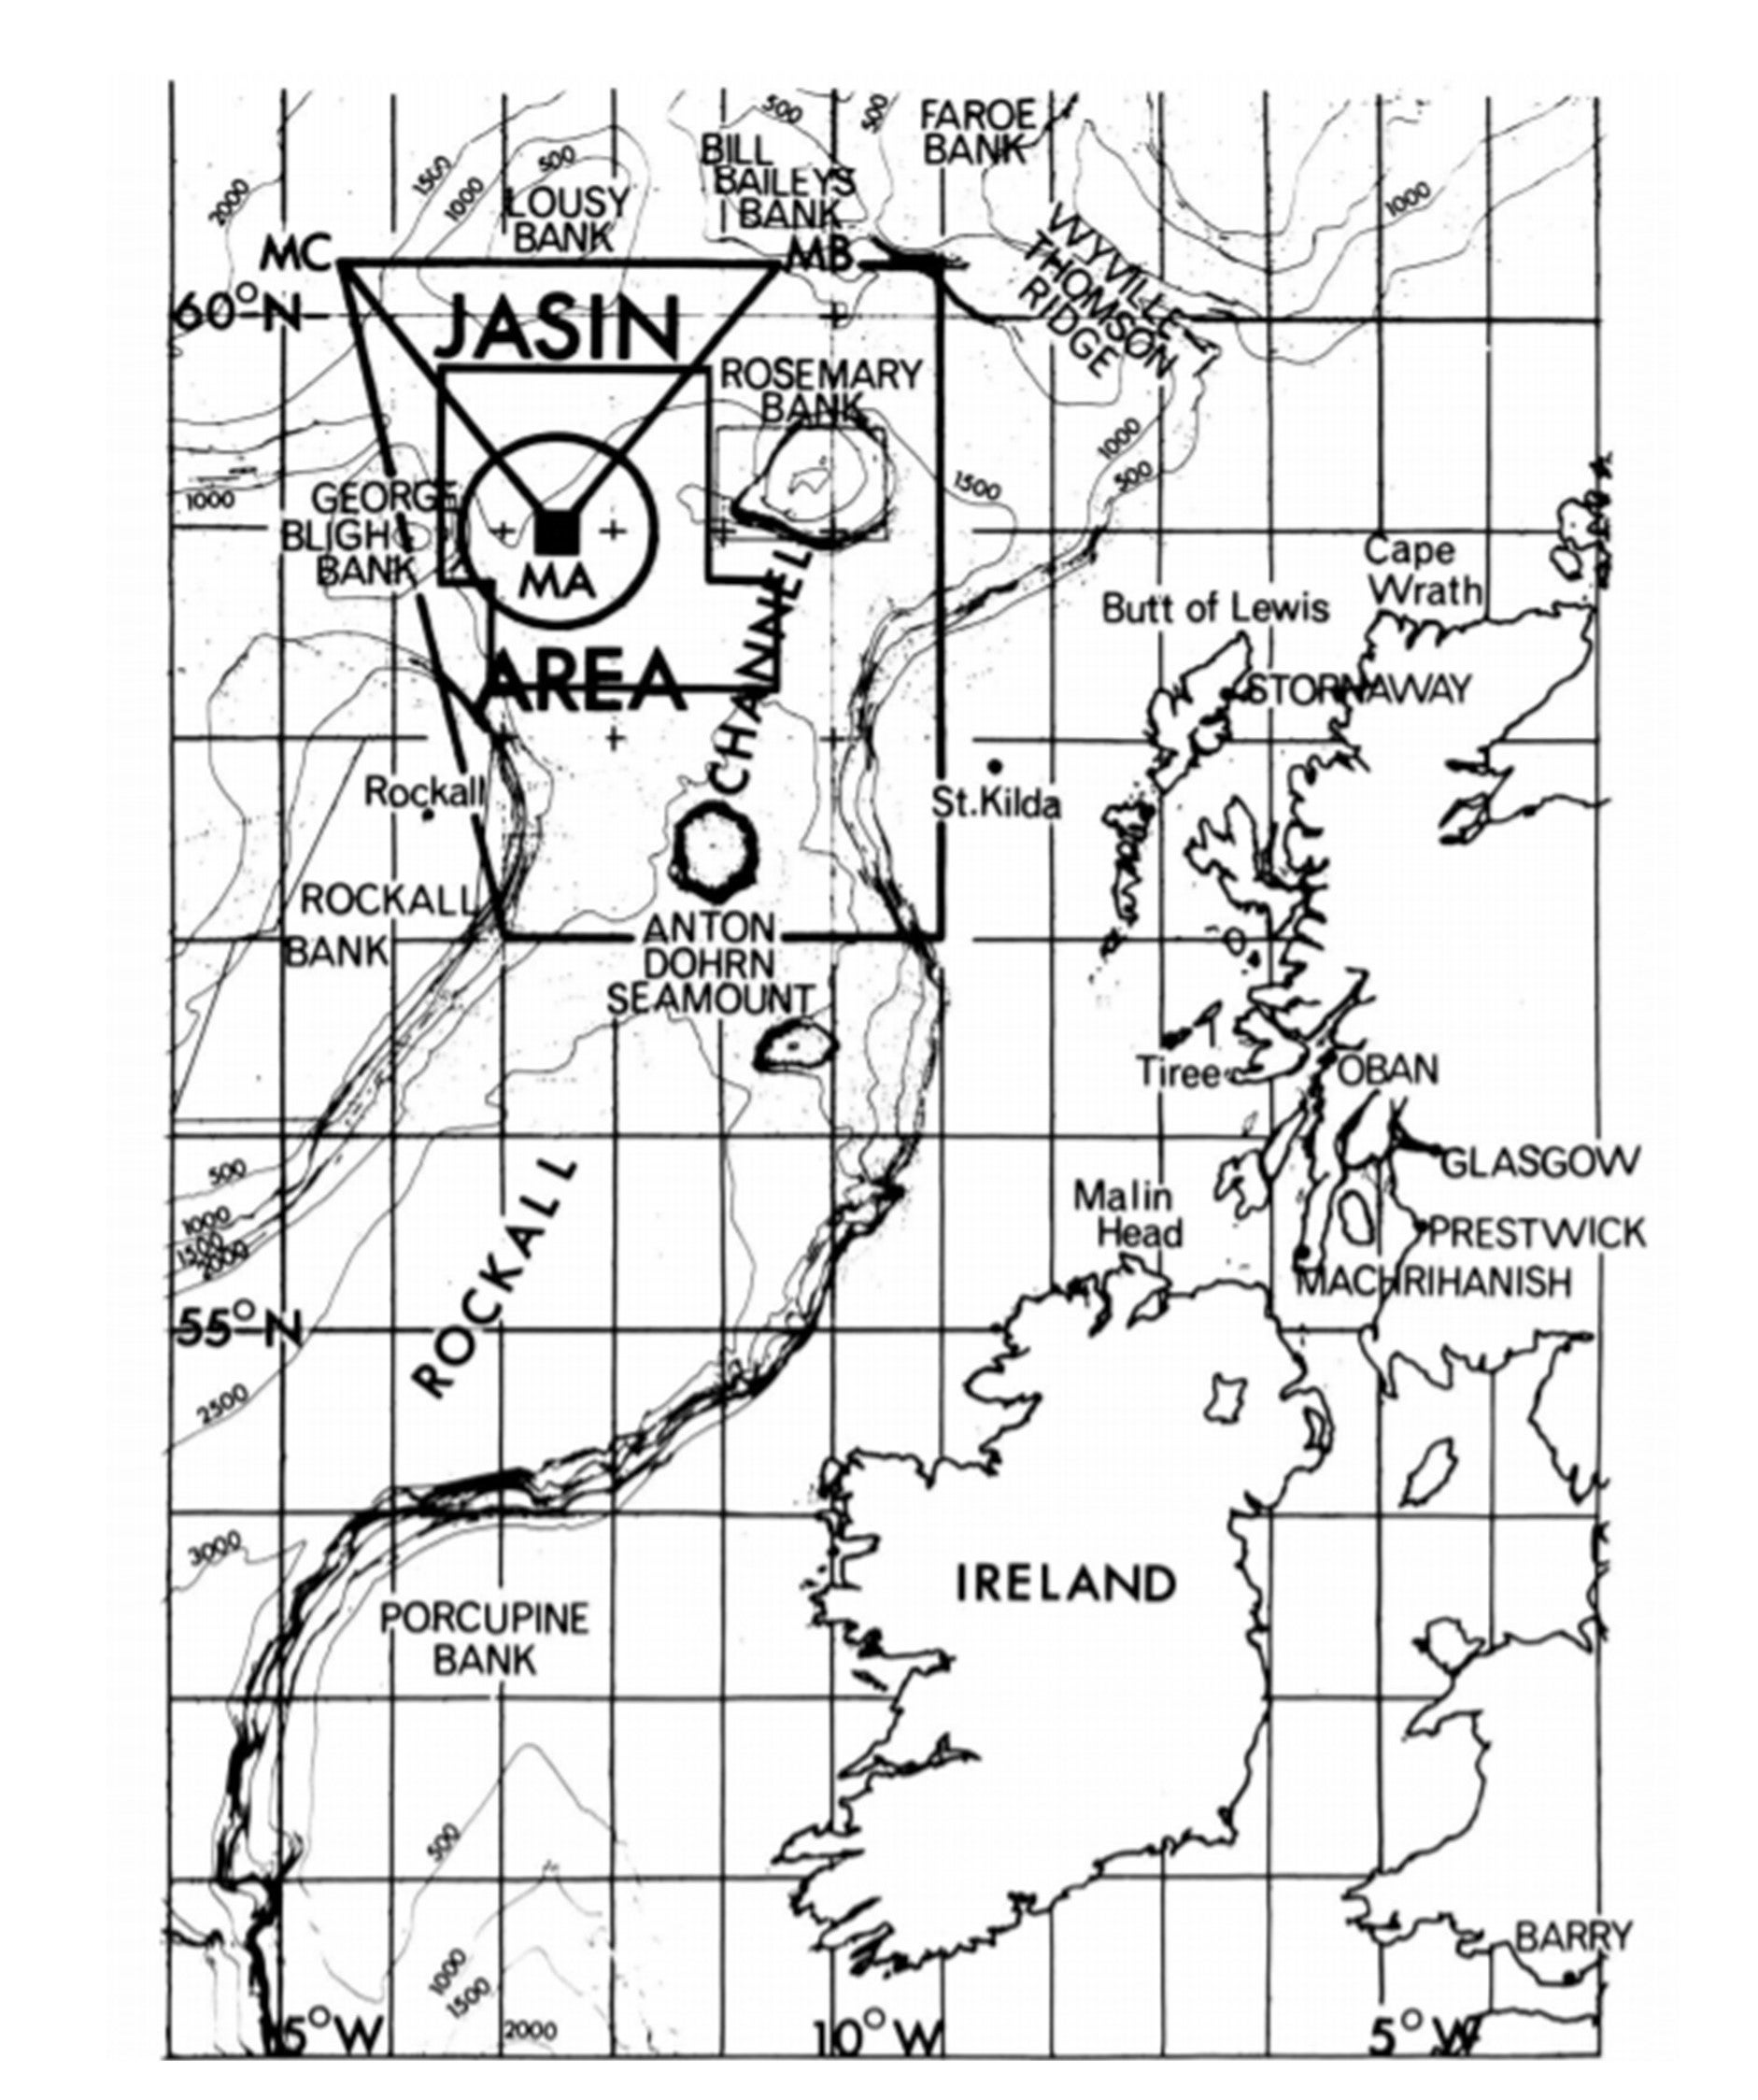 |
Figure 1: The JASIN area in relation to the British Isles. Bathymetry is shown with depth in meters. Bases for ships (Glasgow) and aircraft (RAF Machrihanish) are also given. Five partially nested experimental areas are depicted: Large Scale Area, ~300 km square (the outer quadrilateral); Hydrographic Survey Area, 150 km square (the Z-shaped area); Meteorological Triangle, 180 X 180 X 220 km (triangle MA, MB, MC); Oceanographic Intensive Area, the 100 km diameter circle; and the Fixed Intensive Array, a 5 km square in the center of the OIA (59°N, 12°30'W).
 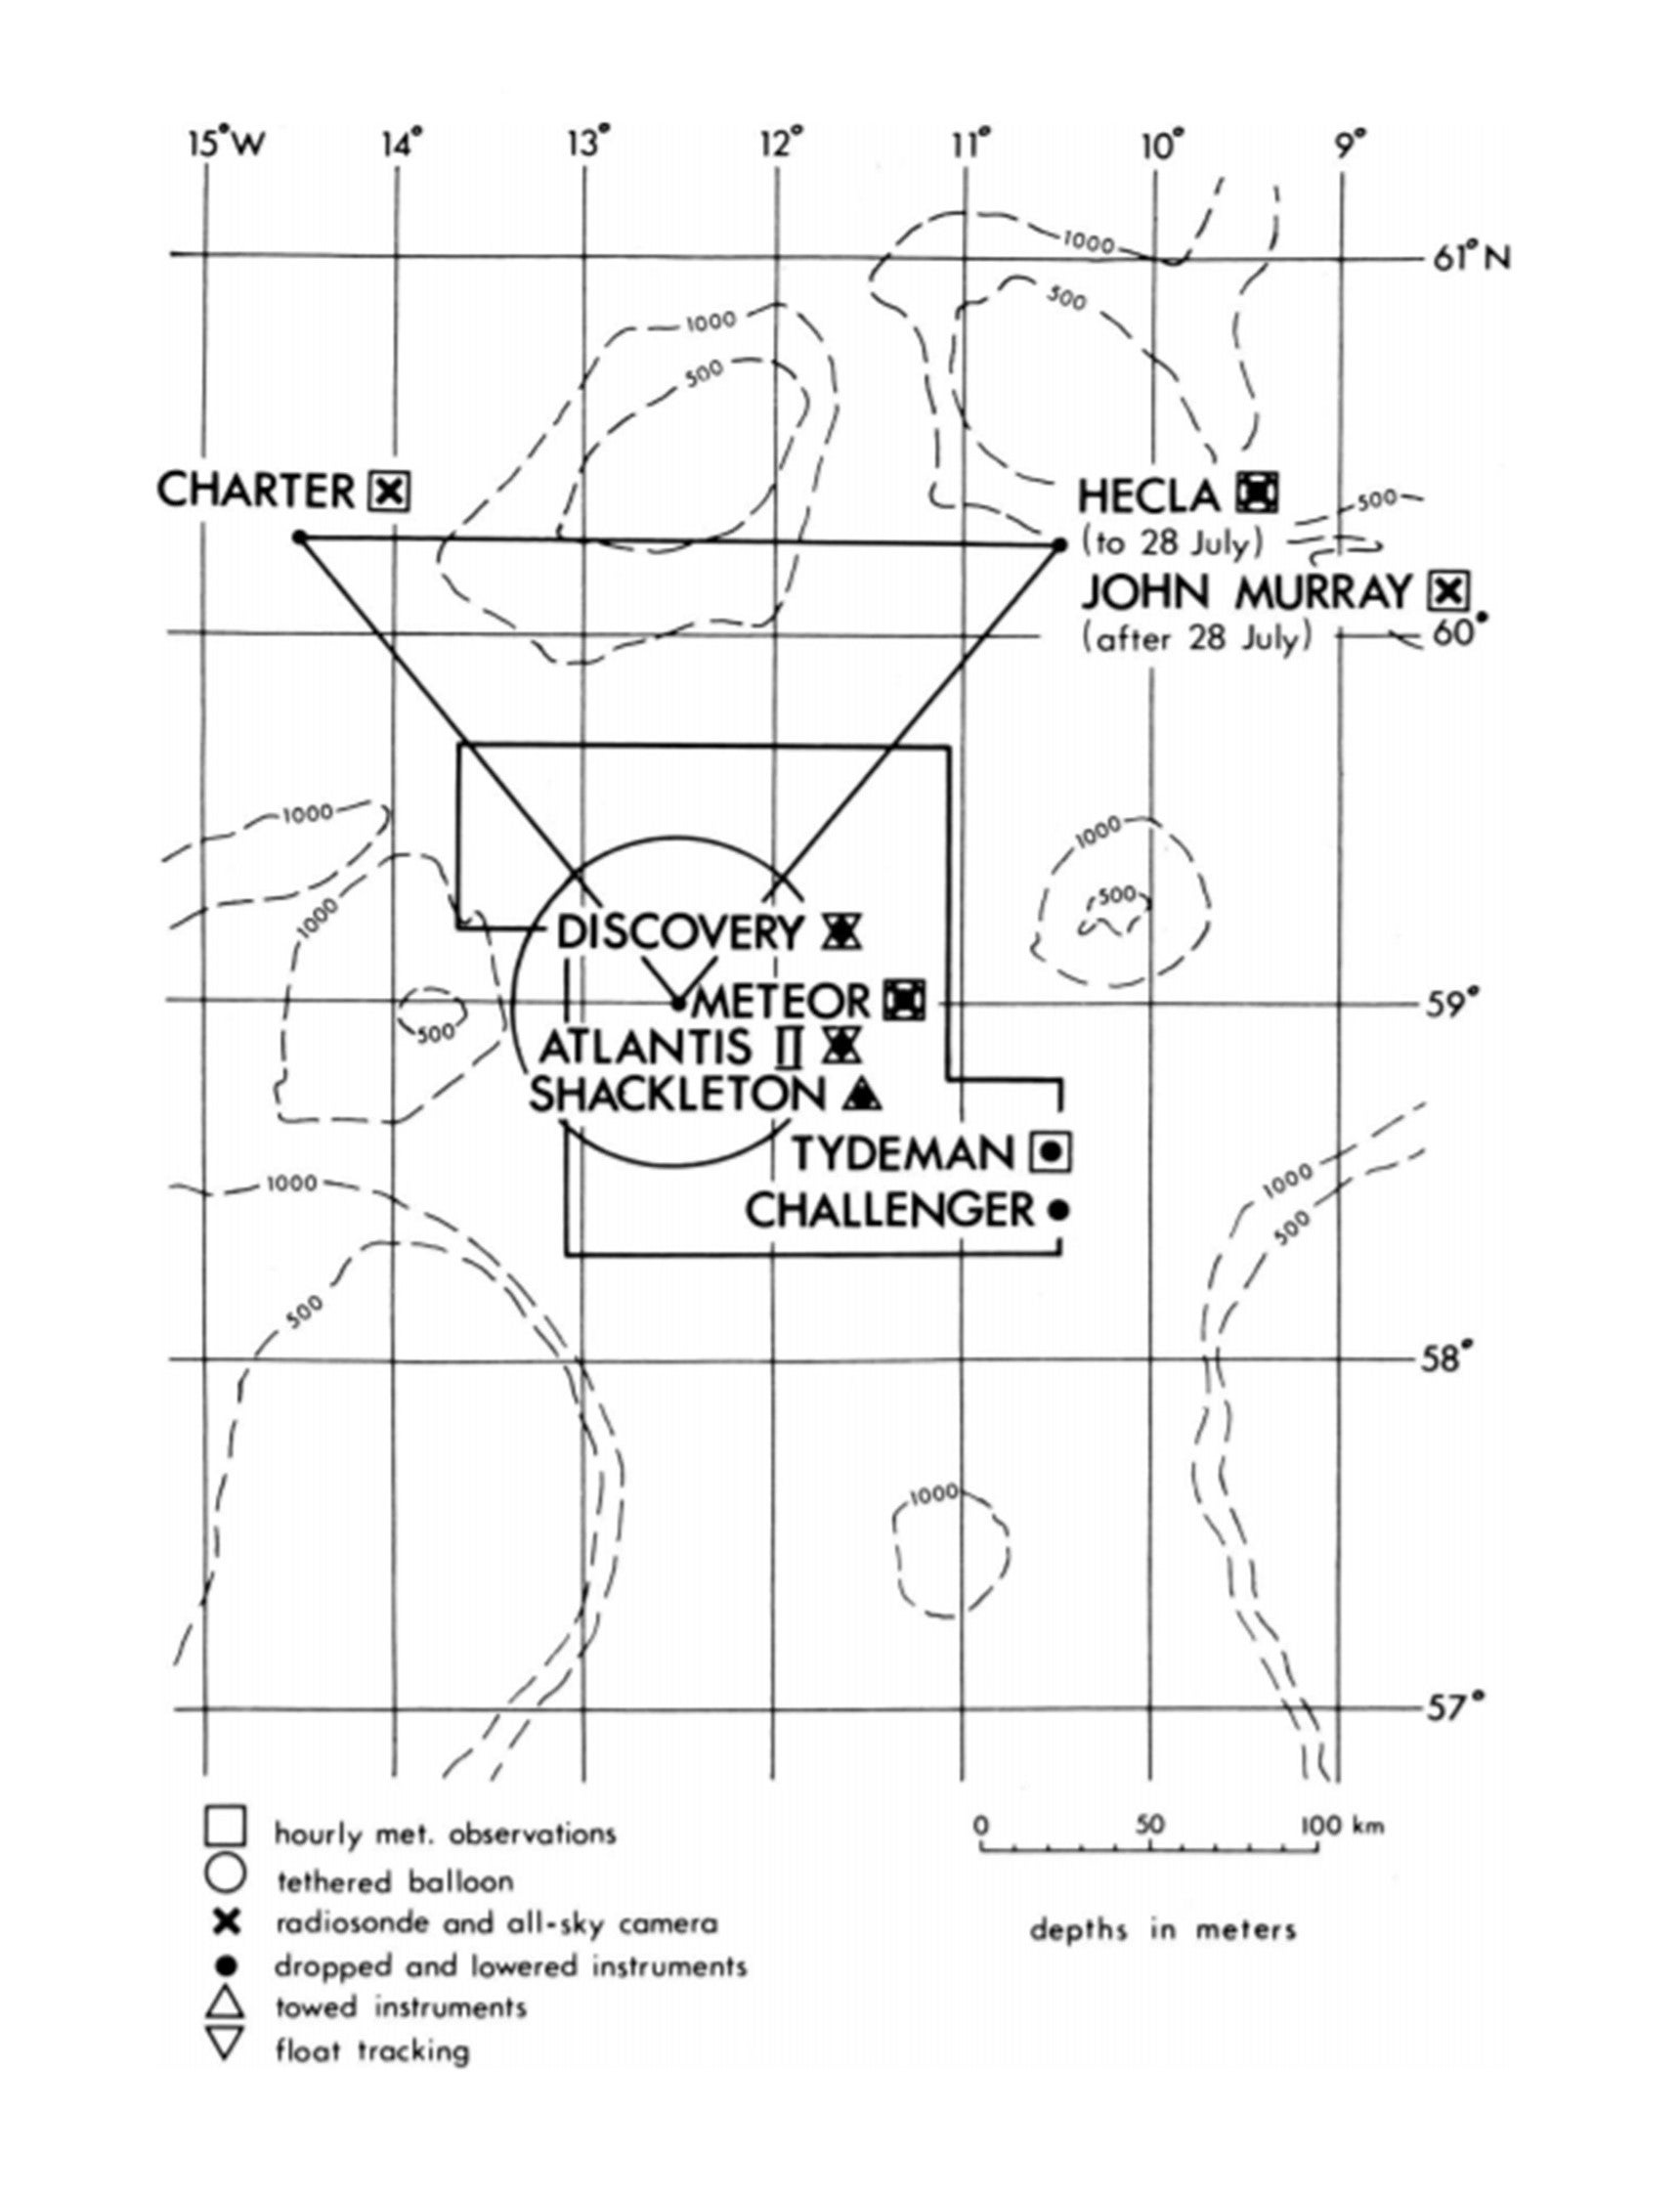 |
Figure 2: Positions of ships in the main experimental areas during Phase 1 (23 July through 16 August). Symbols indicate main tasks of each ship
  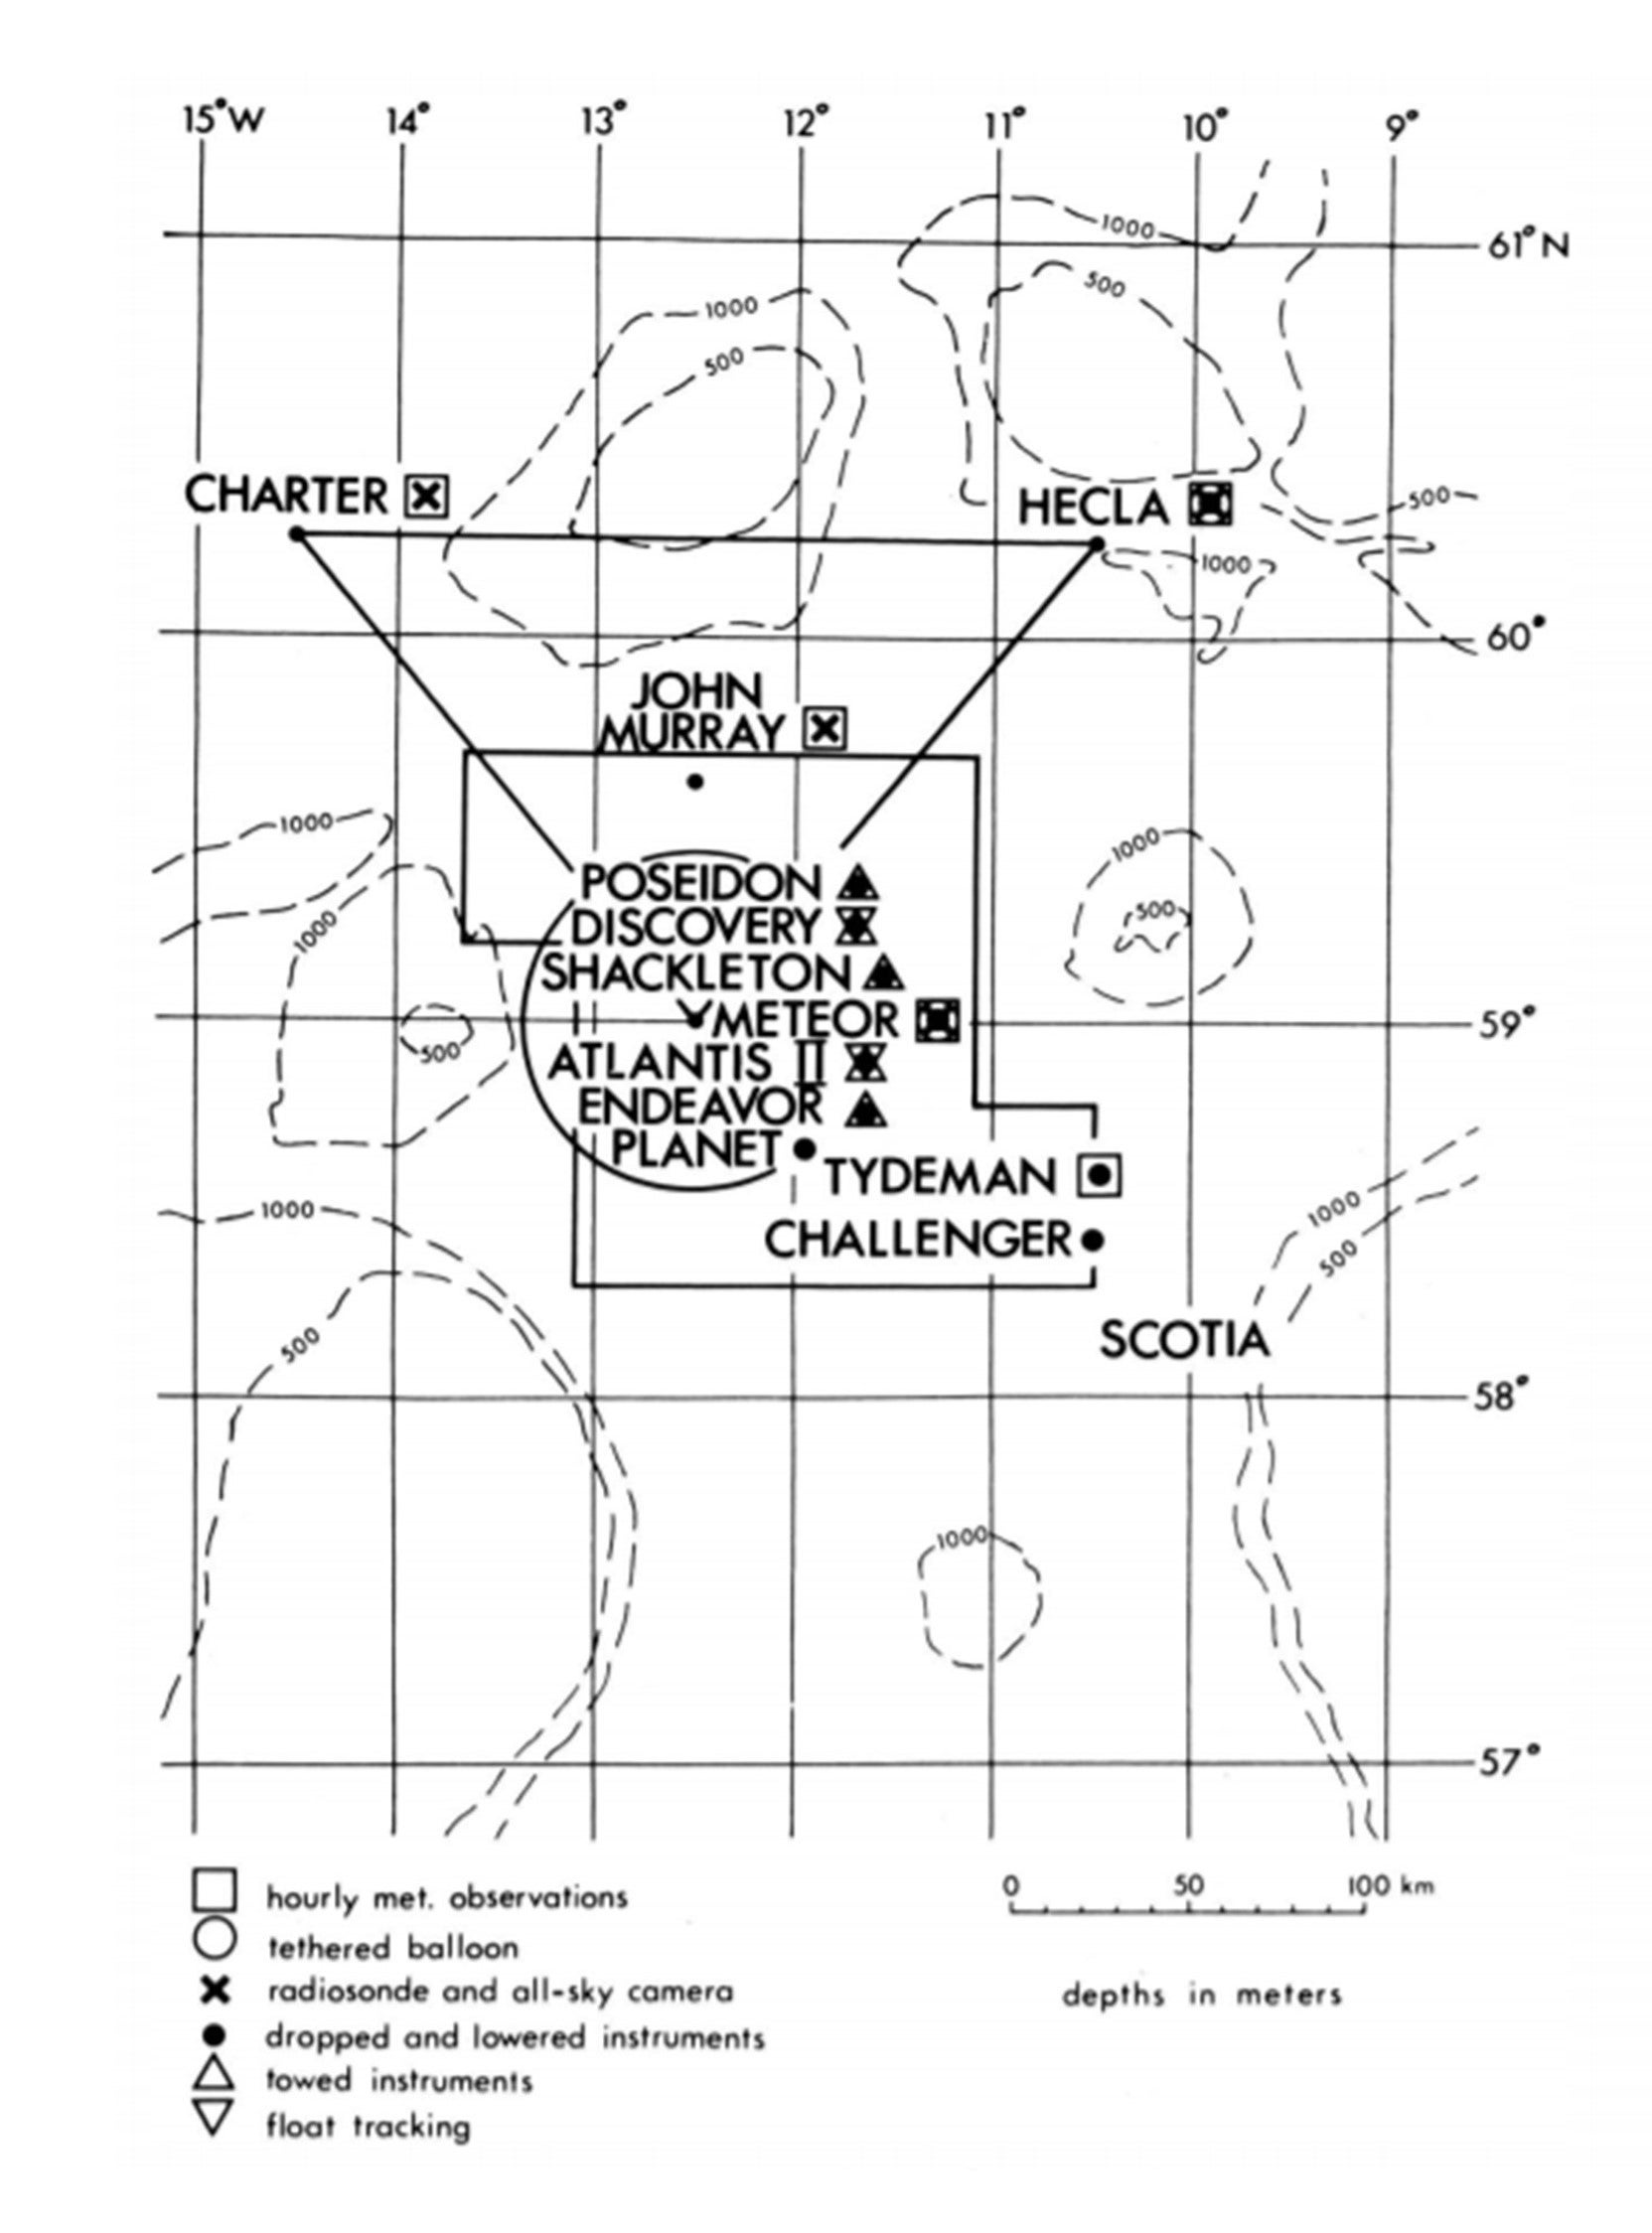 |
Figure 3: Positions of ships in the main experimental areas during Phase 2 (17 August through 16 September). Symbols indicate main tasks of each ship
JASIN comprised a variety of measurements including upper air and near surface meteorology, and physical oceanography. Meteorological data include air temperature, pressure, humidity and wind, while oceanographic data included temperature, salinity, currents, wave spectra and short-term wave statistics. Data were collected using a variety of instrumentation, with meteorological data being provided by radiosondes, tethered balloons, aircraft-mounted sensors (3 gust probe equipped aircraft), and surface measurements on ships and buoys. Hydrographic data were collected via shipboard deployment of conductivity-temperature-depth (CTD) sensor packages (both standard and yoyo profiles), towed thermistor chains, ship-mounted wave recorders and moored temperature and current meters.
Radiosonde launches using LO-CATE wind measuring sondes from ships at the corners (and center) of the meteorological triangle were made at 3 or 6-h intervals for most of the experimental period. On 15 intensive days, each meteorological ship released at least 12 radiosondes between 0600 and 2100 UTC at ~1-h intervals. Intensive days were chosen by the Field Operations Coordinator after assessing the weather conditions and forecasts. On most intensive days, 3 aircraft (2 in Phase 1) flew generally in formation at different heights, repeatedly surveying the 100-km box and 50-km “L” patterns contained mostly within the meteorological triangle. Measurements included direct fluxes, radiation, surface waves by photography and laser altimetry, and sea surface temperature. Instrument intercomparisons were made on passage, supplemented by dedicated aircraft flights as needed. As a central element of the air-sea interaction program, surface meteorological parameters were sampled by a wide variety of devices on ships and buoys. Near surface fluxes were estimated from these measurements and were also directly measured from 2 tethered balloons and low-flying (30-50 m) aircraft.
Hydrographic Surveys were carried out by the Challenger and Tydeman with assistance from Shackleton. Challenger made casts to the bottom at the corners of 15-km triangles, repeated once to reduce tidal noise. A grid of triangles at 45-km separation was surveyed once on each leg of Challenger's cruise. Tydeman carried out yo-yo dips to ~200-m of 1-h duration on a 22.5-km grid, with a few casts to the bottom coordinated with Challenger and Shackleton to ensure that the Hydrographic Survey Area was surveyed with deep casts approximately every 5 days. The small-scale measurements, which formed the core of the oceanographic program, was confined to the OIA and involved intensive surveys of areas up to ~20-km square either fixed or drifting within the OIA, carried out by up to 7 ships.
The highest concentration of instruments was in the FIA of moorings, which were designed to study the structure and propagation of surface-generated internal waves, the structure of the mixed layer and upper thermocline on scales from meters to kilometers, and the surface fluxes of momentum and heat on scales of a few kilometers. Ship measurements were made near the FIA including conductivity temperature depth (CTD) yo-yoing from up to 3 ships simultaneously, CTD profiles every 4 h from Meteor (hourly in Phase 2), drifting vertical current meter measurements, several oceanographic profiling systems, and freefall dissipation and microstructure instruments. Instruments operated included 2 towed profiling CTDs, a towed thermistor chain, 2 acoustic sounders, and Swallow floats. Instrument intercomparisons and joint exercises involving more than one ship making coordinated measurements were an integral part of the experiment. Six waveriders around a 37 km circle within the OIA and at its center operated throughout the experiment. Four pitch/roll buoys were frequently deployed from Discovery and Atlantis II. Measurements were coordinated with aerial photographs of the surface from a C-130 aircraft, laser profilometer measurements from the Electra and with altimeter and synthetic aperture radar measurements from the Seasat-A satellite.
Field operations were coordinated from the Aircraft Base, RAF Machrihanish. A team led by the Field Operations Coordinator assessed the program daily, aided by weather forecasts, ship status reports communicated on a regular schedule through Oban Radio, and special analyses compiled by a JASIN forecaster and oceanographer at the base. Harbor facilities for all ships was centralized at Yorkhill Quay, Central Glasgow. This was used between phases as a center for scientific meetings and exchange.
The NCAR Electra aircraft was utilized to obtain horizontal distributions of fluxes of momentum, heat and water vapor over the JASIN array. This experiment was conducted in coordination with the UK C-130 aircraft, operated by the UK Met. Office, providing a comprehensive boundary layer data set, which allowed for the effective study of mesoscale secondary flows and frontal passages and their interaction with the atmospheric boundary layer.
Further information and details on the JASIN project can be found at:
Pollard, R.T., 1978: The Joint Air-Sea Interaction Experiment—JASIN 1978. Bull. Amer. Meteor. Soc., 59, 1310–1318, https://doi.org/10.1175/1520-0477-59.10.1310
Local mirror for DOI linked document: JASIN article.pdf