FLAT90
TKE Budget Study
Introduction
The First Look At Turbulent kinetic energy (FLAT) experiment, with investigators Steve Oncley (NCAR/ATD), Jim Wilczak (NOAA/WPL), Tom Horst (NCAR/ATD), John Wyngaard (NCAR/MMM), and Al Bedard (NOAA/WPL), was the first attempt to measure directly all terms of the turbulent kinetic energy (TKE) balance in the atmospheric surface layer. TKE is a basic quantity in turbulence research, yet its balance is not known to better than 10% due to the lack of complete data set. Current controversy in micrometeorology centers around this 10% difference between several, supposedly high-quality, existing data sets.
The FLAT experiment was carried out from September through November 1990. This time of year was chosen to maximize the chances for near-neutral stability conditions (overcast, strong winds) to occur, yet to obtain data in convective conditions early in the experiment.
ATD supported FLAT with the ASTER, PAM, and Mobile CLASS systems. The ASTER facility was used as the basis of the FLAT experiment, by supporting a wide variety of turbulence sensors, including several "piggy-back" investigators. A 3x3 array of NCAR PAM stations centered on the ASTER site and spaced every 2 miles was used to check the horizontal homogeneity of the flow field. Also, the NCAR Mobile Class system made 60 soundings during late October in an attempt to measure horizontal temperature advection in the boundary layer.
In addition, several other organizations supplied facilities for this study:
- During the entire experiment, a NOAA/WPL 915 MHz wind profiler and an acoustic sounder was operated at the ASTER site.
- NOAA/ATDD deployed about 9 microbarographs to examine gravity waves and made several balloon soundings.
- Colorado State University also made balloon soundings on two (or three) days from the ASTER site.
ASTER Overview
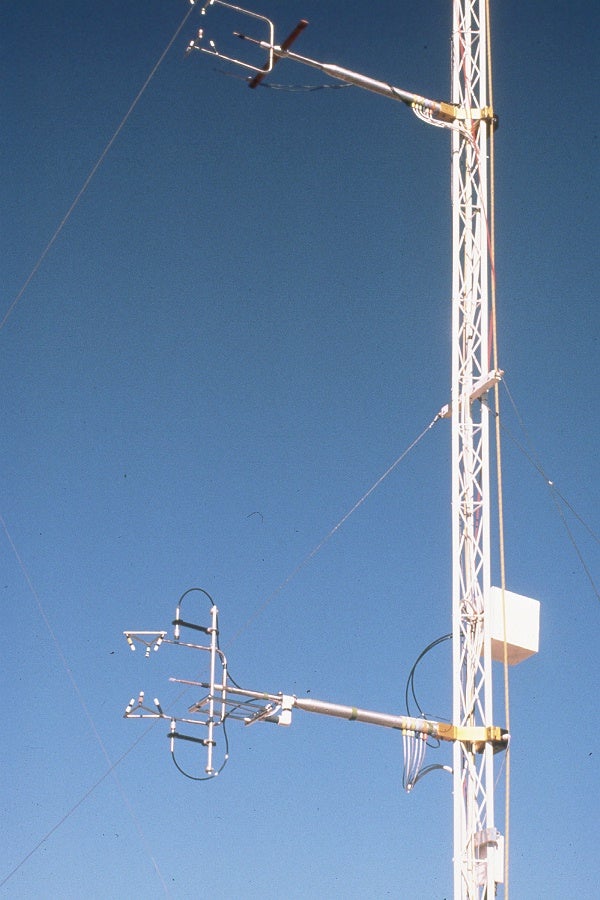
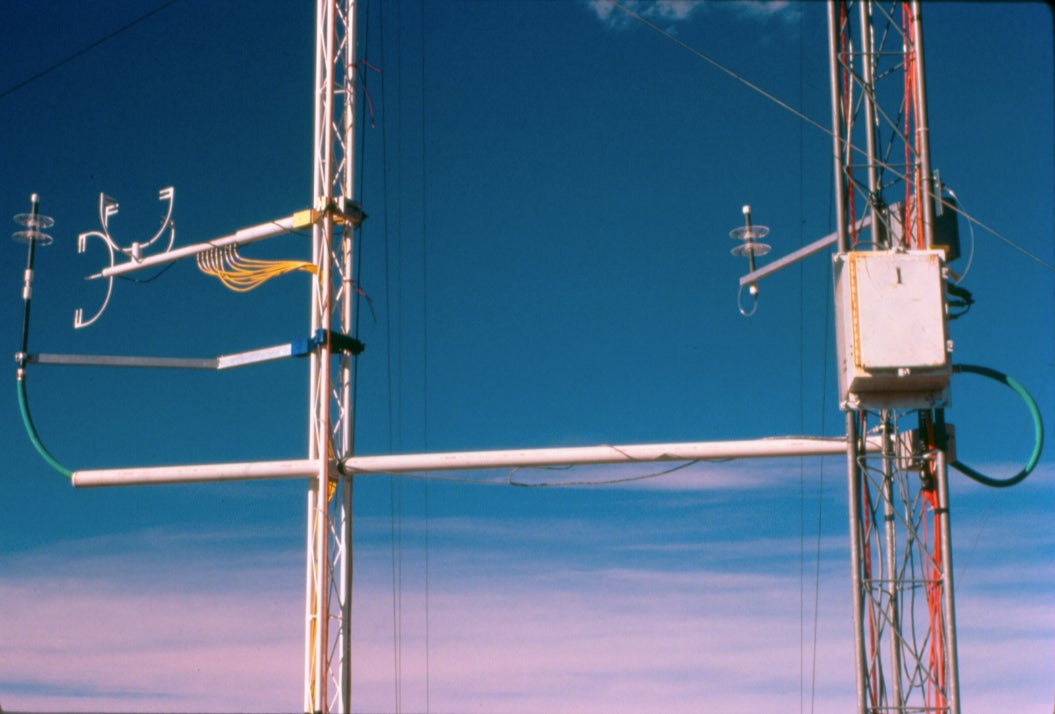
The National Center for Atmospheric Research (NCAR) Atmosphere- Surface Turbulent Exchange Research (ASTER) facility was used as the basis of the FLAT experiment. ASTER's propeller-vane anemometers were used to measure dU/dz needed in the TKE shear production term, ASTER's sonic anemometers were used to measure u* and d(u^2+v^2+w^2)/dz needed in the TKE turbulent transport term and were combined with ASTER's platinum temperature sensors and Krypton hygrometer to measure w'Tv' needed in the buoyant production term. Fast response pressure sensors, provided by NOAA/WPL, were placed near the sonic anemometers to measure w'p' needed in the pressure transport term. Finally, a hot-wire anemometer, provided by the University of California at Irvine, made high-frequency velocity measurements used to calculate the dissipation rate of TKE.
The FLAT experiment was carried out from September through November 1990. This time of year was chosen to maximize the chances for near-neutral stability conditions (overcast, strong winds) to occur, yet to obtain data in convective conditions early in the experiment.
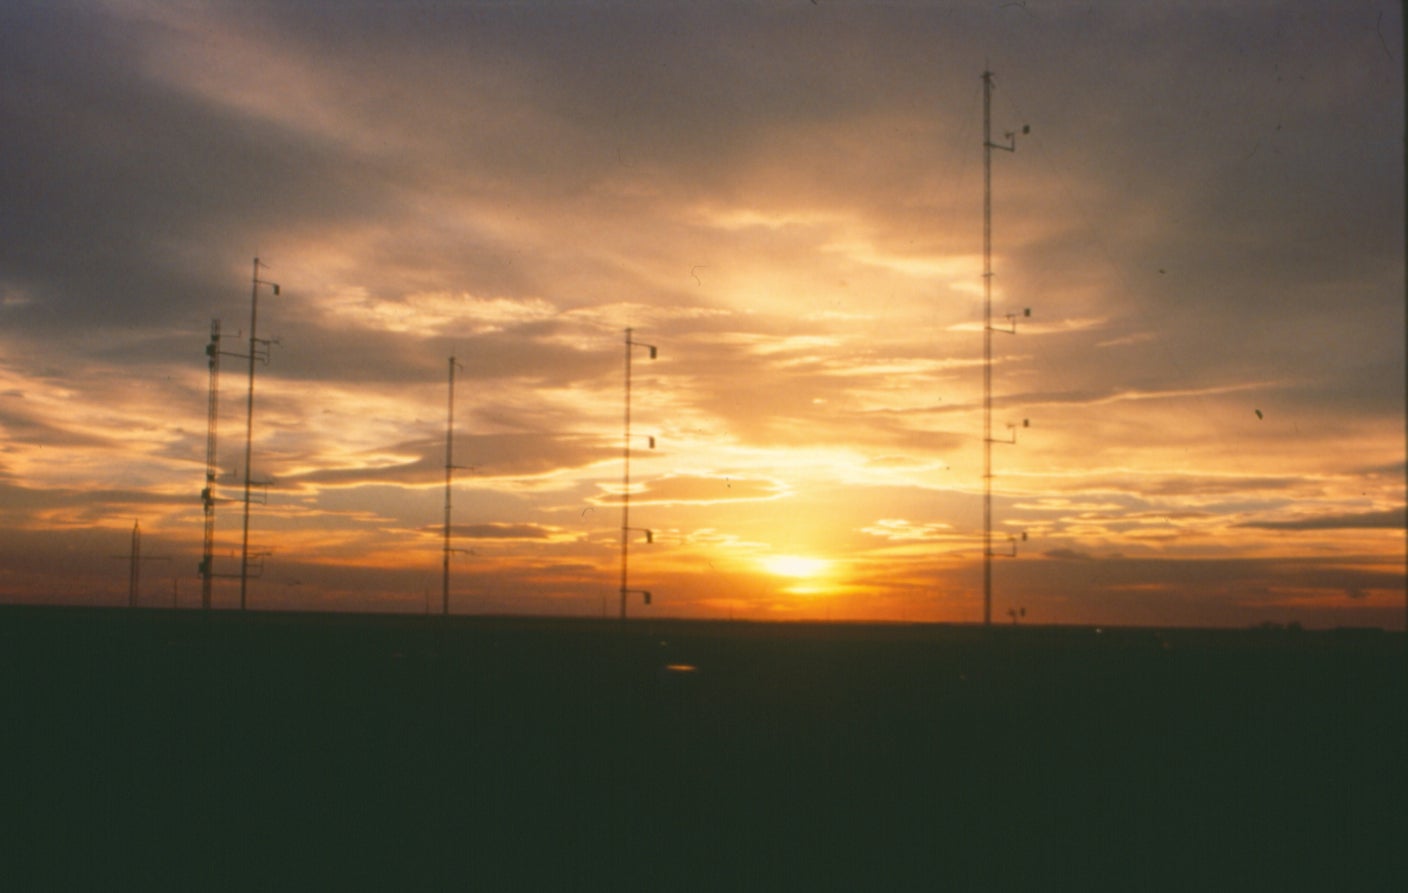
Just a few photos have been digitized. Oncley has more images on slides.
Location
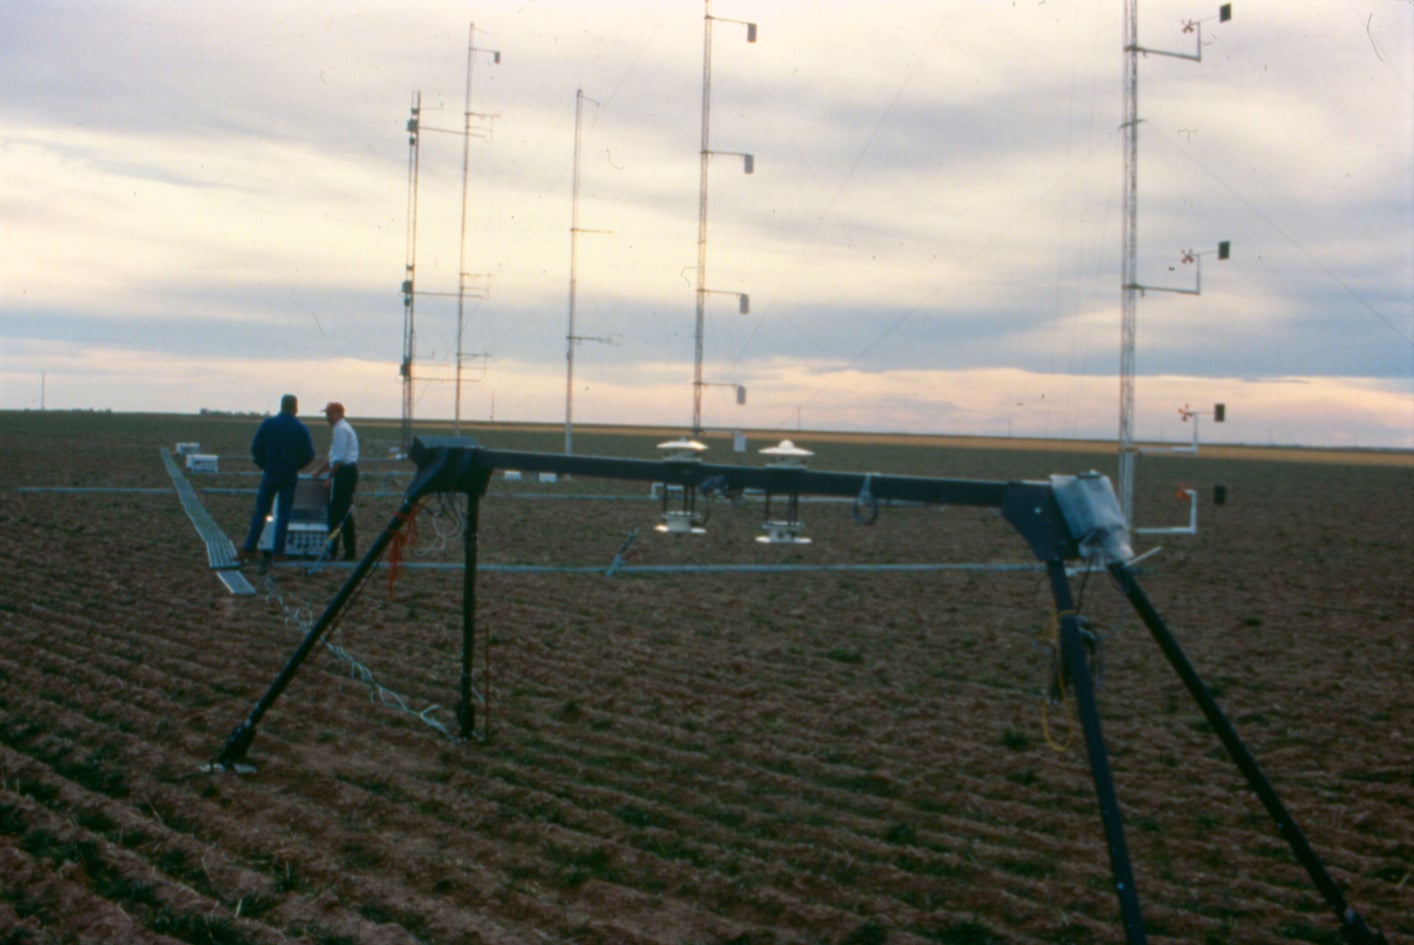
The FLAT experiment required that the site be horizontally homogeneous (hence the name FLAT). A site was used near Carpenter, Wyoming (see Road Map) which had a uniform slope for almost 8 km to the west of about 1/4 degree (see Topographic Map). The area was agricultural, though some of the land was in the Crop Reserve Program (CRP) which grows into wild grassland. Although the fields were broken into many strips of various sizes (see Crop Map), the surface roughness was nearly the same for all of the non-CRP land during the fall when the experiment occured. There was an albedo difference in these surfaces however, which may have created internal boundary layers. The masts were oriented to have good fetches from SW through N (see Mast Layout) since west was thought to be the predominate direction for strong winds. The actual coordinates for the site were: 41.0668 deg N, 104.2966 deg W.
Sensors
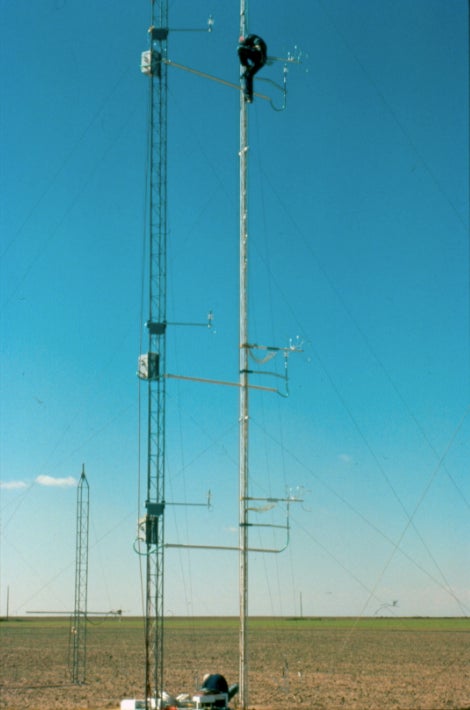
Although this was ASTER's first deployment, several extensions from the "generic" layout were made. Since the measurement of vertical gradients were important, two of the masts were extended to allow measurements at 15 m. The mast spacing was either 10 or 15 m to prevent the guy wires from these taller masts from interfering. As seen in the Channel Configurations, the propeller mast had 6 levels from 1 to 15 m, the psychrometer mast had 5 levels from 1 to 10 m (plus a sixth level placed on the ati mast), and the ati sonic anemometer mast had three levels at 4, 7, and 13 m for measuring turbulent quantities. The uw sonic anemometer mast was kept uncluttered (by the pressure ports) to estimate flow distortion. The hot wire was placed near the 7 m uw sonic to enable in situ calibration. The Krypton hygrometer was placed near the 4 m uw sonic since it was not felt that there would be a strong variation in humidity flux with height. A "sawhorse" supported infrared and visible upward and downward-looking radiometers plus at least one net radiometer. Soil temperature and heat flux measurements were made and soil moisture was checked sporadically (see Soil Moisture summary) using a gravimetric method. Two types of slow-response barometers were used to measure the low-frequency pressure variations which were cut off by the fast-response pressure sensors. ASTER also hosted several other "piggy-back" investigations.
- A group headed by Dr Zvang from the Soviet Academy of Sciences deployed a sonic anemometer, temperature sensors, and net radiometer during the first part of the experiment.
- NOAA/WPL brought two sonic anemometers during the experiment and also deployed a laser scintillometer during the last part of the experiment.
- At the very end of the experiment, a slow ozone sensor was added to see if Denver air pollution could be detected from 150 km away.
Since the number of channels available on ASTER was limited, it was necessary to rearrange some of the channels when these additional systems were added or removed. For this reason, there were six operational configurations (ops1, ops2, ops3, ops4, ops5, and ops6; labeled ops1-ops6). In addition, an intercomparison, configuration was used at the beginning of FLAT to operate the different sonic anemometers at a common height. A complete list of the standard ASTER sensors and these additional sensors is given in Table 1.

In addition, nine PAM stations were deployed to document the mesoscale flow. See the separate PAM page.
Data Processing Notes
This section is not complete.
- The sonic anemometer data have been processed using a tilt correction which fits the mean wind to a planar surface, which ideally is parallel to the actual surface of the ground. Tilt plots to be added. Days 52-60
- The sonic anemometer data have been despiked using the current adaptive despiking routines.
- All of the analog signals were inadvertantly low-pass filtered twice; once by an analog filter and again by block averaging 200 sample-per-second digital data. The fast T (t.), fast pressure (pp.), and fast humidity (h2o.) signals have been compensated for this filtering by a time-domain technique applied to the raw archive signals.
- The fast-response pressure sensors (pp.) have been corrected for high-pass filtering by their leaky reservoir by special code applied to the raw archive data which applies a correction for the measured reservoir time constant in the frequency domain (by taking an FFT, correcting the spectra, and taking the inverse FFT).
- Time derivatives of the temperature and pressure signals were calculated as a two-point centered difference [dx/dt (i) = (x(i+1)-x(i-1)) / 2T] from the time series. This calculation induces a phase lag in both the original signal and the derivative, which is corrected by a phase parameter in prep.config.
- A cross-correlation analysis indicated that the w'p' correlation was quite sensitive to phase lags bweteen these sensors. Therefore, a time-dependent phase correction has been applied to the pressure signals which depends on the wind speed and direction and uses the position of the pressure ports relative to the ATI sonic w path.
Daily Weather Plots
The following plots summarize conditions during each day of the project. Each plot covers one Julian day (0000-2359 GMT) and is labeled with time in GMT at the bottom and local time (MST) at the top. The top panel has the mean temperature and humidity measured by the psychrometer along with the pressure from the PAM barometer at 7 m. Sharp drops in humidity (for example, at 1500 on day 291) are caused by the wet-bulb thawing out after having been frozen and reading saturated values. The next panel is wind speed and wind direction, usually measured from the propeller-vane anemometer at 10 m. The dotted line represents direction of winds coming perpendicular to the mast array. Acceptable fetches should be for winds 45 degrees south through 75 degrees north of this direction (260 - 020 degrees). The next lower panel shows the net radiation, and sensible, latent, and soil heat flux contributions to the energy balance. The bottom panel shows the Monin-Obukhov stability parameter z/L evaluatated at 10 m from measurements from the 7 m UW mast along with u* from these measurements. A line for neutral conditions (z/L = 0) is shown for reference. Since these fluxes and derived parameters are based on smoothed, 5 minute average statistics, they should not be used quantitatively and are only shown for guidance in selecting periods to analyze further.
- Julian Day 263
- Julian Day 264
- Julian Day 265
- Julian Day 266
- Julian Day 267
- Julian Day 268
- Julian Day 269
- Julian Day 270
- Julian Day 271
- Julian Day 272
- Julian Day 273
- Julian Day 274
- Julian Day 275
- Julian Day 276
- Julian Day 277
- Julian Day 278
- Julian Day 279
- Julian Day 280
- Julian Day 281
- Julian Day 282
- Julian Day 283
- Julian Day 284
- Julian Day 285
- Julian Day 286
- Julian Day 287
- Julian Day 288
- Julian Day 289
- Julian Day 290
- Julian Day 291
- Julian Day 292
- Julian Day 293
- Julian Day 294
- Julian Day 295
- Julian Day 296
- Julian Day 297
- Julian Day 298
- Julian Day 299
- Julian Day 300
- Julian Day 301
- Julian Day 302
- Julian Day 303
- Julian Day 304
- Julian Day 305
- Julian Day 306
- Julian Day 307
- Julian Day 308
- Julian Day 309
- Julian Day 310
- Julian Day 311
- Julian Day 312
- Julian Day 313
- Julian Day 314
- Julian Day 315
- Julian Day 316
- Julian Day 317
- Julian Day 318
- Julian Day 319
- Julian Day 310
- Julian Day 311
- Julian Day 312
- Julian Day 313
- Julian Day 314
- Julian Day 315
- Julian Day 316
- Julian Day 317
- Julian Day 318
- Julian Day 319
- Julian Day 320
- Julian Day 321
Other plots
Precipitation during FLAT (from the nearest PAM station) is shown on the bottom panel of "Summary of Conditions." Only one rain event on day 303 is seen. Smaller events on days 281, 282, 308, and 309 are probably snow melting in the rain gauge. The upper panel shows the albedo of the planted soil where the ASTER masts were located. These values after day 281 and 308 are high and then decrease, corresponding to melting snow cover on the surface. (Values greater than one probably are due to snow masking the upward-looking radiometer.) The nominal albedo is seen to be about 0.22. Lower values are seen which may be due to darker soil when wet. Albedos measured from the PAM station, located on a adjacent stubble field, during the last two weeks of the experiment are also shown. These values are lower than expected since the stubble appeared lighter than the soil. Further work will be necessary to verify the PAM radiometer calibration.
- Soil Moisture
- Statistic comparison plots: Days 262-321
Data Access
ASTER data are stored in two forms:
- 5-minute averages of first and second-order moments of calibrated data. We recommend combining these to obtain more statistically-significant averages over longer time periods.
- 1, 10, or 20 sample/second uncalibrated values. Software is maintained at SSSF to generate calibrated time series on demand using the most current calibration routines.
Also available is a computer-readable log of comments noted by ASTER personnel. The logbook can be read here. For access to the ASTER data, please contact SSSF.
Principal Investigators:
- Steve Oncley NCAR/EOL
Jim Wilczak NOAA/WPL
Tom Horst NCAR/EOL
John Wyngaard NCAR/MMM
Al Bedard NOAA/WPL
Project Manager:
- Steve Oncley NCAR/EOL
Data Manager:
- EOL Archive NCAR/EOL/DMS