CWEX
Crop Wind Energy Experiment
![]()
Principal Investigator :: Dr. Gene Takle
When :: 22 June - 16 August 2011
Where :: Iowa State University - Ames, IA
Facility :: Integrated Surface Flux Systems (ISFS)
The NCAR Earth Observing Laboratory deployed four surface flux stations from 22 June through 16 August 2011 in a utility-scale wind farm in central Iowa. Turbines in the wind farm have towers with hub height of 80 m, blades of length 37 m, and rated power of 1.5 MW. This deployment, a part of the 2011 Crop/Wind-energy EXperiment (CWEX-11), provided experiences and data that complemented a concurrent summer NSF Wind Energy Science, Engineering and Policy (WESE) Research Experiences for Undergraduates (REU) site program at Iowa State University. The Ames Laboratory (DOE) also conducts a Science Undergraduate Laboratory Internship (SULI) program that provided one student to engage in 2011 deployment and one in 2012 that used NCAR/CWEX-11 data for her summer project. Additionally, graduate students and undergraduate students in the ISU Atmospheric Science Program and Agriculture Meteorology Program participated in the instrument setup and tear-down and have used and continue to use data archived from the NCAR instruments in research projects, senior undergraduate theses, MS theses, and a PhD dissertation. This report provides details of the program and its impact on experiential learning.
Educational Objectives
The objectives of the deployment spanned a range of educational levels:
- Demonstrate to graduate students and undergraduates the techniques of deploying and maintaining a surface flux station that included measurements and analysis of fluxes of CO2, H2O, momentum, and heat
- Provide data for use in class projects, homework assignments, undergraduate senior theses, MS theses, and PhD dissertations
- Work out logistics of wind farm tours
Description of the Deployment
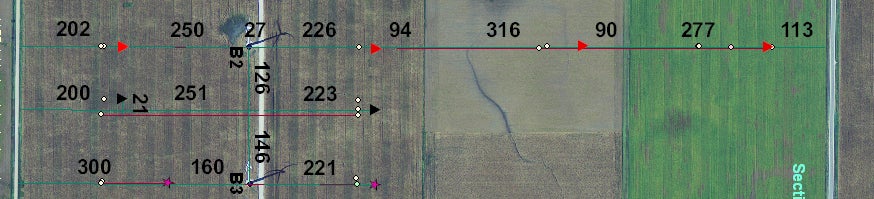
In CWEX-11, flux towers were deployed close to an east-west line of six turbines, labeled B1-B6 from west to east (see Fig. 1). The upwind reference tower (NCAR 1) was placed 2.0 D south of turbine B2, where D is the turbine fan diameter (74 m for this wind farm). The northerly (downwind) flux towers (NCAR 2, NCAR 3, and NCAR 4) were placed at 3.5 D, 9 D, and 14 D, respectively, north of turbine B2. Two additional flux towers, designated as ISU 1 and ISU 2, were placed north and south of the gap between turbines B2 and B3, at approximately 2.0 D upwind and 3.5 D downwind. Sensors and heights are listed in Table 1. Two wind cube vertically pointing lidars were installed and operated by J. Lundquist from NREL/CU. Data from these instruments were also made available to students using data from the NCAR instruments.
Student Assignments
Planning and execution of a field program and associated outreach activities
Graduate students assisted in designing the experiment. This included planning locations of instruments in the field specifically geopositioned relative to various turbines, with consideration for prevailing wind directions for this region for the months of June, July, and August. Attention was given to micro-terrain features, locations of “wet spots”, soil conditions as revealed in soil type maps, types of crops in the region, different cultivars of corn, and different land management techniques (e.g., tillage practices, plant densities, planting dates). Advice from NCAR staff was included in the advance planning process. Sensor positions on flux towers were determined by consideration of expected crop development through the growing season. Alternative locations of access paths through the crop were considered in relation to possible inhomogeneous fetch for measurements for various wind directions. Finally, health and safety issues (hard hats, agricultural chemicals, dehydration, sunburn) were considered as part of the planning, for both the participating meteorology students and for tours of the wind farm carried out in connection with the project.
Two graduate students and one undergraduate assisted in the pre-deployment planning, which included negotiating contracts with farmers for access to the land and preparing sites and access paths through the corn fields. Instrument deployment, operation and maintenance, instrument tear-down Approximately ten students (both graduate and undergraduate) participated in initial deployment of the instruments in the corn fields surrounding the wind turbines and a slightly lower number were involved in the tear-down. Two graduate students and two undergraduate students were on duty throughout the two month deployment and made trips to the wind farm measurement site approximately three times per week for a variety of maintenance, monitoring, data downloading from ancillary measurements (e.g. leaf wetness) being taken.
Use of data for graduate student projects
NCAR/CWEX-11 data also are currently being used as the central data source for one PhD student dissertation, and by two masters students. The PhD student is heavily involved in all phases of the research and is leading the effort on data analysis. One MS student is looking at data from all stations to determine the levels of turbulence intensity at various locations in the wind farm. The other MS student will be working with data from a tethered balloon to be flown near the CWEX measurement site, so has been using the CWEX 11 data for comparison with alternative locations for the balloon flights.
Data for class lectures and homework problems
Archived data also provide a rich data bank for selection of homework problems and class projects for the boundary-layer meteorology course that is taught in alternate years and the first of four core courses in the new WESEP NSF/IGERT program. Previously we have relied on “canned” problems, so the 2011 archive provides a valuable resource for years to come. Class lecture and homework problems are being created from the 20-Hz data on wind (3-direction from sonic anemometers) as well as temperature, water vapor and CO2. Segments of time series are provided to enable students to calculate fluxes, mean and turbulent properties, turbulence kinetic energy, surface stress, and advection. Stability concepts are explored by calculations of Richardson number (both flux and gradient) and Monin-Obukhov length. Alternative averaging times and concepts of anisotropy and homogeneity are more clearly revealed by use of real data.
Engineering faculty members from the University of Iowa have reported downloading CWEX11 data from the NCAR site for use in calculating turbulence intensity with an eye toward both educational and research applications on blade stresses in a wind farm.
Success of the activity both from the instructor and students point of view
For this particular deployment it is important to consider various time scales in assessing success. Time periods include (a) pre-deployment planning, (b) the 2-month period of the deployment (including set-up and tear-down, which have their own educational value), (c) one-year post-deployment, and (c) multiple-year post deployment.
From the instructor point of view the activity was a big success. Being programs that emphasize modeling studies, the Agricultural Meteorology and Atmospheric Science programs have not historically provided students with a sustained exposure to field measurements. The 2011 NCAR educational deployment and concurrent establishment of the EPSCoR grant to ISU for “Energy Flows in the Biosphere” combined to create a sustained exposure to field measurements as evidenced by a follow-on (although scaled back) field campaign in 2012 and plans for a 2012-2013 pressure field experiment over the coming winter. The 2011 pre-deployment planning continues to influence our planning for 2012-2013 through GIS procedures developed for mapping high-resolution elevation, land-use, crop yield mapping, etc. Stories of the 2011 two-month deployment continue to be carried down to each new undergraduate class, which makes recruiting volunteers for field help an easy task. Continued use of the data in a variety of class and student projects provides experiential learning for students involved and also provides some balance (observations vs modeling) to the learning environment of others through posters and senior thesis presentations at the annual undergraduate symposia in the department and at the university level. In summary, the 2011 deployment created an abrupt and sustained level of interest in field measurement and use of locally derived data for a range of student projects. The Oncley lecture was repeated in our 2012 REU program (at our expense) and likely will be again next year to maintain the success of the 2011 deployment.
The number of student-selected projects speaks volumes about the success of the deployment in in the eyes of students. Another measure is the number of students having carried out measurements and having used field data for projects who are now applying to graduate school. I am experiencing an abrupt increase in requests for letters of reference for graduate school from those having been connected with the field program. One student whose REU and senior thesis projects involved CWEX-11 field data analysis has created a wind science website for easy access to a variety of data and publications stemming from the CWEX experiments.
The huge success of the program was in large measure due to the organization and execution of the deployment and follow-on data access on the part of the NCAR team. The end-to-end (S. Oncley presentation to continuing online data access) attention to details left no gaps in the acquisition and use of field data. The access students had to state-of-the-science instruments and methods as well as skilled field-measurement scientists cannot be over-emphasized.
| Outreach Activities |
Because of liability and lease agreements for having visitors to the wind farm and on private land under intensive agricultural management, we initially were limited in being able to bring groups of pre-college students to the field site. However, negotiations and discussions carried out in conjunction with the 2011 deployment paved the way for successful tours in 2012. We were able to bring three van loads of pre-college students in addition to isolated student visitors to the wind farm for tours and discussions of meteorological measurements relating to impacts of wind farms on agriculture. Some of the logistics learned for bringing an age-range of learners into an operating utility-scale wind farm included transporting students, supplying hard hats, check-in at wind farm headquarters, time management for viewing sites, and advance preparation including ensuring proper attire as well as availability of sunscreen, water and restroom facilities.
The 2011 deployment and subsequent use of data as well as a follow-on 2012 ISU deployment (facilitated by “alumni” of the 2011 NCAR/CWEX field study) have created a new interest in field measurements by ISU students (at ISU, the faculty primarily have a modeling focus). Evidence is provided by the fact that over 40 students participated in the two-hour stop-by visit, MISS seminar, and balloon-launch event held by Bill Brown on Oct 8, 2012.
| Lessons Learned |
- Timing was important: The deployment came at a time when we were benefiting from a rise in interest in wind energy and access to instrumentation (but not expertise to deploy or run them) from other sources. Concurrent availability of REU students provided a ready audience.
- Flexibility and interest of the NCAR team promoted sustainability: Brigitte Beauerle and the NCAR team responded quickly and with a stretch of the budget to meet our requests for timing and types of instruments. Flexibility in timing of the visit of S. Oncley resonated with the REU schedule, and the repeat visit by S. Oncley in 2012 promoted sustainability, as has continuing dialog on instrumentation (e.g., forthcoming deployment of a pressure sensor network).
- Focusing on products of experiential learning brings visibility and promotes sustainability: Strong emphasis on student products of the learning experience solidifies the impact and creates a visible pathway for future participants. This is particularly important for participants (and future recruits) from underrepresented groups.
- Outreach involving on-site tours on private land and nearby to heavy equipment takes planning: Liability, safety, and (just recently) new restrictions on underage children in tours out of public spaces increase the attention needed for planning and training.
Individuals Reached During the Deployment
- Class of 11 REU students received presentations by the instructor and Steve Oncley as part of the REU short course. They also all (even students not using data for their projects) participated on a field trip to the wind farm. Two REU students took ancillary measurements (wind turbine noise levels) at various locations within the wind farm, including the flux station sites to supplement flux station measurements.
- Because 2011 REU program student projects were defined before the deployment, the timing on use of the data for the 2011 REU was not good; however, the 2011 deployment has provided data for two 2012 REU projects, one Ames Laboratory (DOE) Science Undergraduate Laboratory Internship (SULI) project (two of these three will be reported out in scientific sessions at the Annual AMS meeting in Austin).
- PhD project for Dan Rajewski, undergraduate thesis for Matt Lauridsen and Samuel Cook, and an undergraduate research project for Jimmy Cayer PhD students in mechanical engineering (2) have been supplied with data for wind energy related projects.
- Two engineering faculty members at University of Iowa have indicated they have accessed the data for studies on wind farm turbulence.
- Students of J. Lundquist have used and may continue to use NCAR/CWEX-11 data for MS and PhD projects.
Research Products Based on NCAR/CWEX-11 Data
Cook, Samuel*, 2012: Wind direction variations of wind turbine data using lidar and surface measurements. Senior Thesis, Meteorology Program, Iowa State University.
Flowers, Mallory Elise*, 2012: Comparison and Analysis of Wind Turbine Wake Interactions. Poster presented at the Iowa EPSCoR Annual All Hands Meeting 2012. University of Iowa, Iowa City, 31 July 2012.
Flowers, M.E.*, E. S. Takle, D. J. Rajewski**, and R. Doorenbos**, 2013: Comparison and Analysis of Wind Turbine Wake Interactions. Poster to be presented at the Fourth Conference on Weather, Climate, and the New Energy Economy. Amer. Meteor. Soc. Annual Meeting. Austin, TX. 6-10 January 2013.
Lauridsen, Matthew J.*, 2012: Influence of Wind Turbines on Atmospheric Stability and Dew Duration. Proceedings, Wind Energy Science, Engineering and Policy Research Experiences for Undergraduates Symposium. Iowa State University, 8 August 2012. [Available online at http://www.meteor.iastate.edu/windresearch/resources/Binder1.pdf]
Lauridsen, Matthew J.*, 2012: Influence of Wind Turbines on Atmospheric Stability and Dew Duration. Poster presented at the Iowa EPSCoR Annual All Hands Meeting 2012. University of Iowa, Iowa City, 31 July 2012.
Lauridsen, Matthew J.*, 2012: Impact of Wind Turbine Wakes on Surface-Layer Stability and Dew Duration. Senior Thesis, Iowa State University Meteorology Program.
Rajewski**, D. J., E. S. Takle, J. H. Prueger, S.P. Oncley, T. W. Horst, R. Pfeiffer, J. L. Hatfield, K. K. Spoth*, R.K. Doorenbos**, 2012: Evaluation of surface energy and carbon fluxes within a large wind farm during the CWEX-10/11 Crop Wind-Energy eXperiments. Amer. Geophys Union Fall Meeting, San Francisco, 3-7 December 2012.
Rajewski, D. A.**, E. S. Takle, J. K. Lundquist, S. Oncley, J. H. Prueger, T. W. Horst, M. E. Rhodes**, R. Pfeiffer, J. L. Hatfield, K. K. Spoth*, R. K. Doorenbos**, 2013: CWEX: Crop/Wind-energy EXperiment: Observations of surface-layer, boundary-layer and mesoscale interactions with a wind farm. Bull. Amer. Meteor. Soc. (in press).
Takle, E. S., D. A. Rajewski**, J. Prueger, S. Oncley, J. K. Lundquist, T. W. Horst, M. E. Rhodes**, R. Pfeiffer, J. L. Hatfield, K. K. Spoth*, and R. K. Doorenbos**, 2013: CWEX-10/11: Overview of Meteorological Measurements in a Wind Farm. Fourth Conference on Weather, Climate, and the New Energy Economy. Amer. Meteor. Soc. Annual Meeting. Austin, TX. 6-10 January 2013.
Takle, E. S., D. A. Rajewski**, J. Prueger, Steven Oncley, J. K. Lundquist, T. W. Horst, M. E. Rhodes**, R. Pfeiffer, J. L. Hatfield, K. K. Spoth*, R. K. Doorenbos**, 2012: CWEX-10/11: Overview of Results From the First Two Crop/Wind-Energy Experiments. Amer. Geophys Union Fall Meeting, San Francisco, 3-7 December 2012.
* indicates undergraduate student
** indicates graduate student
>> Read the complete CWEX Facility Request
>> Download the complete CWEX Final Report
Project Operations & Data Access
Chronology
| Date | |
|---|---|
| June 22 | stations 3,4 setup |
| June 24 | station 2 setup |
| June 29 | station 1 setup |
| Aug 16 | stations 1-4 removed |
Logbook
The field logbook is available as a wiki.
Quicklook Plots
48 hour time series plots and 1/2 hour spectra plots are available.
The 48 hour time series plots are of 5 minute averages, centered on local noon (12:00 CDT) of each day. Plots containing the current day's data are updated every 15 minutes.
1/2 hour spectra are plotted of selected high-rate variables for two periods each day, from 00:00-00:30 CDT (local CDT midnight) and 12:00-12:30 (local CDT noon). The spectra are smoothed by averaging into 10 bins per decade of frequency, and are multiplied by frequency. The plots are created around 20:00 CDT for the current day.
Preliminary corrections of the tilt of the sonic anemometer W axes have been applied to the 3-D wind data shown on the plots and in the data available for download. See the ISFS tilt correction documentation.
Field Operations Information
ISFS Reference Manuals contain information on how to check the status of the ISFS data systems.
Mast winch wiki instructions describes how to safely lower and raise the tripod mast.
Real-Time Data Display (cockpit) within EOL
To download and run the cockpit program for Linux and Windows, just click on the link cockpit. Java 1.5+ and javaws are required to work with it.
On Macs, users can download the program from the cockpit-mac. Unzip the program, then run the command to start it. (See detailed instructions if needed)
java -d32 -XstartOnFirstThread -jar cockpit.jar
The cockpit program can be run inside the EOL firewall. When the connection window appears, enter grapegarden.eol.ucar.edu as the uni-cast server name (in place of localhost). The port number is 30000. Press search.
Site Layout
 The final station positions are contained in cwex_ncar.kml which can be viewed in Google Earth.
As of Jun 13, this is the proposed layout of the site. The red triangles are ISFS stations. Distances are in meters. The magnetic declination of Ames is 1 deg 19 minutes east.
Instrumentation
The following instrumentation will be deployed at the ISFS stations:
| Sensor | Serial Port | stations | variables | heights (meters) | rate (Hz) |
| CSAT3 Sonic anemometer | 1 | 1-4 | u,v,w,tc,ldiag | 4.5 | 20 [2] |
| Licor 7500 CO2, H2O | 8 | 1,3 | co2,h2o | 4.5 | 20 |
| CSI Krypton Water Vapor | 1 ("serialized" with sonic) | 2,4 | kh2o | 4.5 | 20 |
| RMY Prop Vane Anemometer | 4 | 1-4 | Spd, Dir | 10 | 1 |
| NCAR Hygrothermometer | 5,7 | 1-4 | T, RH | 2, 10 | 1 |
| Vaisala Barometer | 2 | 1-4 | P | 2 | 1 |
| Decagon Leaf Wetness [1] | 6 (mote) | 1 | Wetness (V) | 0.1 | |
| System Voltage | 6 (mote) | 1-4 | Vdsm | 0.1 | |
| GPS | 3 | 1-4 | time,lat,lon | 1 |
Notes:
[1] This is our first deployment of the Decagon Leaf Wetness sensor. We are giving it an excitation voltage of 2.5 V. The voltage response when the sensor is dry is about 10% of the excitation, or about 0.25 V. When the sensor is completely wet, the measured voltage is expected to be around 50% of the excitation, or about 1.25 V, according to the Decagon documentation. The highest actual voltage we have seen is about 0.9 V.
[2] CSAT3 in non-oversampled mode, configuration setting "Ac".
Data Communications
Each station has a Cradlepoint CTR350 router, and a Verizon USB760 3G cellular modem. The stations transmit the full data set in real time over the cellular connection to NCAR, using the UDP socket protocol. UDP is a "good effort" protocol, which will drop data if the connection becomes congested. Short term data dropouts do occur, but this feed does provide a useful real-time indicator of station and sensor status. I estimate that we receive about 98% of the data in real-time.
After 0Z each evening, the previous day's files are copied to NCAR using TCP, which is a "retry many times until 100% success" protocol. This has been working very well, providing 100% data recovery. After the full dataset is received, the 5 minute statistics are re-computed, which fills in the dropouts in the real-time data.
The cellular connection also provides remote login via the secure shell (ssh) to each station, allowing real-time interaction with serial sensors, station monitoring and debugging.
Sensor Notes
CSAT3 Sonic "ldiag" value
The ldiag value shown on the daily plots and in the NetCDF files is unfortunately a bit misleading. The diagnostic value from the CSAT3 will be non-zero on several conditions as described in the CSAT3 manual such as a bad signal amplitude, no signal lock, or poor agreement about the speed of sound across the 3 transducer paths. These conditions are generally related to moisture or other blockage of the sonic transducer paths.
Our processing also sets the ldiag to a 1 if a sample is missing. The real-time data feed, as described above, does not provide 100% recovery. As a result the plots that are made from the real-time data will show non-zero ldiag values due to data dropouts. When the data is reprocessed after the nightly file copy, these dropouts will be filled in and then the ldiag variable should reflect the basic health of the transducer signals, where a value of 0 indicates that no problems have been detected by the CSAT3 logic.
Licor 7500 "lidiag" value
Some information on the diagnostic value for the Licor 7500 is on the CWEX11 wiki logbook, at https://wiki.ucar.edu/x/nougB.
Quality Control
All variables have been edited to reflect times throughout the project when the mast was down as noted in the logbook under the title, Mast Down Events (October 3rd, 2011).
'h2o_2m' and 'h2o_10m'
There were at least two days which experienced errors across all stations for over several hours; one example is July 6th from 04:00 to 10:00 (July 29th is the other). There is no explanation in the logbook for said observances and the event is seen across most recorded variables and at multiple stations. The data has been removed accordingly.
Some odd values were found in the high-rate data for a couple of stations. Starting with NCAR4 on July 19th at 06:08:38 in the morning. A value of '287266.34375 g/m^3' was recorded. Also, on Jul 11th there were several single data points that were anomalously large values again on the magnitude of 105. Each of these outliers were usually reported for a single datapoint surrounded by otherwise good data. The source of the error is still under investigation.
'h2o_4_5m'
To get a grasp on the quality of the 'h20.4.5m' values, the Dielectric Leaf Wetness sensor was utilized to determine when moisture was present; ultimately blocking/disrupting the optical path of the Li-7500 (It should be noted that even partial blockage of the path is sufficient enough to skew measurements). Plotting the 'Wetness' data alongside 'h2o.4.5m' and other related variables helped gauge those occurrences (which grew more frequent as the project progressed). A good example of this behavior is found on July 3rd at 14:45; the voltage of the 'Wetness' rises above its dry-value of 0.265 Volts, indicating a moisture event. That event isn't evident in the 'h2o.4.5m' data until about 15:12, reinforced by "h2o'h2o'.4.5m." One note to make is the difference in time needed after the moisture event for each of the sensors to return to a working state; normally the time needed to dry-off. The Leaf Wetness sensor would usually grow toward a crest voltage and gradually return back to its dry voltage. The time the 'Wetness' sensor took to return to a dry voltage was normally longer than the 'h2o.4.5m.' In the example event from above, July 3rd, the 'Wetness' doesn't recover until around 17:10 while the 'h2o.4.5m' was determined to of recovered by 16:40.
'co2_4_5m'
The 'co2.4.5m' data was edited using the same method as described for the 'h2o.4.5m.' The time after moisture events for the 'co2.4.5m' sensor to recover was usually before that of the 'Wetness' as well as 'h2o.4.5m.' Most edits were strongly collaborated between one another for the Licor's sensors.
'P_2m'
No quality control was needed in the pressure variables aside from mast-down events.
'T_2m' and 'T_10m'
On July 6th for a period of several hours, there were sensor failures across all stations at both 2 and 10 meters. A similar outage took place on July 29th at both heights once more.
'RH_2m' and 'RH_10m'
The 'RH.2m' and 'RH.10m' experienced the same multi-sensor, multi-station error seen as 'T.2m' and 'T.10m' on July 6th and 29th.
'TRH_2m' and 'TRH_10m'
The 'TRH_2m' and 'TRH_10m' were collectively added to from the individual 'T' and 'RH' files to reflect the broadest range of each sensor failure event. It served as a restraint to any sensor failures between the two variables.
'krypton'
The 'kh2o.4.5m' data was plotted against 'H2O.2m' (note that the Licor-7500 had 'h2o.4.5m' sensors but that they were deployed on opposite stations to the Kryptons), and a calculated 'H2O' where the relative humidity was set equal to 100%, 'H2O (RH=100).' With these graphical representations, sensor failures were spotted when the 'kh2o' and 'H2O (RH=100)' converged on one another. Most sources for sensor failure were related to moisture events and could be characterized by sudden drops in 'kh2oV.4.5m' where the voltage abruptly fell below 0.08 Volts.
'Wetness'
The Dielectric Leaf Wetness sensor's "zero" value, or voltage read when the leaf was dry was about 0.265 Volts throughout the duration of the project. Although no edits were needed to the sensor's QC file, it was very useful in the QC-process for 'co2.4.5m' and 'h2o.4.5m.'
'Tcell_4_5m ' and 'Pcell_4_5m'
Aside from mast down events, the only edits needed were when the sensor was turned on at the beginning of the project and had to calibrate to the location.
'prop_dir,' 'prop_spd,' and 'Tbaro_2m'
No edits were needed aside from mast down events.
Data Manager
EOL Archive, NCAR/EOL/DMS