Introduction
Data handling for each sensor category is described below.
3-D Sonic anemometers
CSAT3 or CSAT3A anemometers were deployed at 3m height at all 15 marsh stations. These sensors operated normally, though heavy rain several times during the project disrupted their signal. These rain periods are identified by an internal sensor flag, however some suspicious data during rain was not removed using this flag. Instead, bad periods were identified by the acoustic temperature from the anemometer being significantly different from the T/RH sensor measurements. Since the T/RH data in turn had significant amounts of missing values (due to fan issues -- see below), a median acoustic virtual temperature synthesized from all of the sites was used. When the sonic and T/RH virtual temperatures differed by more than 2 degrees, all data from the sonic anemometer were flagged. After this processing, some sensors were flagged differently from their neighbors. It isn't clear whether this is due to different sensor response or different sensitivity to the 2 degree threshold. It was decided to create one flag for of the 3m sonic anemometers for the entire project, since the source of the errors should have been rain, which was relatively uniform over the domain. All of the flagged data has been removed in the final data set.
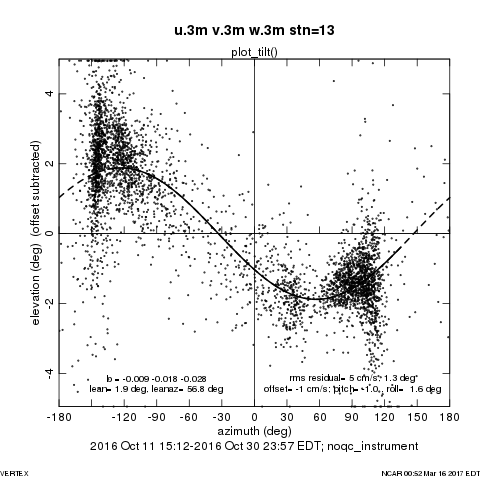
On 10 Oct, we decided to add a water vapor (and carbon dioxide) flux sensor to s13 (to compare with s15). Due to the type of hardware available, this required changing the CSAT3 at this site to a CSAT3A.
RMYoung 81000 anemometers belonging to the PI were deployed at 10, 25, 33, 42, and 49m heights on the 50m tower. Similar to the CSAT3s, these operated normally except during heavy rain. Again, an internal sensor flag indicated these periods and was used to remove bad samples from the final data set. (Though this will require new NIDAS code to handle a 5-field sonic.)
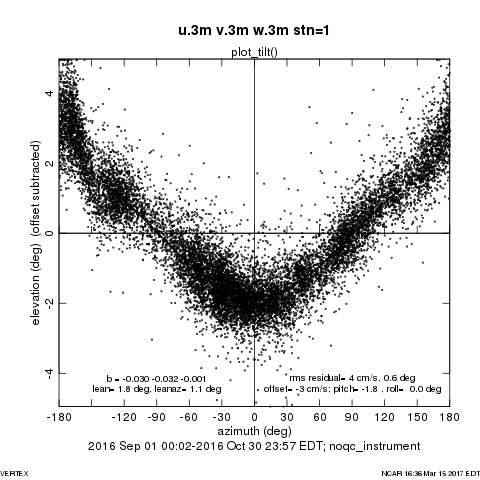
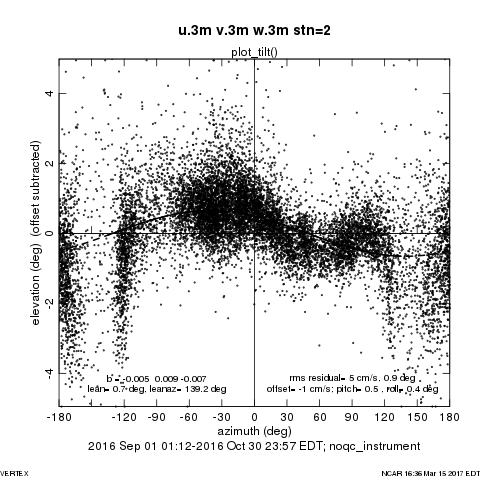
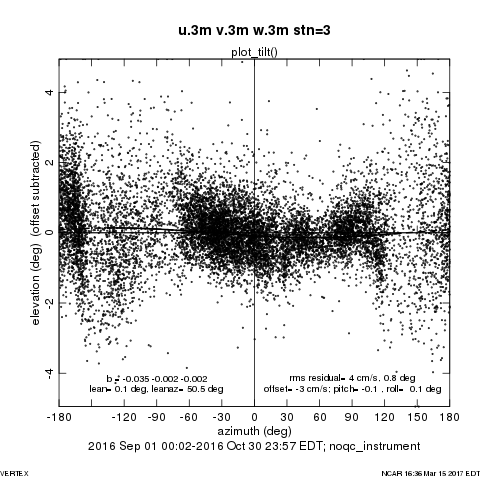
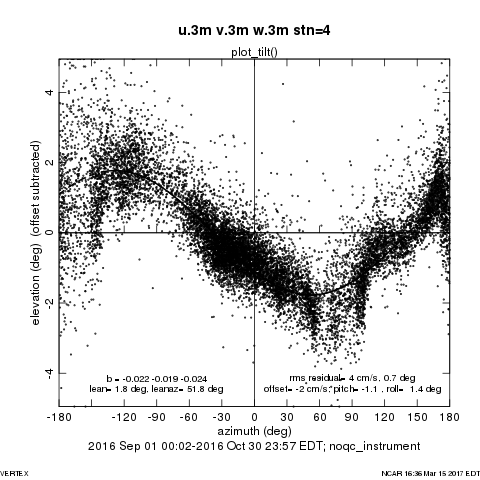
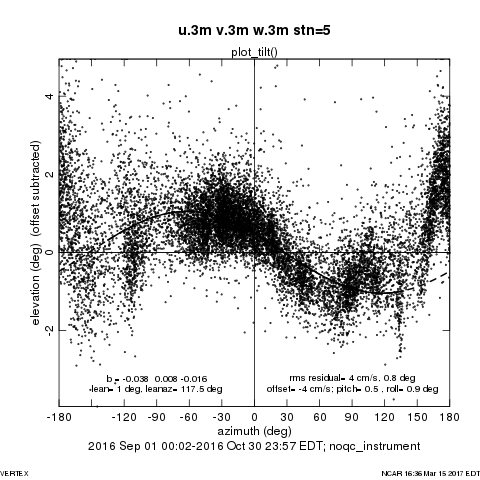
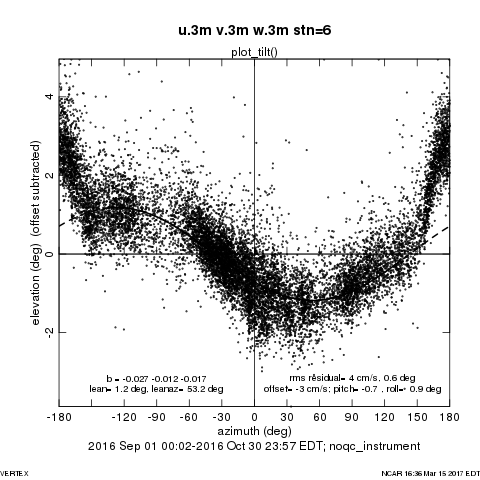
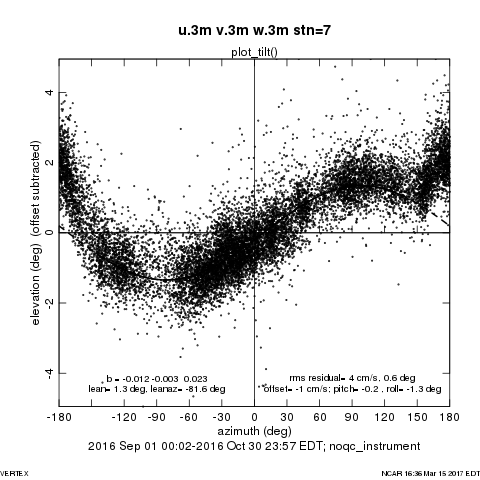
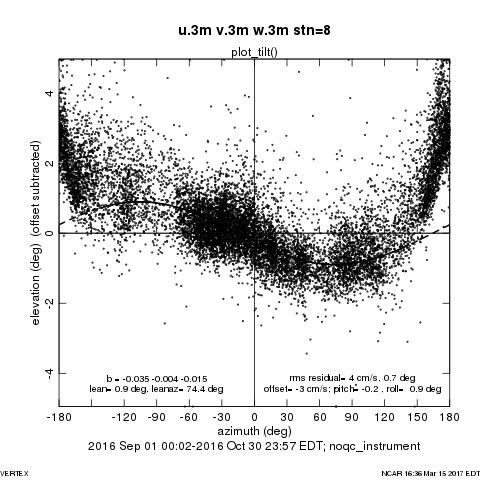
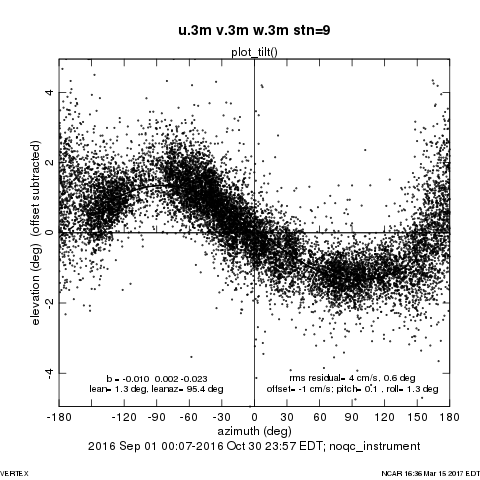
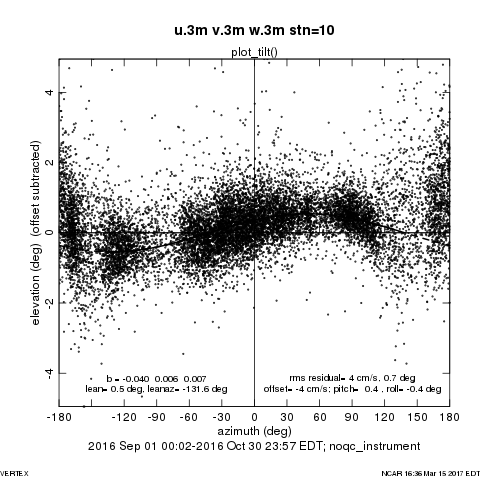
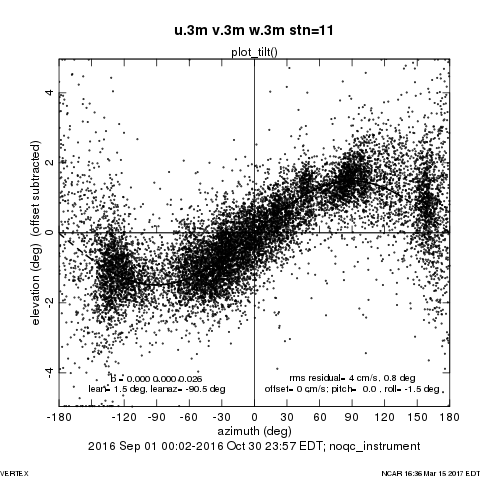
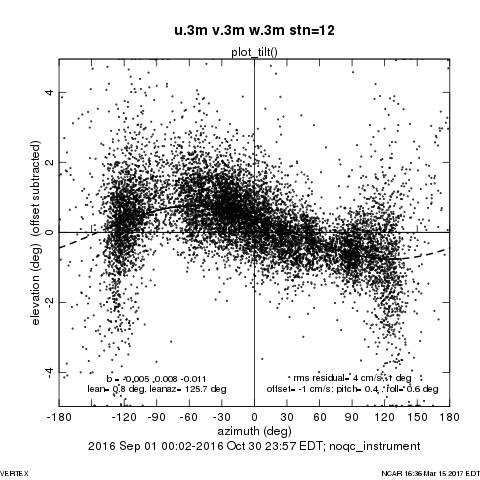
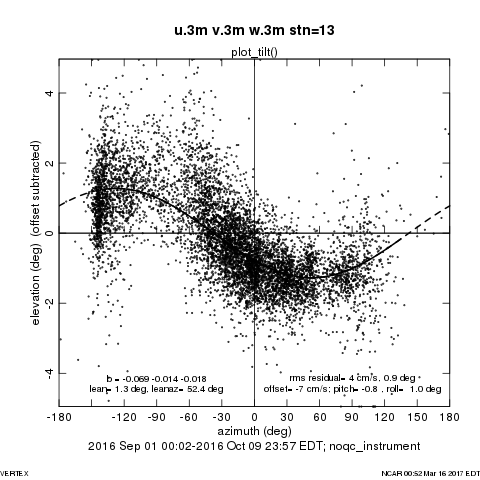
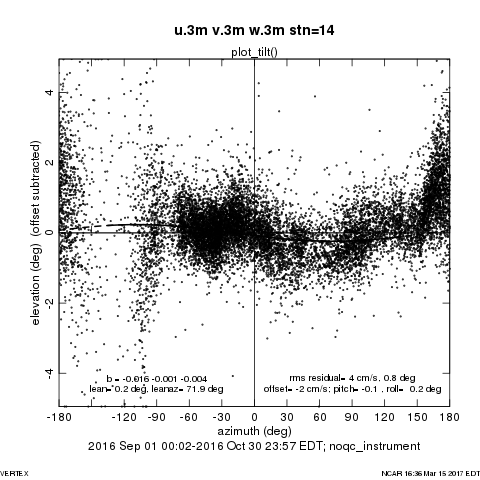
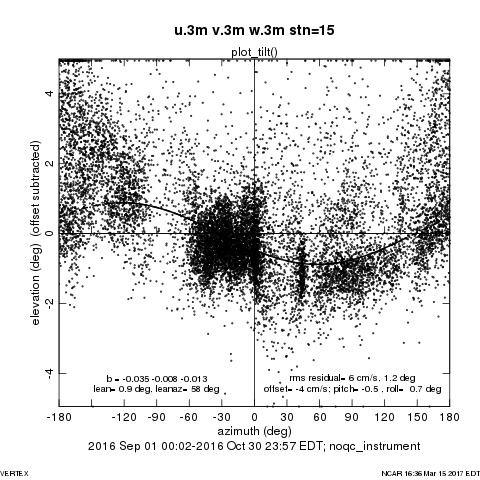
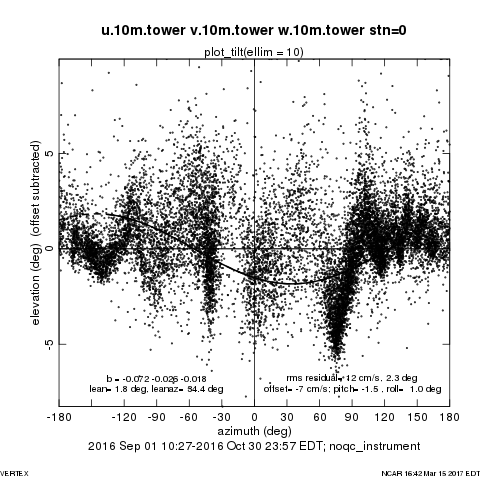
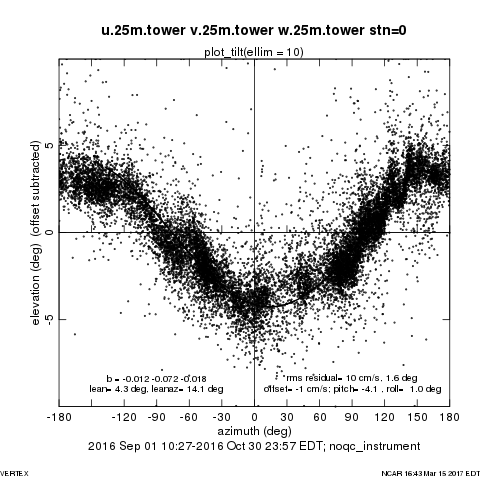
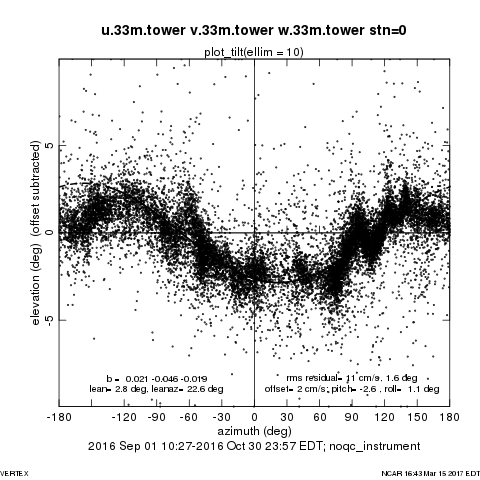
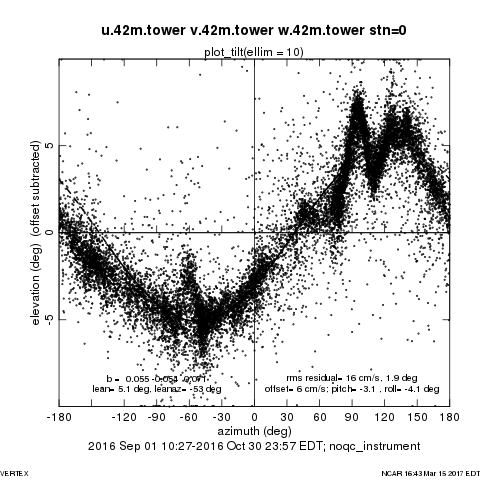
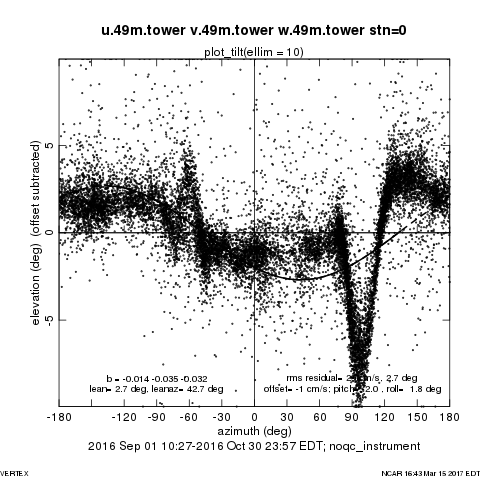
The results of planar-fit tilt corrections are below. (should redo after QC cleanup) All of the marsh stations have tilts less than 2 degrees, which is normal. Only one station (s13, that was changed during the project) has a bias in the vertical velocity greater than the manufacturer's specification of 4 cm/s in magnitude. After the s13 swap, the magnitude of the w-bias went below 1 cm/s. The tower anemometers have tilt angles up to 5 degrees. This rather large value likely is due to the inability to align the booms accurately given their construction. One of the anemometers (10m) also shows a w-bias of 7.5 cm/s, where 5 cm/s is the manufacturer's specification. Since the fit for this level has large deviations from planar behavior, it is possible that this high value is real, representing the influence of nearby buildings.
We have not yet attempted to look at gain or biases in the virtual temperature measurements from these sensors.
| Position | Lean (deg) | Lean Azimuth (deg rel N) | w-bias (cm/s) |
|---|---|---|---|
| s1 | 1.8 | 1.1 | -3.0 |
| s2 | 0.7 | 139.2 | -0.5 |
| s3 | 0.1 | 50.5 | -3.5 |
| s4 | 1.8 | 51.8 | -2.2 |
| s5 | 1.0 | 117.5 | -3.8 |
| s6 | 1.2 | 53.2 | -2.7 |
| s7 | 1.3 | -81.6 | -1.2 |
| s8 | 0.9 | 74.4 | -3.5 |
| s9 | 1.3 | 95.4 | -1.0 |
| s10 | 0.5 | -131.6 | -4.0 |
| s11 | 1.5 | -90.5 | 0.0 |
| s12 | 0.8 | 125.7 | -0.5 |
| s13 (CSAT3; CSAT3A) | 1.3; 1.8 | 52.4; 56.8 | -6.8; -0.8 |
| s14 | 0.2 | 71.9 | -1.6 |
| s15 | 0.9 | 58.0 | -3.5 |
| 10m | 1.8 | 54.4 | -7.2 |
| 25m | 4.3 | 14.1 | -1.2 |
| 33m | 2.8 | 22.6 | 2.1 |
| 42m | 5.1 | -53.0 | 5.5 |
| 49m | 2.7 | 42.7 | -1.4 |
Infrared gas analyzers
An EC-150 H2O/CO2 open-path gas analyzer was deployed at s15 during the entire project. On 11 Oct, another EC-150 was added to s13 to give an independent measure of the latent heat flux. Both sensors gave bad values in dew and rain, presumably caused by liquid water obscuring the optics. The sensors' internal data quality flag appears to be a poor indicator of these cases and values from the wetness sensors also did not catch all of these cases. Instead, data were flagged when the reported values for h2o differed by more than 1 g/m3 from the value of H2O calculated from the station's TRH sensor. These h2o-generated flags were applied to the co2 values as well.
The s15 sensor appeared to develop time-varying biases of up to 5 g/m3 in h2o and 0.1 g/m3 in co2. The h2o biases were estimated subjectively based on the station's TRH H2O values. This was done prior to generating the QC flag from the same two signals and thus depends on the time period used. In general, biases were not changed on time scales shorter than 12 hours, which appeared to capture most of the continuous good periods.
The co2 biases from s15 were estimated (again subjectively) to match those from s13 when they were both deployed. Biases for earlier period were generated to create time continuity with the later data. Note that this process was not related to an absolute calibration standard. However, the resultant values were close to 400ppmV from this process, which is reasonable.
The s13 sensor calibrations appeared to be stable during its (shorter) period of deployment and were not adjusted. However, this sensor's diagnostic flag reported a "source too high" failure about 5% of the time during this period. This flag probably is related to worn bearings in the sensor that will be replaced. Our software removes data when this flag is set. The remaining values appear to be reasonable.
2-D Sonic anemometers
Gill Windobservers were deployed at 10m height at all 15 stations. Like the 3-D anemometers, these sensors operated normally, though rain disrupted their signal. These rain periods were identified by the sensor and are not included the final data set.
Wind directions have been calculated using the measured boom angles. We could look at high-wind (assumed to have uniform winds) to adjust these angles. This has not yet been done.
Temperature/humidity sensors
NCAR TRH sensors were deployed at 2m height all marsh stations and at (nearly) the same 5 heights as the 2-D sonics on the 50m tower. A fan controller/monitor circuit board in several of these aspirated sensors failed during the project, as water penetrated the conformal coating on these boards. In some cases, the fan was operating even though no current (Ifan) was reported to the fan motor. In other cases, the fan stopped and data should be removed due to the possibility of radiation errors on the sensor. The data will be examined manually to determine whether these errors were present during cases when Ifan was low and should be removed.
On 7 Sep, the sensor at s11 was replaced since it appeared to be reporting ~0.5C high. The post-calibration found that this sensor read 0.71C too high, so this value has been used to correct the data in post processing.
The sensor at s13 had bad data from 14-16 Sep and later at 23-26 Oct. The sensor was replaced each of these times. Bad data have been removed from the final data set.
The sensor at 42m reported strange Ifan values for several weeks, even reporting 0 for a week and then recovering to normal values. Nevertheless, the data from this sensor appear to be reasonable (though RH.42m was about 2% high) until 9 Oct, when it stopped reporting. When it restarted on 11 Oct, its temperature values were ~2C high and RH values ~6% low. The post-calibration found gain changes with this sensor (both T and RH), with magnitudes of 2.7C and 2.3%, that do not fit the adjacent 33 and 49m readings better than just a constant offset for either period. Thus, the final data set uses empirical estimates of T and RH biases for this sensor, so values should be used with caution.
T/RH Table:
| Position | SNs | Ifan: Action |
|---|---|---|
| s1 | 70, 45 on 5 Oct | Zero last month (deliberate) |
| s2 | 69 (housing w/Ifan=0 changed on 4 Oct) | Zero last month (deliberate) |
| s3 | 9 | drop 4 Oct okay, but T/RH bad 1 Oct: edited |
| s4 | 62 removed 4 Oct, 70 on 7 Oct | Always good |
| s5 | 16 | several drops: edited |
| s6 | 34 | Always good |
| s7 | 53, 62 on 7 Oct | Always good |
| s8 | 36 | Always good |
| s9 | 58, 49 on 4 Oct (Ifan=0) | Zero last month (deliberate) |
| s10 | 4 | Zero last month (deliberate) |
| s11 | 26, 29 on 6 Sep, 38 on 28 Sep | drop 28 Sep, can't trust T/RH: edited |
| s12 | 39 | Always good |
| s13 | 61, 11 on 16 Sep, 58 on 26 Oct | Always good |
| s14 | 45, 29 on 4 Oct | drop 29 Sep, T/RH look OK: no action |
| s15 | 64 | Always good |
| 10m | 32 | Always good |
| 25m | 28 | Always good |
| 33m | 27 | Drop in middle, T/RH change: edited |
| 42m | 59 | Drops throughout, but data only have offsets: added offsets |
| 49m | 57 | Zero last weeks, but data seem okay |
Barometers
PTB220 barometers deployed at s1 (B1), s3 (B7), and s15 (B4) operated normally connected to single-plate static ports. In addition, each EC-150 sensor had an internal PTB110 barometer connected to a bulkhead-mounted scintered metal frit.
In post calibration, all 3 PTB220 were noticed to have a small deviation from unity gain, that is thought to be related to an error in the pre-experiment calibration. Fits to the post-calibration data have been applied in the final data set.
The PTB110 readings were 0.3 and 0.2mb lower at s13 and s15, respectively, than the PTB220 readings. The difference of 0.5m in the heights of these sensors does not explain this difference in readings. We have removed these offsets in the final data set.
The PTB110 at s15 values still have rather large differences (up to 4mb) from the other 4 barometers. Upon unpacking in the lab, the connector to the barometer inside the electronics box (EC100 #1426), was not completely seated, which could have caused this problem. This cannot be corrected in the data -- users should instead use the PTB220 that was at this station. This would have created a 0.4% error in the air density used to compute H2O and CO2 densities at this station, which would be a small effect.
Radiometers
Three 4-component integrated radiometers (NR01) were deployed, along with soil heat sensors, at 3 locations to measure part of the surface energy balance. As it turned out, the heat transfer by water flowing over the surface (which was not measured during this study), dominated the energy balance, so the energy balance will be incomplete. Initially, all 3 radiometers were deployed at s15 (since it was easiest to access for radiometer cleaning), but the existance of surface water everywhere at this site early in the project probably was not representative of the entire study area. Thus, one radiometer was moved to s1 (11 Sep) and another to s9 (14 Sep).
Rsw.in.m1.s15 was bad until a wiring issue was fixed on 9 Sep. The earlier data will be removed, though the two other sensors at this site were operating well to provide the same measurement.
The NR01s were cleaned every 1--2 weeks, though frequent rains also kept the domes relatively clean. Readings during the manual cleanings have been removed.
The NR01s were mounted on camera tripods that apparently shifted orientation on the soft surface over time. They were releveled during the early manual cleanings and again on 19 Oct at s1 and s9 and 20 Oct at s15. Since Rsw.in.s15 didn't change much, we'll assume that it was level throughout. It is interesting that Rsw.in.s9 was actually higher when it wasn't level during clear days; apparently it was tilted to the South. As an example of the error, Rsw.in peak values on 18 Oct were 645, 716, and 687 W/m2 for s1,9,15, respectively. This would be an error of -6% for s1 and +4% for s9.
Wetness sensors were deployed at all 3 sites to determine when moisture may have been present on the NR01 domes. However on 12 Sep, s15's sensor was moved to be vertical, close to the ground, in order to monitor if water was present on the surface. (Due to the repeated soaking in salt water experienced by this sensor, it was extensively bio-fowled and an attempt at post-project cleaning destroyed it.) Thus, we have used readings from the wetness sensors at s1 and s9 to indicating when the radiometer data should be removed from the final data set. We note that significant amounts of dew formed on every clear-sky night, so the nighttime sampling is biased towards cloudy conditions.
With the near-surface wetness sensor at s15, it should be possible to determine when water was not on the surface and compute an energy balance just during these periods. Spot checks of this calculation do not show a significant reduction in the imbalance during these periods, which may indicate that (unmeasured) water movement through the soil still was transporting large amount of heat.
Soil sensors
As mentioned above, soil sensors initially were deployed at s15, then moved also to s1 and s9. Some of the sensors were installed shortly before readings were taken. In normal soils, data shouldn't be used until the soil "heals", however the tidal flows and soil structure made it likely that the probes were reading properly quite soon. This is corroborated by the readings not changing significantly with time after the installation.
Tsoil profile and Gsoil sensors operated as expected. (We will check pre and post-calibrations for the Tsoil sensors.) During the project, the soil temperature changed from more than 25C to about 10C. It is interesting to observe the tidal signature superimposed on the diurnal variation of especially Gsoil. Note that our standard application of a Phillip correction to Gsoil will have to be changed since a time series of Cv values is not available.
The EC-5 Qsoil sensor at s1 gradually failed and was removed on 24 Sep. By taking the probe and wisard module to s15, the probe itself was determined to be bad. Visual inspection of this probe in the lab did not show an obvious failure point. (The data on 1604-1608 27 Sep when this testing was done are removed by a range check on Qsoil values.) A new probe was installed 5 Oct. Before the probe change, s1 and s15 reported nearly the same values. After the change, s1 values were on the order of 1.5% lower than s15, likely due to a slight difference in subplot characteristics. At 1510 on 18 Oct, the probe at s9 also reported intermittent constant values that will be removed. It was not replaced.
Gravimetric samples were taken once at each site. More samples were not deemed necessary since the EC-5 values were nearly constant throughout the experiment. These samples produced values of 98%, 90%, and 89% at sites s1, s9, and s15, respectively. Since a change in the gain of the EC-5 sensors cannot be determined from only one sample, we are forced to treat the differences as a simple bias (of 36%, 23%, and 24%, respectively for s1, s9, and s15). Our intent is to adjust the EC-5 readings using these offsets, though we advise users of these data simply to treat soil moisture content as constant throughout the project.
A bug in the program to collect data from the soil thermal properties probe prevented this sensor from being recorded in the field. Knowing this, only one TP01 sensor was initially deployed (at s15). Data were taken manually on 17 Oct. on the s15 probe and a probe deployed at s1 on 11 Oct in preparation for this measurement. Since the Qsoil measurements had shown Qsoil to be nearly constant, Cv also should be nearly constant. Thus, using the values Cv=5.4e6 and 3.5e6 for s1 and s15, respectively, for the entire project should be adequate. It is unfortunate that these values are so different, since no difference in surface was obvious at these two sites (though s15 was close to a "mosquito ditch" with, perhaps, more clay content.
We note that the Cv, soil density, and gravimetric Qsoil values are all consistent with our personal observations that the "soil" was in fact a thick (though low density) plant mat acting like a sponge to hold water, with a small amount of clay.
Precipitation
A siphoning tipping bucket rain gauge was deployed at s4 on 9 Sep. It operated normally throughout the project. Test tips at the time of deployment have been removed from the final data.


