Prior to the MARVELOUS project, students were informed that they would be working in small groups (3-4 students) to generate a final project relating to and analyzing one or more aspects of the radar and POD data collected4 during the project. The final project would entail writing up a synopsis of the weather event, summarizing the main features of interest (what their group found to “stand out” to them) in both the radar and POD data, and presenting their findings to a group of their peers.
The findings of the groups were highly variable, not the least of which came from two astute groups who, early on in the project (right after the first IOP, and prior to the next class meeting), discovered (1) that the DOW velocity data, although it had been displaying correctly in the truck, appeared to be “reversed” in sign for the entire deployment and (2) that some of the POD data was showing incorrect timestamps. These were significant discoveries; ones that prevented erroneous analyses for the entire class; thankfully, there were “quick fix” solutions to remedy the situation. However, the fact that students were able to compare their own recollections/observations of being out in the field with readings they had obtained with handheld anemometers in the field and the POD data and the DOW data allowed them to see that even the high-tech instruments used in the field of meteorology are not without errors; it was a highly valuable lesson regarding data analysis as well as data integrity.
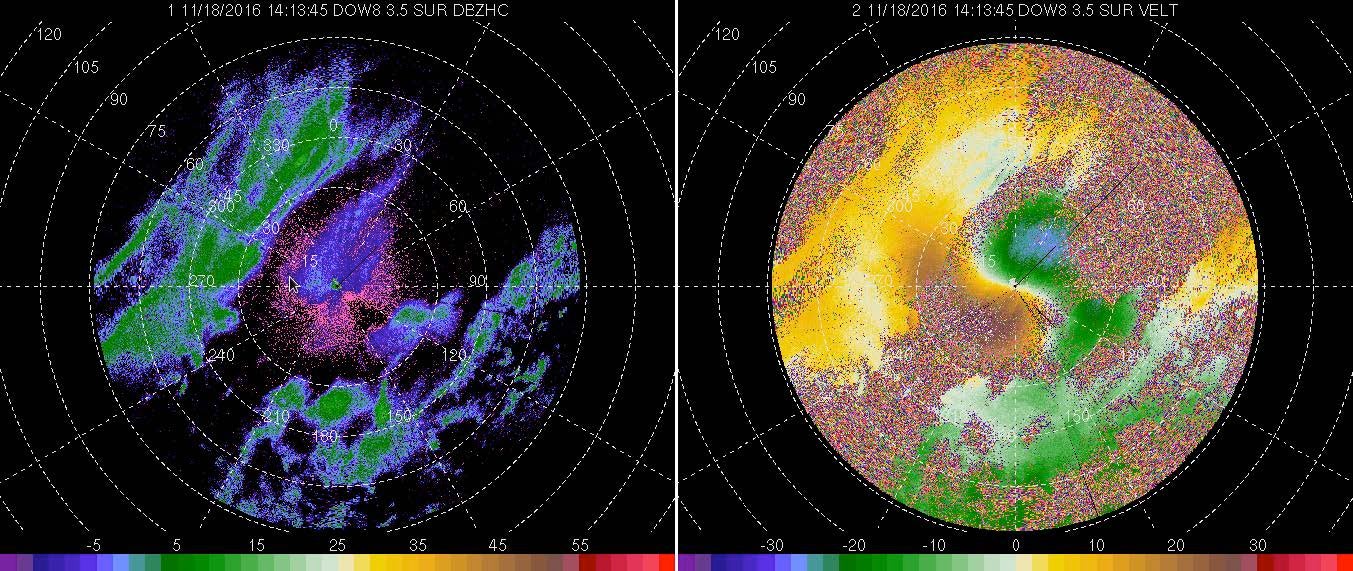
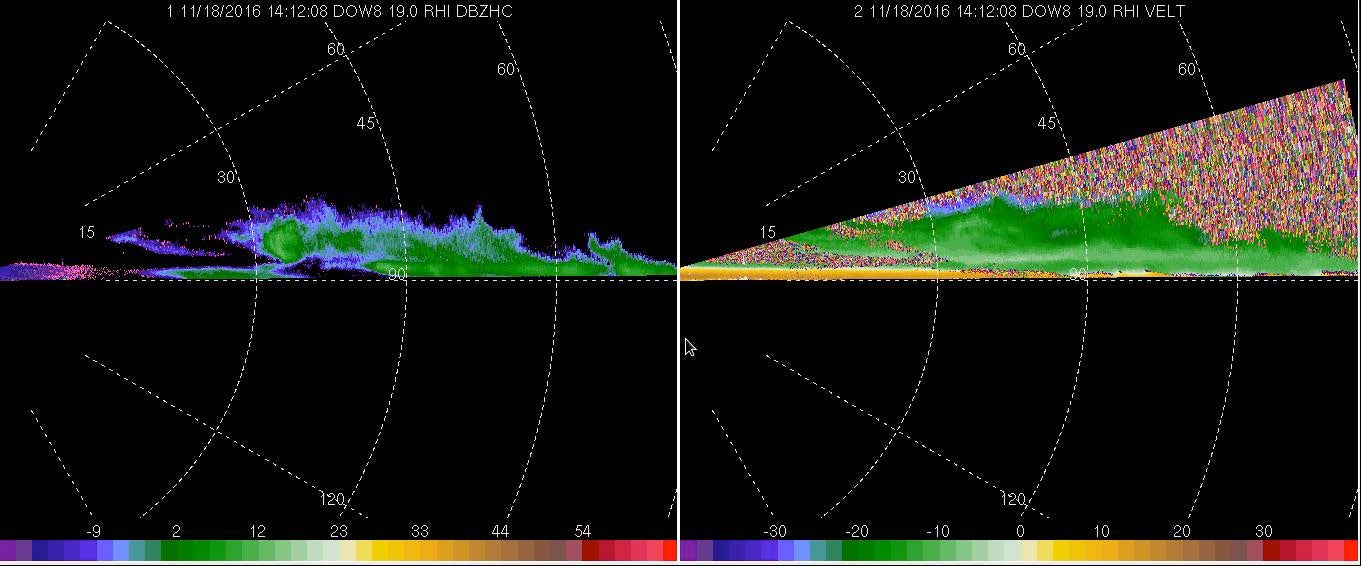
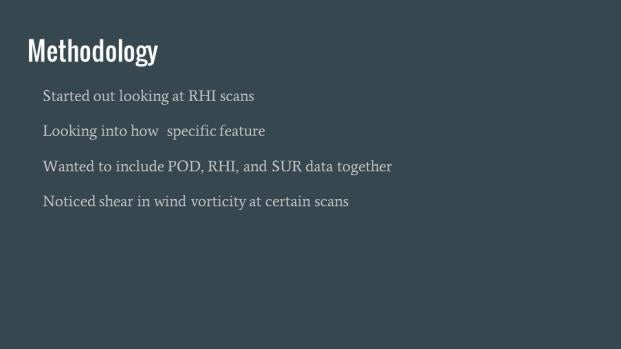
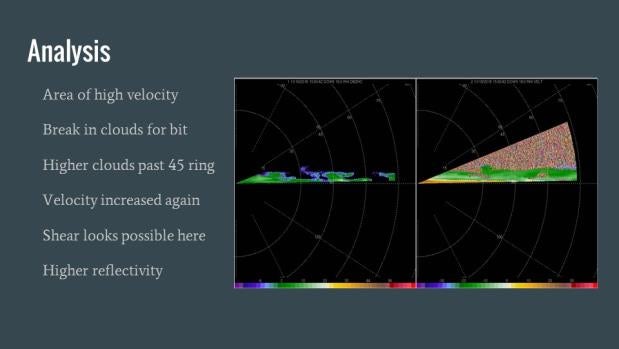
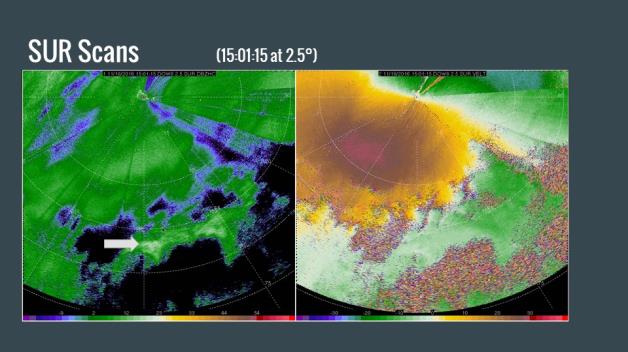
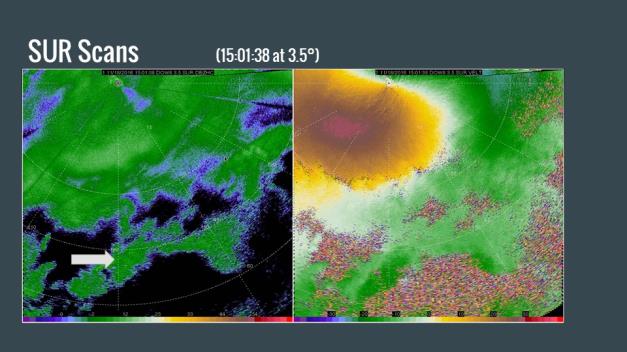
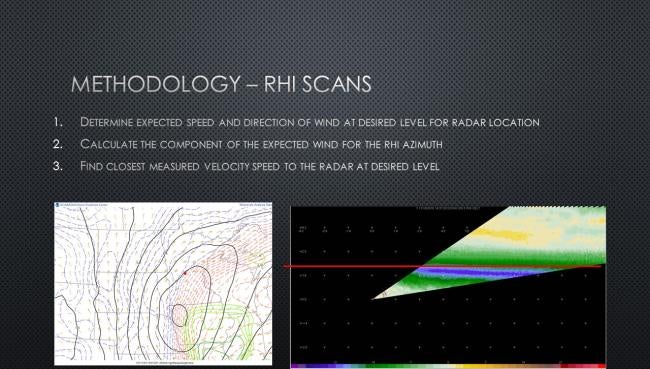
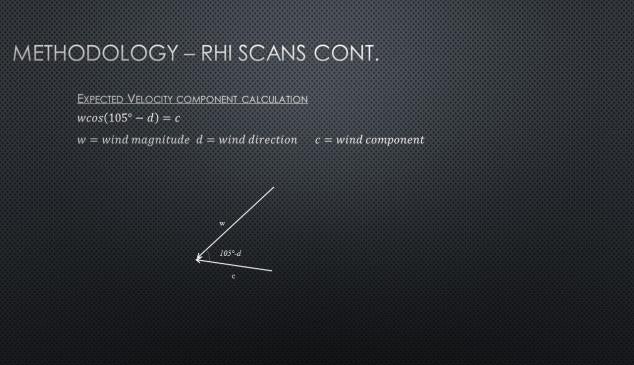
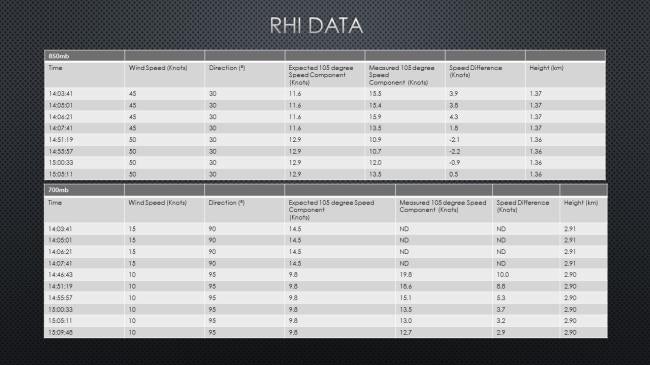
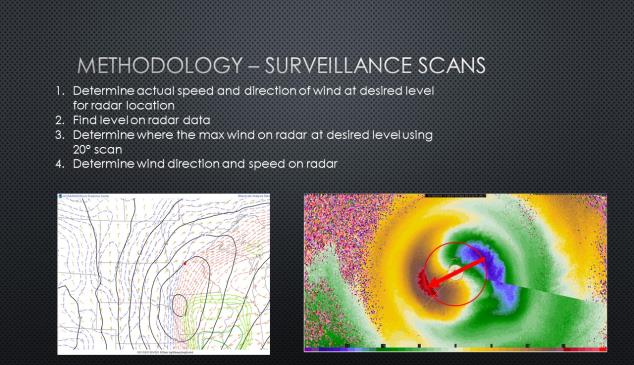
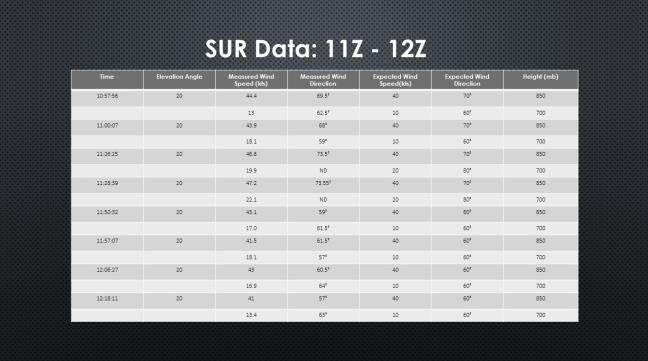
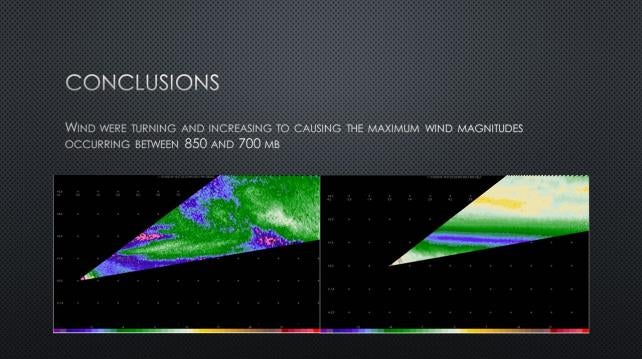
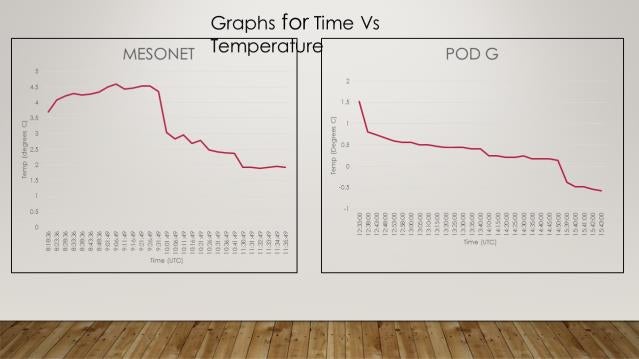
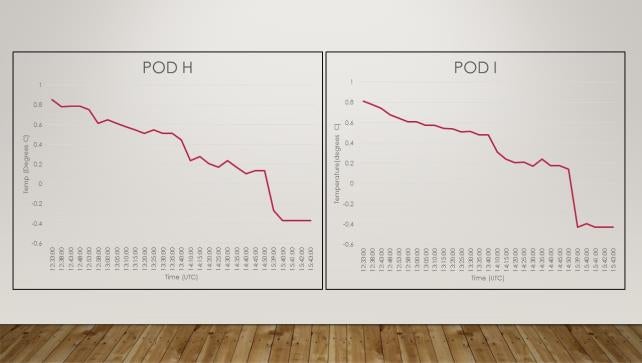
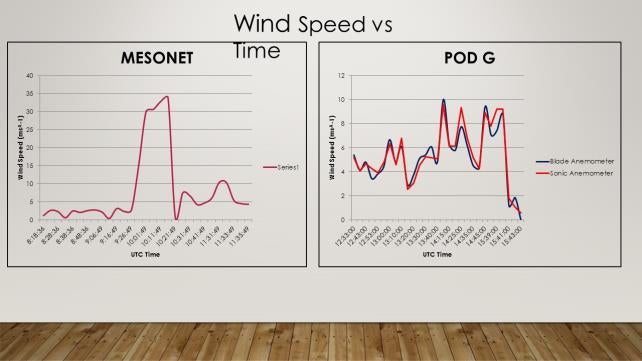
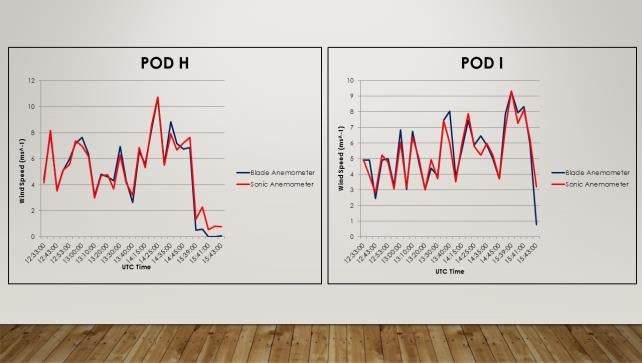
Once the quality control issues were fixed, and because it was by no means accidental that the deployment time span captured a period of noticeable intensification of the precipitation event5, there were many routes of analysis from which the student groups could choose. Analysis of the data by the student groups included the investigation of the development of a low-level jet during IOP I, comparisons between the POD readings, comparisons of the POD/DOW mesonet readings and those of local NWS observations (specifically, comparing ASOS station readings to those of the PODs and the DOW mesonet), the evolution of conditions experienced throughout the deployment in the context of the larger synoptic setup, and the comparison of DOW multielevation angle measurements with atmospheric soundings. A sample of some student
presentation slides appears in Figures 8, 9a-d, 10a-f, and 11a-d.
Student groups were responsible for the write-ups and presentations as mentioned earlier, and they presented their findings to their peers. Each group, since they chose a different aspect of the deployment to examine, fielded a host of questions from their peers as well as PI Humphrey. Overall grades for the final project (including reports, field logs, pictures, notes, presentations, etc.) ranged from B- to A+.
In addition to the final projects, students were alerted to the fact that they can collaborate with PI Humphrey on radar analysis during future semesters. As of this report, she has had three students who have expressed interest in continuing with radar analysis (from IOPs I and II, as well as additional DOW data) as contributing to and being incorporated into their Senior Research projects.
At the end of the project, students were given an informal questionnaire meant to gauge the effectiveness and impact of MARVELOUS on contributing to meaningful student learning, performance and interest in the AHS 468 course. Results of the questionnaire (as well as additional feedback on the project from other interested/impacted parties) are discussed later in this report.