Use of the UWKA data in courses and in student assignments, and assessment of success
In this section, each of the instructors describe the TECPEC experience in their course, and assess the success of the field activity, from their own experience and based on input from the students.
-
UU ATMOS 3100 (Atmospheric Chemistry and Air Pollution; John Lin & Gannet Hallar)
The objective of this undergraduate class is for the students to obtain a scientific understanding of the processes that lead to various air pollution events. The chemical reactions underlying formation of fine particulate matter (PM2.5) and tropospheric ozone are key topics. The class also focuses on the sources and controls on greenhouse gases such as carbon dioxide (CO2) and methane (CH4).
Drs. Hallar and Lin co-taught this class during the Spring 2019 semester (enrollment of 31 students of various STEM majors). The TECPEC campaign was discussed during class, and all students were invited to the open house (Section 4). One student from this class, Andy Park, was able to fly aboard the King Air. The instruments onboard the UWKA relevant to air quality were quite limited, and there were only a few air quality flights, but this experience served as a pilot project that may form the basis of a future educational deployment request focused solely on air quality and greenhouse gases in basins in the Interior West in winter. -
UU ATMOS 5130 (Atmospheric Thermodynamics; Gannet Hallar)
Dr. Hallar also taught Atmospheric Thermodynamics in the Spring 2019 semester. All three graduate students in this class participated in the TECPEC campaign. They either launched weather balloons at the University of Utah or were able to fly aboard the King Air. Each student's final class presentation included information pertaining to the TECPEC campaign. These students looked carefully at data collected, focusing on the local thermodynamics, both during the flights around the Salt Lake Valley and collected via the local radiosonde launches. -
UW ATSC 5350 (Radar Meteorology; Jeff French)
The Radar Meteorology course at UW is targeted towards advanced graduate students who have completed the core graduate-level coursework. The students in this class typically have a moderate- to advanced-level understanding of topics in mesoscale dynamics and cloud physics with enough background in radiation and scattering theory to be able to apply and interpret advanced radar techniques to study real-world science questions. Six students took the course, including 5 PhD level and 1 second-year MS level student. Of those students, 3 of them have thesis/dissertation research projects focused on utilizing observational data sets with 2 of those principally using in situ measurements and the third using radar measurements. The other 3 students all have dissertation research projects focused on numerical modeling and indicated a primary reason for taking this course was to learn about the collection and use of radar measurements as a tool for model validation and evaluation. For these students, this course and the inclusion of TECPEC was their first in-depth opportunity to ‘dig into’ observational data sets.
The lecture portion of the course focused on basic radar theory and covered topics such as the development of the radar equation, antenna theory, Doppler theory for full Doppler spectra and pulse-pair algorithm, radar polarization theory and parameters measured. We included applications of all of these topics and discussed applications, especially at differing wavelengths. This was critical for TECPEC since students focused on data from two profiling mm-wave radars, one at W-band and one at Ka-band; these two wavelengths are usually not discussed indepth in radar meteorology classes, yet they have become more important to research in recent years, in particular with the launch of the CloudSat and GPM radars into space.
Homework sets and term projects were centered around the use of measurements from the airborne W-band cloud Doppler radar (WCR), and the airborne Ka-band precipitation radar (KPR) to investigate microphysical and dynamical structure of the orographic winter clouds sampled during TECPEC. From the beginning of the class, students learned how to access the data and produce basic plots. This work was accomplished in computer labs and within teams of
two students: in each team, the more advanced student (the one with experience utilizing these data) helped guiding the less experienced student. Students learned ‘real-world’ consequences of applying different SNR thresholds, impacts of a moving platform on Doppler measurements, how the presence of liquid water can significantly impact radar measurements due to attenuation; and impacts of Mie scattering at short wavelengths.
Students worked individually to develop term projects. Some students worked specifically on examining and quantifying data quality while others focused on interpreting measurements for understanding cloud microphysics and/or dynamics of orographic cloud systems. Term project ideas were developed early in the semester so that students could use their ideas to influence the decision of (1) whether or not to fly in a particular storm and (2) how to adjust flight patterns to acquire data necessary to meet the objectives of their project. All students participated in the daily weather and flight-planning meetings. All students in the class also flew on the aircraft and each directed at least one of the flights. The opportunity to develop a flight pattern and actually direct the flight is unique—in most research projects, students may participate in flights by operating instruments, but rarely do they have opportunities to fully direct a flight.
Data from all research flights (RFs) (Section 3) were used in student projects. One of the most widely used cases was RF1. WCR data from one of the flight legs during RF1 are shown in Fig. 1.
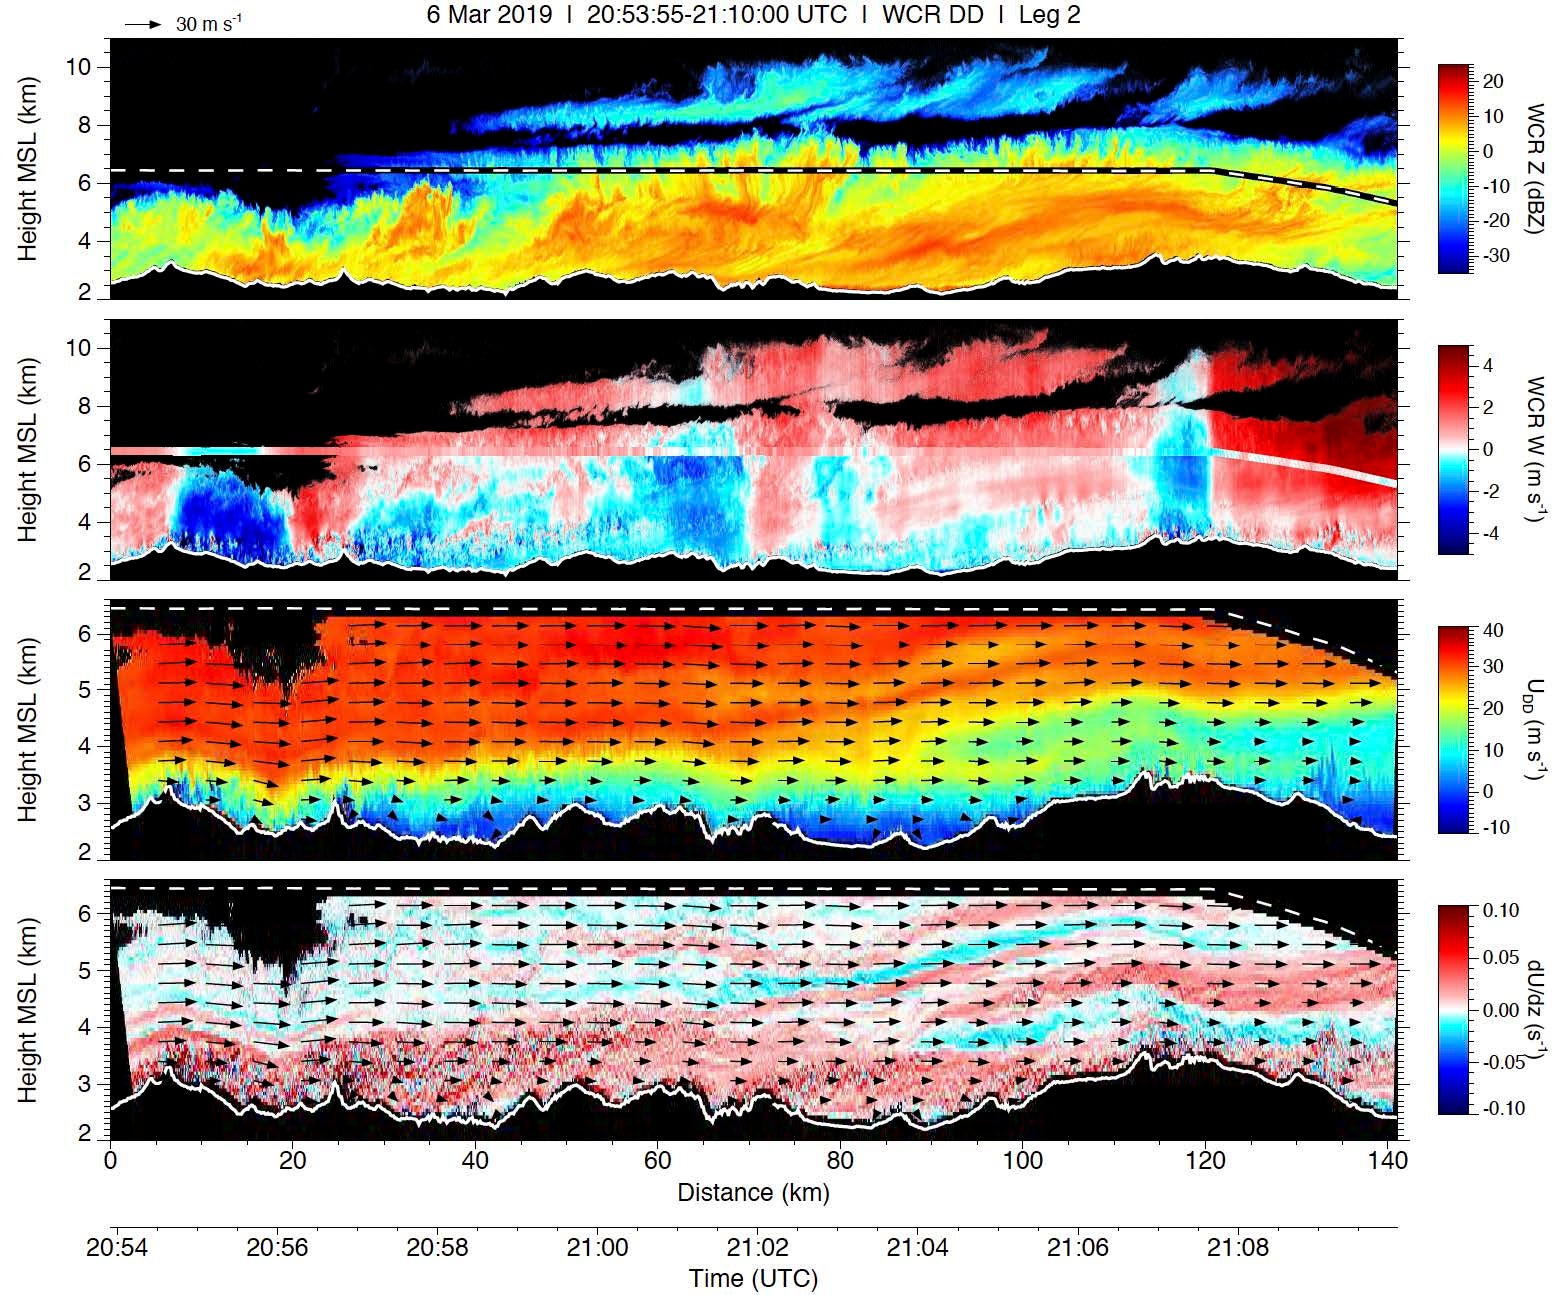
Fig. 1: A 142 km long transect of Wyoming Cloud Radar (WCR) data from SW to NE across (from left to right) the Elkhead Range, the hills of the Sierra Madre, and the Medicine Bow Range in northern Colorado / southern Wyoming on 6 March 2019. There are two axes on the bottom, time (aircraft flight time) and distance (more relevant for our purpose). The panel is oriented so that the prevailing flow is from the left, i.e. upstream is on the left and downstream on the right. As evident from radiosonde data collected by students in Saratoga, WY, along this track (near x=85 km) at the time of the overflight, the wind generally was from the SW, except near the surface where it was from the SE. (image courtesy Coltin Grasmick, one of the students in ATSC 5350).
Panel 1: WCR reflectivity. The white dashed line is the UW King Air flight level. The black area below is the ground, in all 4 panels.
Panel 2: WCR vertical velocity (w) & flight level vertical velocity. Red is up, blue is down. Note, the gust probe on the KA measures air velocity while the WCR measures velocity of hydrometeors. To make them more comparable, we removed the estimated hydrometeor fall speed (1 m/s for unrimed snow) from WCR values. The TECPEC sounding (Fig. 2) was used to correct for horizontal velocity contamination on the vertical velocity. The up-antenna w may be a bit too high, and the down antenna w a bit too low, because of some uncertainty in the exact pointing angles of the WCR antennas.
Panel 3: Along-track wind speed, with circulation vectors. This information is available below flight level only, as it requires the two WCR antennas (nadir, slant-nadir) pointing below flight level (“dual-Doppler synthesis”). Resolution of dual-Doppler is 60m x 60m, flight-level wind data are used to correct attitude deviations.
Panel 4: Shear of the along-track wind (i.e., the vertical derivative of panel 3: du/dz)
The six specific student term projects were:
- ‘Comparison between calculated radar reflectivity factor from in situ precipitation probes and observed close-range values from the WCR’
- ‘Quantifying the effects of aircraft motions on observed Doppler spectral width for the WCR’
- ‘Evaluating ground surface velocity residuals in WCR measurements’
- ‘Comparison of radar dual-pol hydrometeor classification to in situ measured particle habits’
- ‘Investigation of potential 3D beam misalignment between up and down pointing beams in the WCR through the examination of Doppler velocity variation across flight level’
- ‘Calculations of dual-wavelength ratio from the KPR and WCR during TECPEC’
As part of this radar class, TECPEC provided hands-on experience operating a radar and using radar data that is rarely accessible to students in a classroom. The data set provided by TECPEC will continue to be used in future Radar Meteorology classes at UW.
All registered graduate students participated in the daily "Zoom" web-based conference calls, and took responsibility for at least one weather briefing that led to flight decisions.
One student (Michael Wessler) had a specific interest in fine-scale orographic precipitation, so he took full responsibility for producing the flight plan for Research Flight 6, on a day with widespread snow over the mountains with the melting band some 300 m above the valley floor. Prof. Zipser was flight scientist for RF6 and it was carried out successfully as planned.
Preparations for the 21-23 March flights in the SLC area began weeks earlier, engaging the class in learning the essential differences between S, X, Ku, Ka, and W-band radars, using references from previous King Air research flights. The enormous difference in vertical resolution (vs. 88D) available from the King Air's Ka and W band radars made a strong impression on the students, and for those working with CloudSat data this was especially revealing.
The class spent the better part of one month preparing for and then viewing first the quick-look data from the TECPEC flights, and later the excellent "superplot" images.
An unexpected lesson in interpreting ground clutter emerged from Flight 6 over the Oquirrh and Wasatch Mountains. While it was not unexpected that the WSR-88D would see these mountains as ground clutter, it was indeed surprising that the downloaded 88D radial velocity data showed the mountains moving rather rapidly (!). We puzzled over this during the class period reviewing and comparing the W- and S-band data from this flight, and finally consulted the authors of the Radar Meteorology book used in the class (Rauber and Nesbitt 2018). They explained that while the main lobes of clutter were removed, that the side lobes had radial velocity (Vr) biased by the inability of the clutter suppression software to distinguish precipitation which did have a nonzero Vr and the mountains which of course do not.
- UW ATSC 5016 (Synoptic and Mesoscale Meteorology; Bart Geerts)
There were 5 students in the Synoptic and Mesoscale Meteorology class, all first-year graduate students. They were responsible for the daily weather forecasts as well as radiosonde balloon launches. Radiosonde balloons were launched either from Saratoga WY (for the flights over the mountains west of Laramie WY), or else from Salt Lake City area (for flights near SLC) (Fig. 2). All five students were trained in the use of the radiosonde system, and they travelled in groups of two to launch the balloons and collect the data. Three students also participated in the UWKA flights (Section 3).
The mesoscale component of this class focused on stratified flow over complex terrain. Several RFs were used to examine the WCR-derived flow over complex terrain along long flight tracks over the mountains southwest of Laramie, as well as over the Wasatch Range near SLC. WCR-derived images such as the one shown in Fig. 1 were made available to the students in this class, for all along-wind flight legs on all RFs focused on orographic precipitation (Table 1).
Other than the weather briefings and radiosonde data collection, students were given two assignments. In the first one, a major homework, students used the WCR transects (as in Fig. 1), in combination with the radiosonde data they had collected, to study the effect of wind, wind shear, and static stability (stratification) on vertical velocity, wind patterns, and precipitation across mountain ranges. They had to sort through all the transects, and combine them with skew T soundings, to come up with systematic patterns, e.g. upstream blocking, unblocked flow, lee plunging, and release of potential instability.
The second assignment, done in the lab, focused on the main RF studied in this class, i.e. RF1 (Fig. 1). For this RF, they were provided with not just the WCR transects, but also the WCR along-track and vertical velocity CFADS (colored frequency by altitude diagrams), for both the upwind and the downwind side of individual mountain ranges. This partitioning was done to allow students to explore the relationship between environmental factors (wind, wind shear, and stratification) and cross-mountain wind acceleration and cross-mountain changes in vertical velocity. The students also ran a 1 km resolution WRF simulation of the RF1 case, in order to place the transects in a mesoscale context. They also compared the model output against WCR observations, along the same transect as shown in Fig. 1. Students presented their lab assignments orally, and this allowed to compare each other’s work, and raise more science questions that were outside the scope of this class.
Both the WCR transects (as in Fig. 1) and the CFADs (not shown were provided by Coltin Grasmick, one of the students in ATSC 5350. - UU ATMOS 6230 (Mesoscale / Radar Meteorology; Ed Zipser)
This class had 3 M.S. and 3 Ph.D. students registered, with frequent voluntary attendance by 3 additional graduate students and 2 PostDocs. All 10 were engaged in TECPEC to some extent, and all 10 viewed the King Air at the Open House, and all 10 took part in the local balloon launches in support of TECPEC flights in the Salt Lake area from 21 - 23 March.