17 March 2018
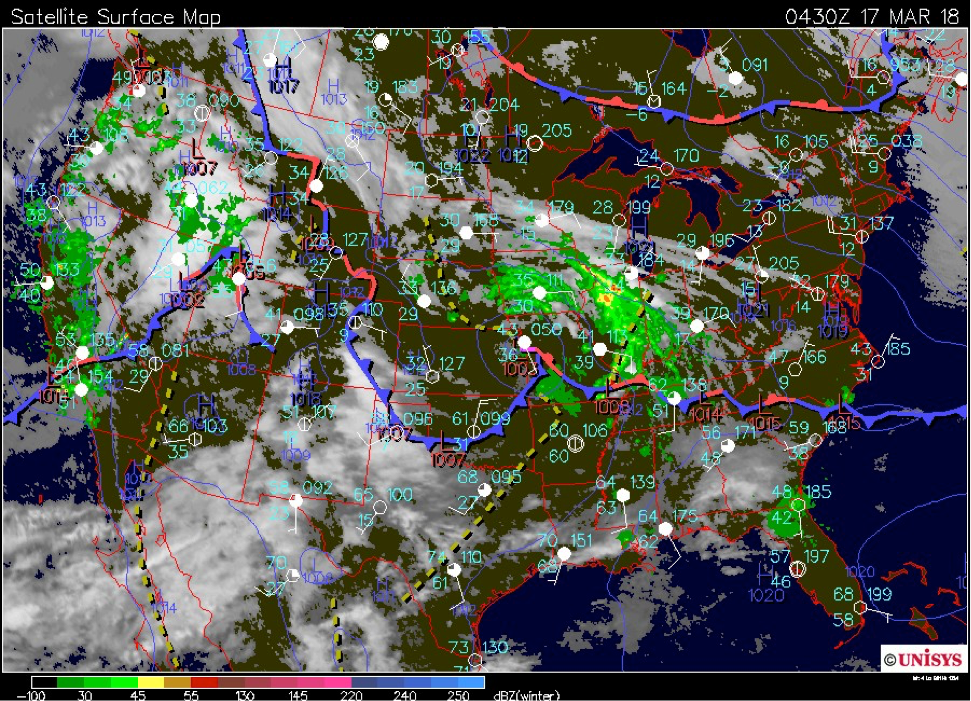
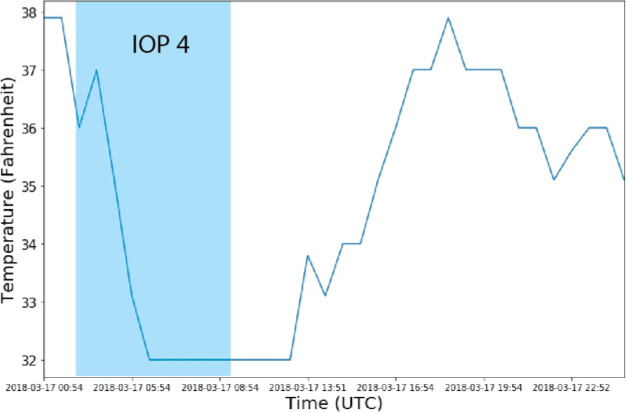
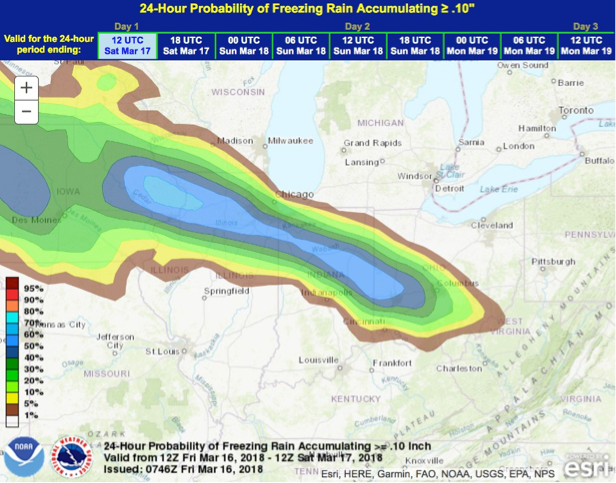
Following 10 days of quiescent weather, the final IOP of PurRad 2018 occurred on 17 March, the last day of the educational deployment. As a surface low (Fig. 19) passed over southern Illinois, cold Canadian air spilled into Indiana from the north and northwest, dropping surface temperatures to 0 °C across the Lafayette area (Fig. 20). In the North American Mesoscale model, a broad warm nose (not shown), centered around 850 mb, was forecast to persist for several hours after the surface frontal passage. Because of this forecast sandwiching of a relatively warm layer of air between two sub-freezing layers within the precipitation band, a widespread and long-duration freezing rain event was forecast, with the probability of freezing rain greater than 0.1 inch at ACRE greater than 50% (Fig. 21). Based upon this forecast, IOP 4 was conducted overnight as a refreezing signature hunt. From 0200 to 0900 UTC, deep volumes (0.5 to 20°) were collected, interspersed with RHI scans perpendicular to precipitation motion and a sequence of five birdbath scans at the end of each volume. An additional RHI was collected over a disdrometer deployed at the PI’s residence.
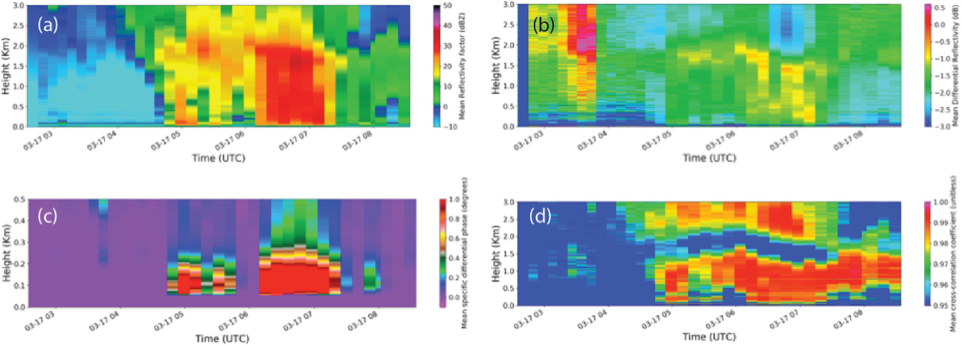
EAPS 52300 student M. Sharma generated QVPs from the 6° DOW PPIs (Fig. 19), revealing fluctuations of up to 500 m in the top and bottom heights of the melting layer over the ACRE site. Although ice glaze accumulated on the DOW and on the other instruments, no sleet was observed at ACRE, nor was a refreezing signature (Kumjian et al. 2013) conclusively identified in the QVPs. Attenuation and differential attenuation were observed above the melting layer during the heaviest precipitation at 0630 UTC (Fig. 22b).