Meteorological Operations (IOPs)
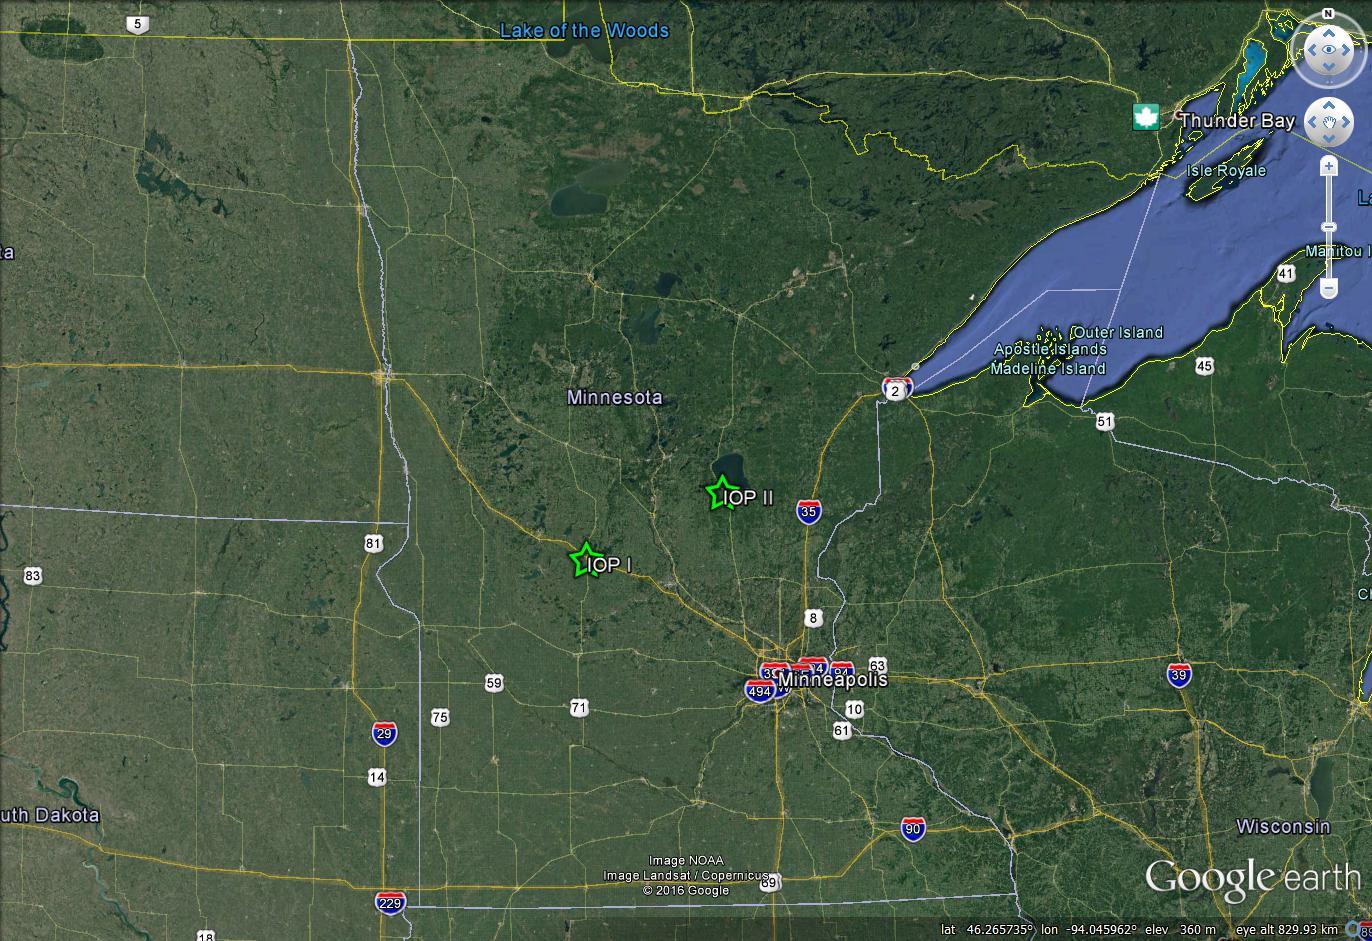
As with many educational projects, longer-duration off-site field operations were constrained by observable weather as well as the availability of students during times above and beyond regularly-scheduled class periods. However, a rather “unusually quiet and mild” start to the MN autumn gave way to a more active weather pattern by the time the DOW arrived in St. Cloud; fortuitously, the weather and students’ schedules occasionally aligned. As a result, there were two main opportunities for Intensive Operation Periods (IOPs), where students intercepted, observed and collected data on inclement winter weather. The first took place in Sauk Centre, MN on 18 November (UTC) and the second took place along the SW shores of Mille Lacs Lake on 6-7 December (UTC). Table 1 and Fig. 2 show deployment characteristics of IOPs I and II.
| Date (UTC) / IOP ID | Deployment Duration (UTC) |
Deployment Location (Lat/Lon) |
Mission Attempted | # of Participating Undergraduates |
| 18 Nov. 2016, IOP-I |
1000 – 1650 | 45.71897/ -94.95112 |
Interception of transitioning precipitation (liquid-to-frozen) in approaching winter storm | 15 |
| 6-7 Dec. 2016, IOP-II |
2200 - 0330 | 46.1225/ -93.6606 |
Lake-effect snow band initiation over Mille Lacs Lake | 7 |
Prior to each deployment, undergraduate students enrolled in AHS 468 as well as other students from the AHS department conducted discussions pertaining to the small and large-scale meteorological setups of each event as well as the deployment sites most likely to result in the best datasets possible for the given conditions. Students and PIs Humphrey and Srock met the day before each event to get a “baseline” or feeling for what conditions were to be expected. During the discussion, students shared their insights as to what thermodynamic and dynamic forcings would be causing the event, where the best deployment site(s) would be, and the most effective scanning and transmission strategies to employ during the deployments. (This all built upon prior concepts discussed earlier in the semester in AHS 468.) Students and PIs subsequently met 12- and 6-hours prior to expected departure time, with a “final call” being given about an hour prior to leaving for each IOP’s destination. Descriptions of each IOP appear below.
IOP-I: 18 November 2016 – Transitioning precipitation intercept
In the afternoon (~1200 Local Time, LT) and evening (~1800 LT) of 17 November, student-led weather forecast discussions (for an event due to impact the region on 18 November) were held with minimal instructor/PI input. In each discussion, students forecasted the meteorology behind the event and selected a target deployment region in order to be in position to capture a transition line between frozen and liquid precipitation. In their discussions, students utilized Google Earth to pick out appropriate deployment sites and discussed at great lengths where the best deployment site would be. Although there were a few students who wished to go further NW, it was preliminarily decided that, to ensure that the maximum number of students could participate in the IOP (multiple vehicles were employed due to the sheer volume of student interest), the target region would be in Sauk Centre (Fig. 2). At 0200 LT on 18 November, a “final call” decision was made to go forward with the deployment, and the students and PI Humphrey met at the SCSU campus, departing by 0300 LT and arriving to the deployment site by 0400 LT.
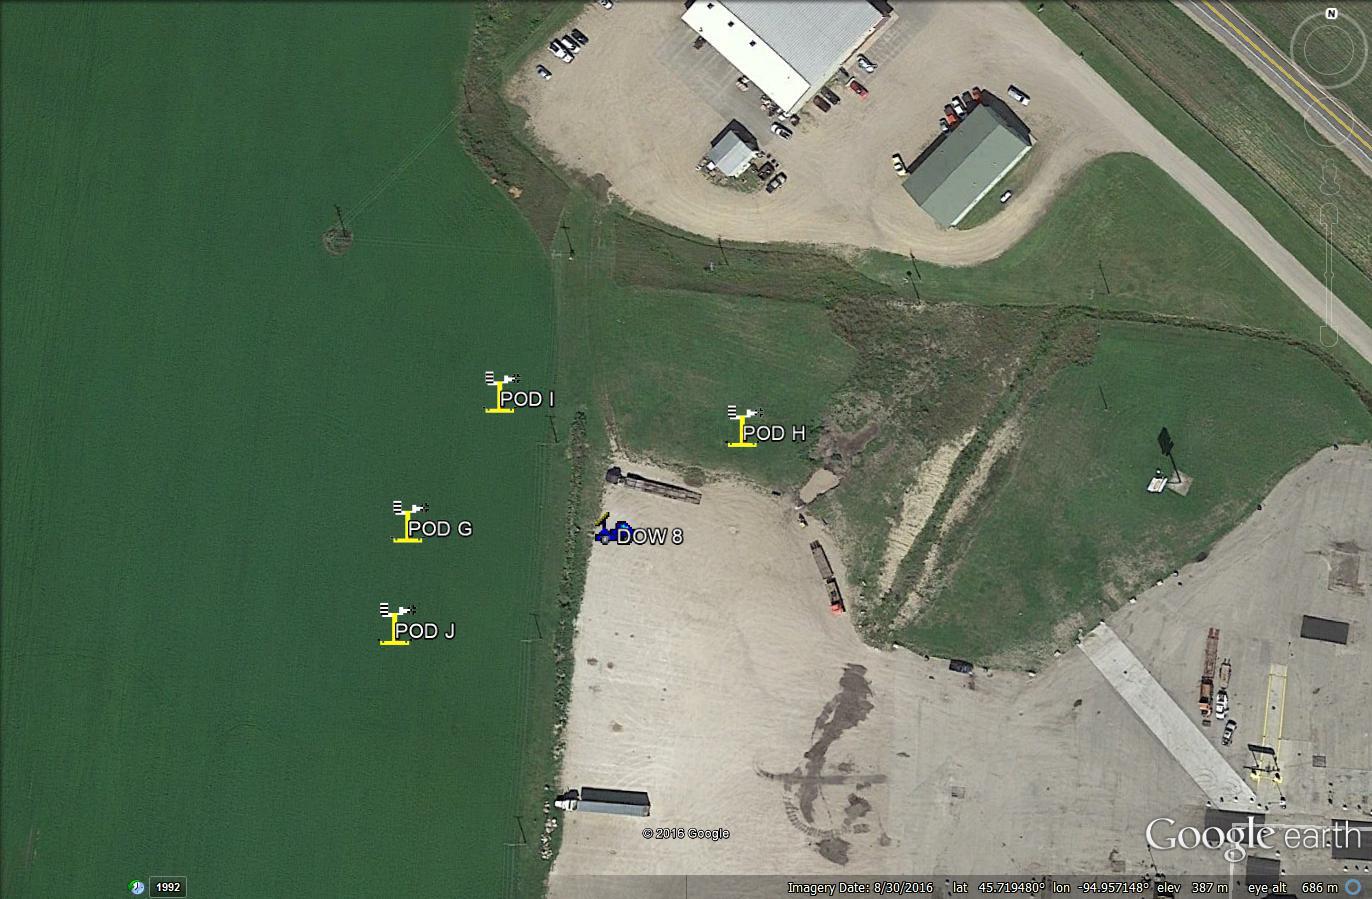
The DOW was operational and collecting data shortly after 0400 LT, and all PODs (four in total) were deployed within about an hour of site arrival (Fig. 3). This was the first IOP of the project, and, as a result fact, not all of the participants had completed training on DOW operations yet. However, this IOP provided a “learn-on-the-go” environment in which they could ask questions in real-time as they learned and implemented the proper sequence for bringing the radar up, selected various configuration files, etc. It also presented numerous opportunities for peer-to-peer teaching moments, as students who had already been trained on equipment usage and programming were encouraged to share and demonstrate their knowledge with the students who had not yet “officially” learned the operational methodology in a “hands-on” capacity.
In addition, the changing weather conditions throughout the deployment (from liquid to semifrozen to all-frozen precipitation) afforded students the ability make concrete connections between what had been discussed during the prior weeks and in the textbook with what they were, quite literally, seeing directly in front of them on the screen. Furthermore, they were able to build upon their prior knowledge as well as their in-field conditions to adjust their scanning strategies accordingly. Several students noticed a large amount of ground clutter was blocking the radar beam, while another noticed that the higher elevation angles weren’t allowing them to see the development of the lower-level jet, and so discussions were had “on the fly” to remedy that and ensured a useful dataset was obtained. The ability (and willingness) of students to make such decisions while immediately seeing the results of their decisions in real-time was something to which they definitely responded positively and enthusiastically (see Figs. 4 and 5).


In addition to the prescribed field logs, students were encouraged to take notes on their own throughout the deployment. Though they were allowed to take notes in any format they wished, many opted to take notes electronically, a sample of which appears in Figure 6.
With no direct guidance3 provided for individualized student note-taking, when it came time to analyze the first IOP’s data, students worked in conjunction with one another to cobble together bits of incomplete or “solitary” information in the form of notes. It was quickly observed that as a direct benefit of having students fill out prescribed logs as well as taking their own notes (without reminders as to the pertinent information to record in their own notes), students began to understand and realize the importance of thorough note-taking during fieldwork. (Perhaps unsurprisingly, as a result of the first “cobbling” activity, the students’ individualized notes taken during the second IOP were more complete than in those taken during the first IOP.)
Though IOP-I was initially intended to go through 1200 LT on 18 November, deteriorating weather and road conditions – observed, monitored and analyzed by the SCSU students throughout the deployment – resulted in a truncated deployment, with the entire crew leaving the site around 1030 LT. The caravan of the DOW, Scout vehicle and a handful of student vehicles traveled together back to St. Cloud and arrived safely. During the next class period, the dataset was disseminated to the entire class (as well as additional AHS students) for analysis. Some results of the students’ data analysis appear in a later section within this report.
IOP-II: 6-7 December 2016 – Lake-effect snow initiation
During the afternoon of 6 December, PI Humphrey was approached by AHS 468 students who said they had been holding informal weather discussions on their own and were interested in attempting a mission to intercept lake-effect snow over Mille Lacs Lake in east-central MN. They also informed the PI that they had selected appropriate deployment sites for both the DOW and the PODs during the deployment. At approximately 1700 LT, the decision was made to depart to the deployment site, which is shown in Fig. 7.
Throughout the deployment, students opted to run sector scans instead of full 360° scans, due to the instrument positioning along the lake shore resulting in approximately 210 degrees of blockage. As the deployment occurred during the evening (dark) hours, students relied heavily on the live radar imagery to calculate the most effective scanning strategies to ensure a beneficial dataset. (Extreme caution was also employed for the POD deployments, as the selected locations were along a road shoulder which sat atop a steep drop-off directly over the lake.)
During the course of the deployment, students observed (and, as a result, augmented their scanning rates, elevation angles and selected configuration files for the transmitter) the development of a weak lake-effect banding of snow was observed. Though not a particularly strong or long-lived event, the students responded positively to the IOP, expressing interest in analyzing the data. Due to the time constraints of the MARVELOUS project (the end of which coincided with the end of the Fall 2016 semester at SCSU), students were given copies of the dataset from the second IOP, but did not have time to do in-class analysis of the data. Thus, at the time of this report, students have not had a chance to generate IOP II-derived plots in SOLOII or Excel; such analysis is expected to continue into the upcoming semester and beyond.
In addition to the two main IOPs, students also collected radar and POD data on the SCSU campus during two “transitioning precipitation” events (both occurring on 4 December). Although the on-campus deployment sites were far from ideal for radar line-of-sight limitations, the atmosphere provided enough variable weather on this day to warrant student interest. This also afforded the opportunity for additional students in the AHS department (as well as one very interested father of an AHS student) to learn how to level, operate, and collect data with the DOW as well as deploy PODs and analyze the data collected by the various instrumentation. Again, due to the end-of-semester time limitations, students will be analyzing the data next semester.