There were three intensive observation periods (IOPs) during MEDOW: April 2, 2016; April 4, 2016; and April 7, 2016. Students from the Radar Meteorology, Meso- and Storm-Scale Meteorology and Physical Meteorology courses participated in the three IOPs. Additionally, two students worked with Dr. Brian Billings on a case study resulting from one of the IOPs. The results of this study will be presented at the 2016 AMS Conference on Mountain Meteorology in June in Burlington, VT.
 |
 |
||
|
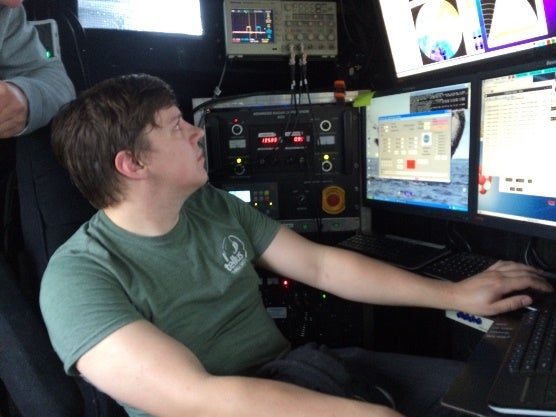
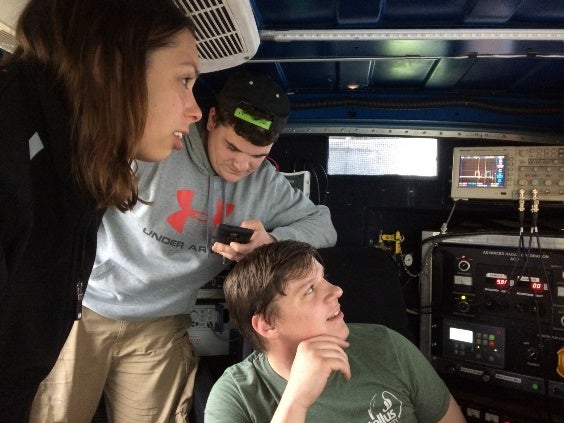
Fig 3a & b: Students actively participated in the IOPs. Left Image: James Perkins. Right Image: from left: Amanda Sleinkofer, Corey Tober, and James Perkins.
|
|||
Intensive Observing Period 1
 |
|
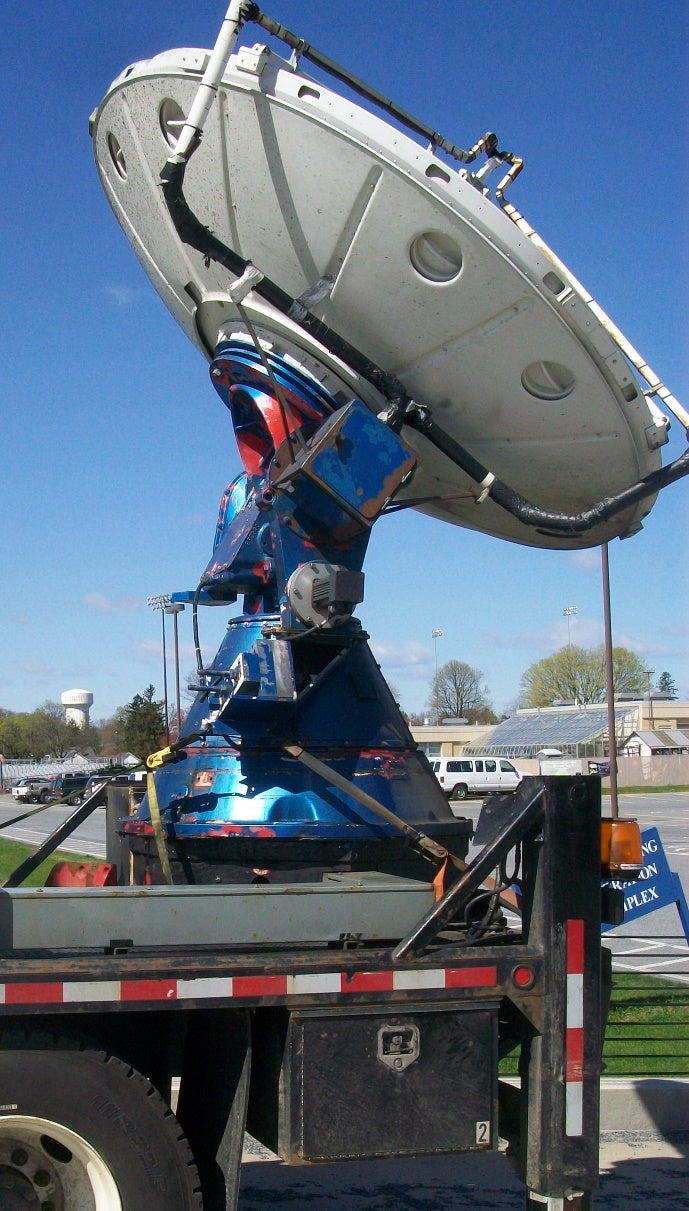
Fig 4: DOW 6 during IOP 1 on April 3, 2016. The Millersville water tower is visible in the background.
|
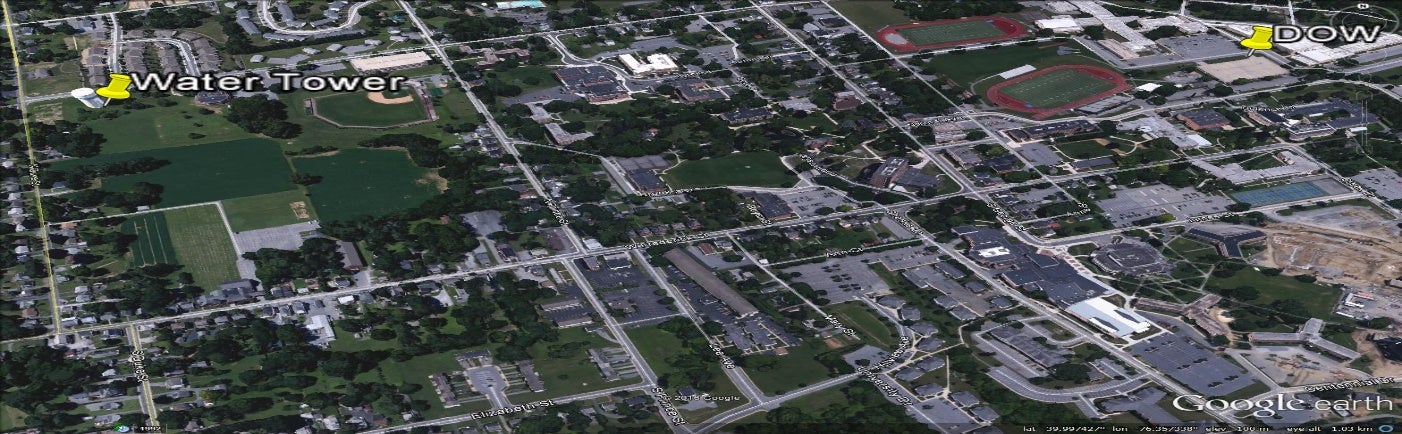
The top deck of a two-story parking garage on the north end of the campus of Millersville University provides a clear view of several ground targets with known dimensions (Fig. 4). Therefore, on Sunday, April 3rd the DOW 6 was deployed to this site as the lot is typically unused on the weekend. The objective was to use radar-measured reflectivities and different target geometries to estimate the gain of the DOW’s antennae using the radar equation, which had been introduced in the Physical Meteorology and Radar Meteorology courses. Since the weather on this day was mostly clear, the ground targets stood out clearly on the scans. Students would visit the site during the two hours of observations to see the data being collected and attempt to locate certain landmarks. One example was a large water tower located to the west of the parking garage that can be seem near the same location on the 1° elevation scans (Fig. 5).
 |
||
 |
||
|
Fig 5a & b: Location of the water tower in relationship to the DOW (top) and corresponding image of received power over the same street grid (bottom)
|
||
Intensive Observing Period 2
The first precipitation event after the training and major outreach event had been completed occurred during the afternoon of Monday, April 4th. The DOW 6 was deployed along a road west of Millersville University (about three miles west of the campus) that offered relatively high ground and few low-level obstructions. Students from the Radar Meteorology course who had already received training accompanied the radar and operated it for approximately two hours as the precipitation passed over the area.
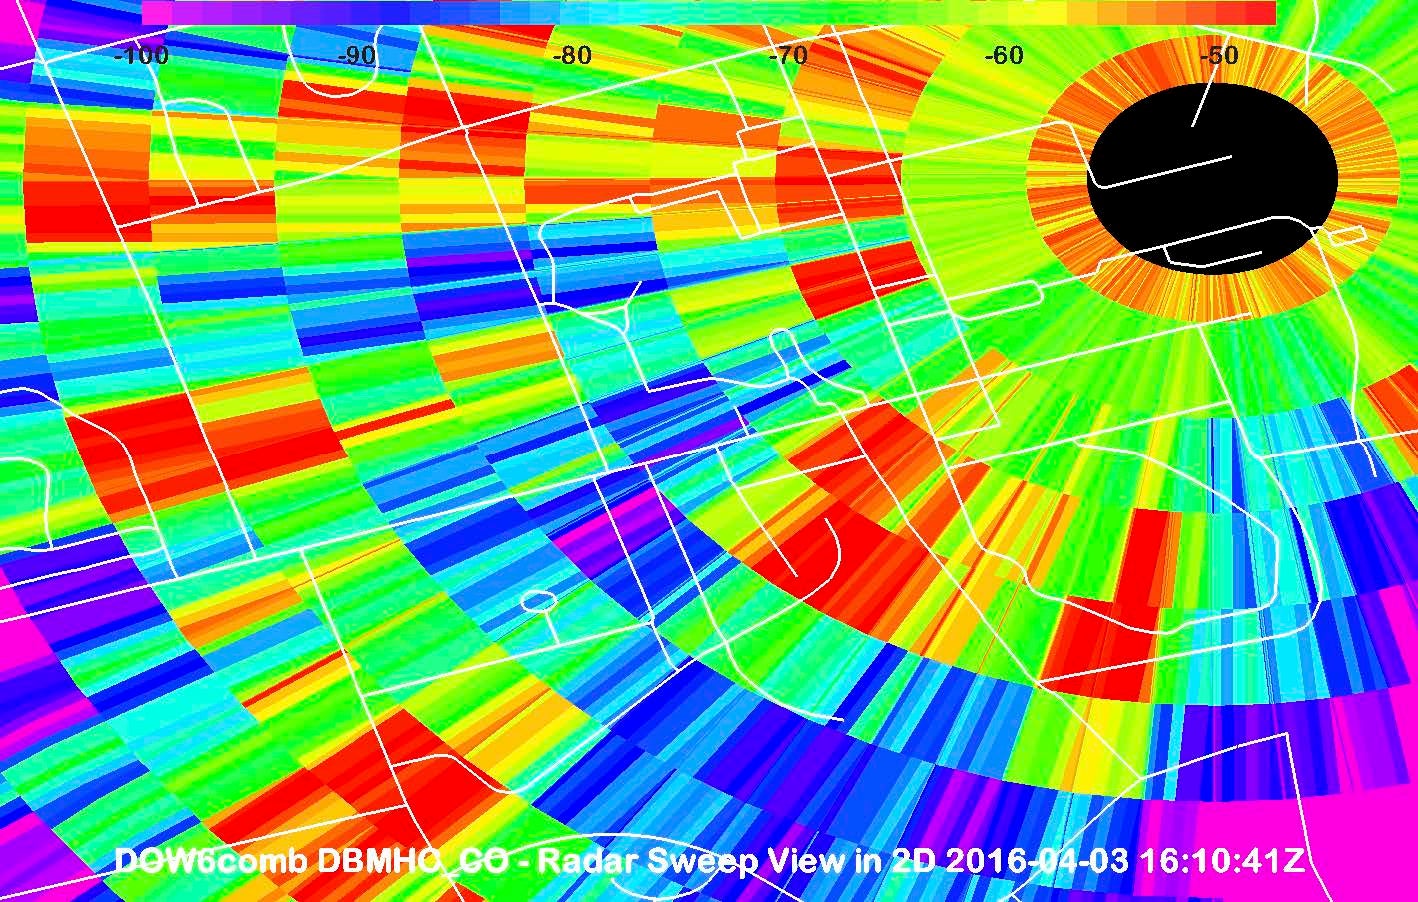
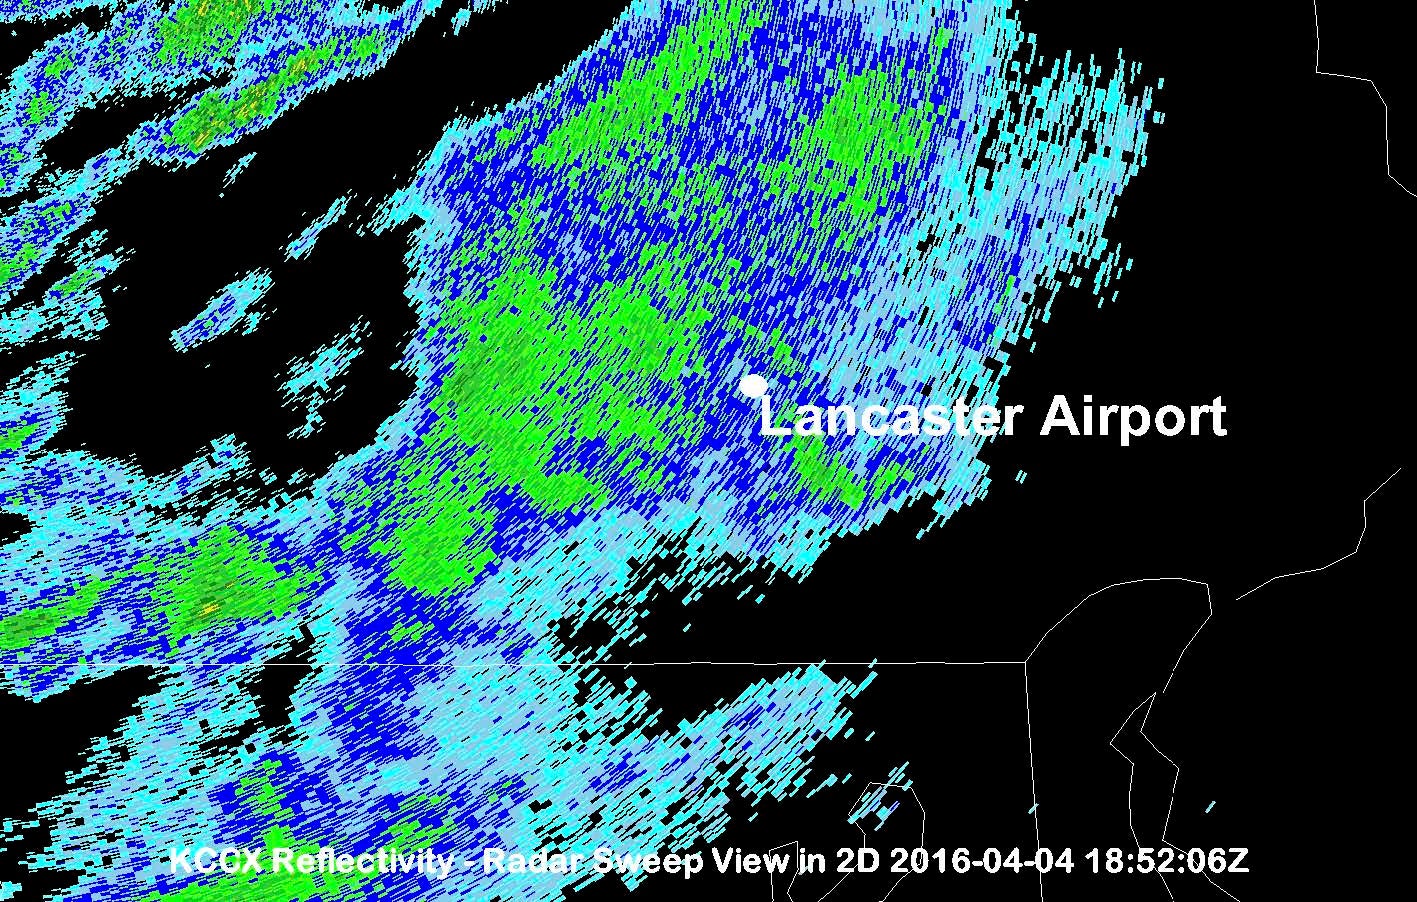
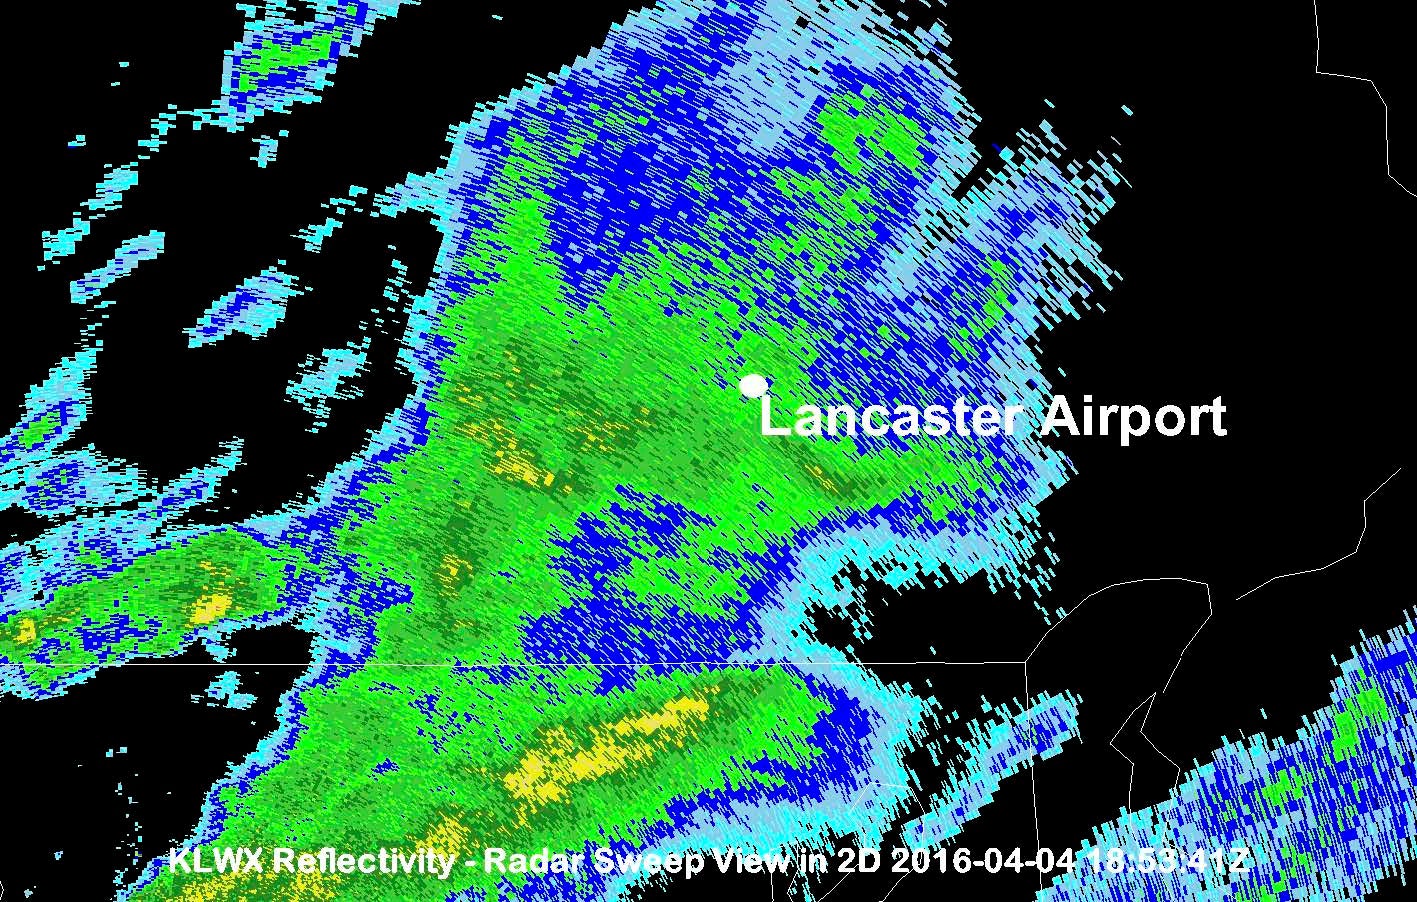
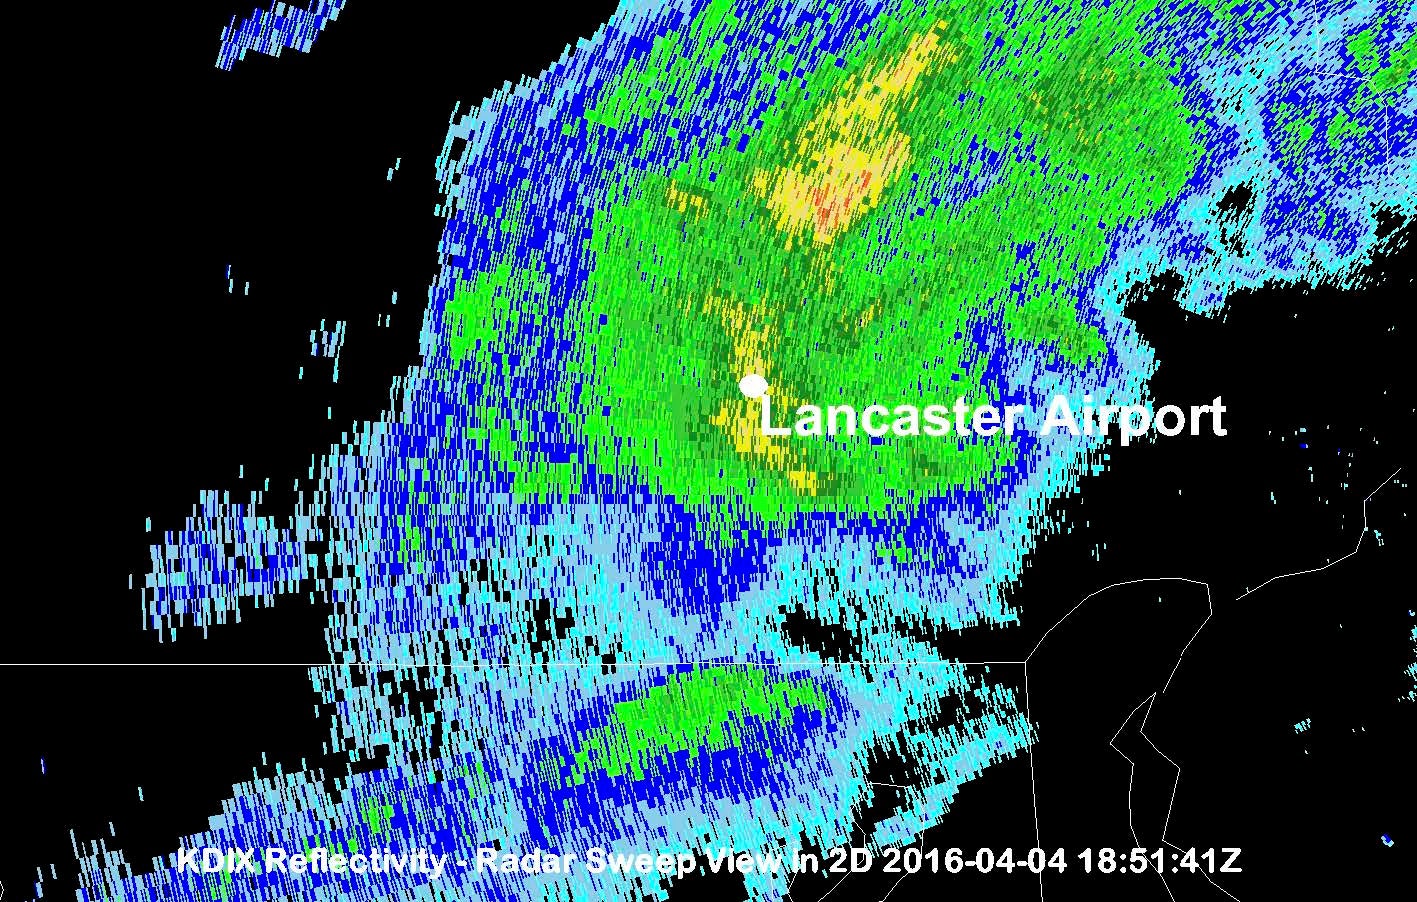
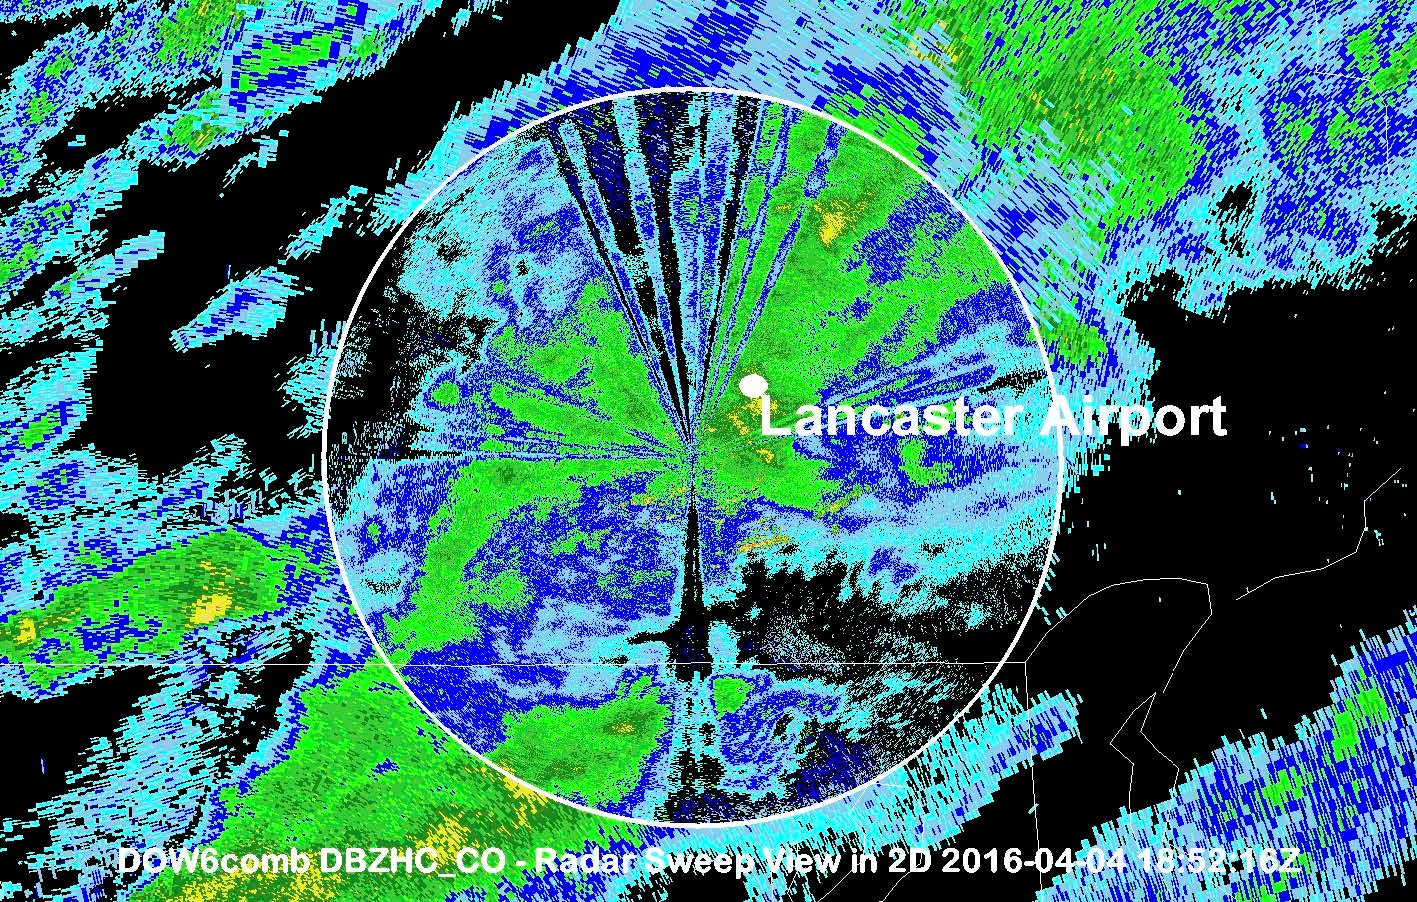
This case was of particular importance since it illustrated the potential value of a lower power radar in the Millersville area as was stated in the proposal. The WSR-88D at State College overshot and as a result did not capture most of the precipitation, while only the northern and southern halves of the line were sampled by radars at Philadelphia and Sterling, respectively (Fig. 6). Interestingly, when the DOW data is overlaid on the NEXRAD coverage the primary result is for the reflectivities to decrease (Fig. 6), demonstrating that the other radars are sampling the storm at too high of an elevation where a significant amount of evaporation has not yet occurred.
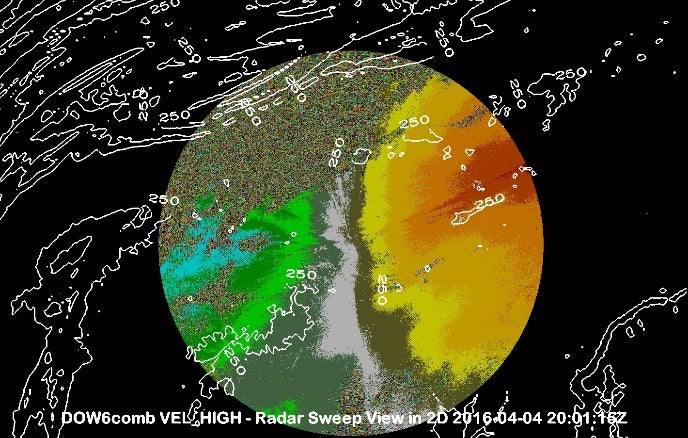
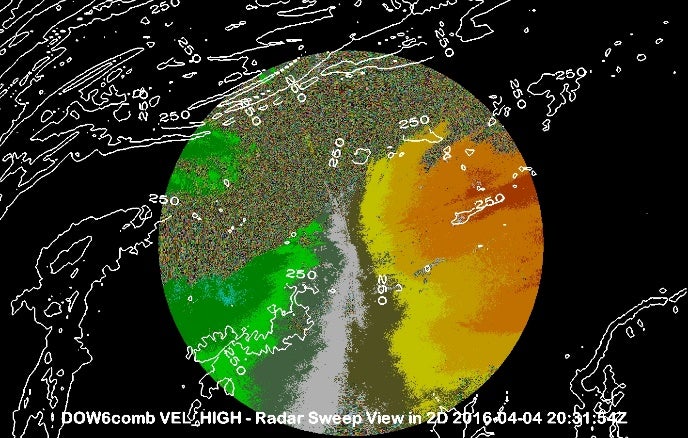
The scans after most of the rainfall had passed also proved valuable as a case of topography affecting the weather of the Piedmont region. Figure 7 shows a sharply defined boundary in the velocity data separating good return from pure noise. This line moves in a southerly direction and is oriented with the section of the Appalachians running WSW-ENE across northern Pennsylvania. The lack of returns and corresponding clearing in visible satellite imagery suggest that this feature represents dry downslope air after the frontal passage. Two students, with help from faculty advisors, will pursue additional analysis of this aspect of the event and present the results as a poster at this summer’s AMS Conference on Mountain Meteorology in Burlington, VT.
 |
 |
||
 |
 |
||
|
Fig 6: Reflectivity measured by the WSR-88Ds at State College (upper left), Philadelphia (upper right), and Sterling (lower left) and by DOW 6 (inside circle in lower right) during IOP 1.
|
|||
  |
|
Fig 7: Radial velocity at 2001 (left) and 2031 (right) UTC during IOP 2. The terrain elevation is contoured every 250 m.
|
Intensive Observing Period 3
While 0.09 inches of rain were observed at Millersville during the IOP 2 event, a much stronger convective event was forecast to occur on the last day of the project on April 7th. Therefore, a final deployment was scheduled for that morning at the same site west of Millersville used in the second IOP. Data collection started at 1243 UTC and continued for the next three hours. Radar meteorology students participated in the IOP for this event.
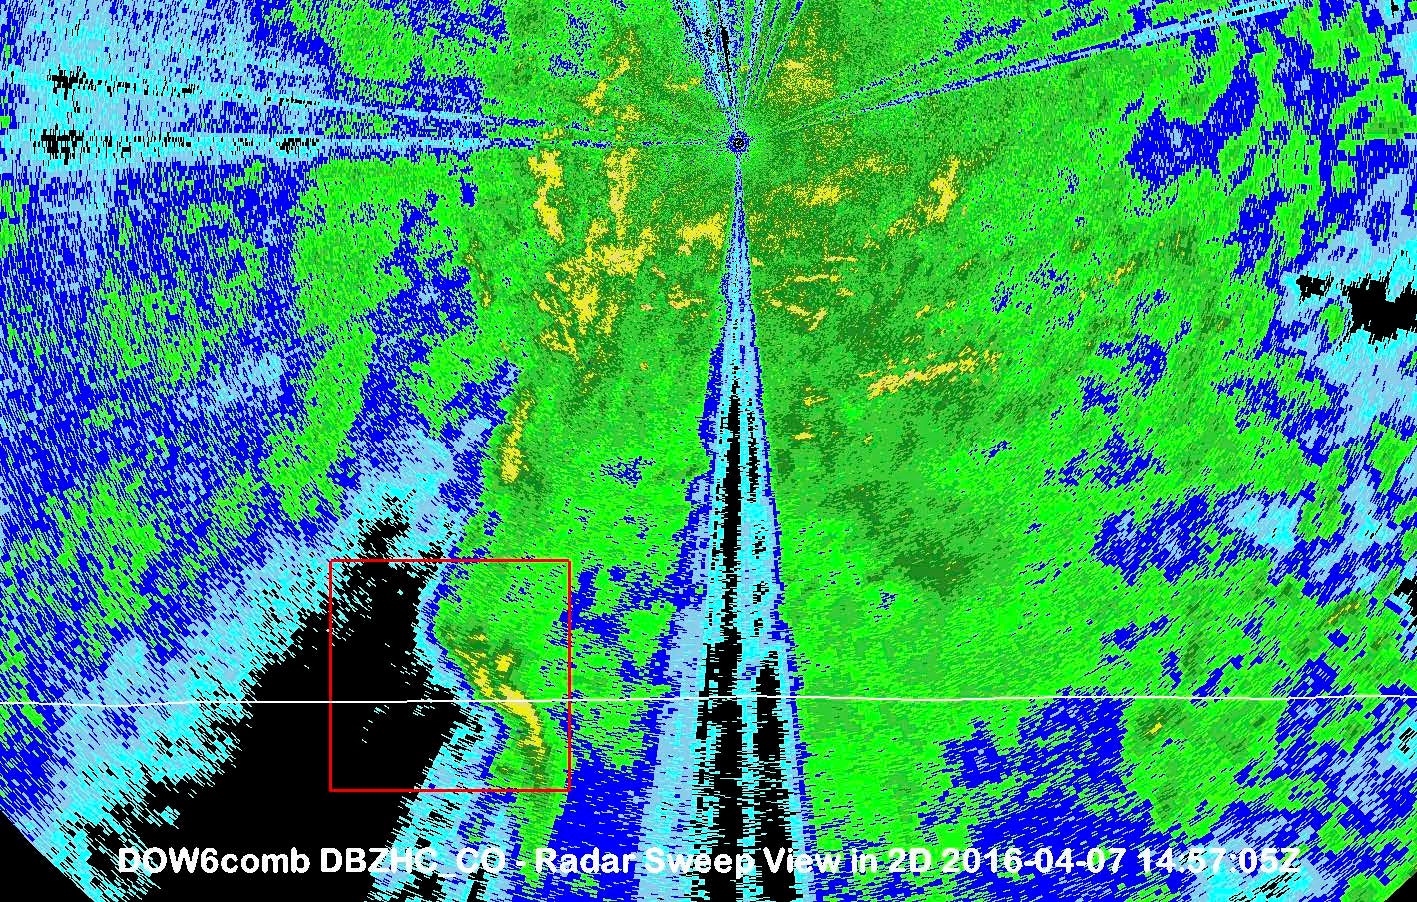
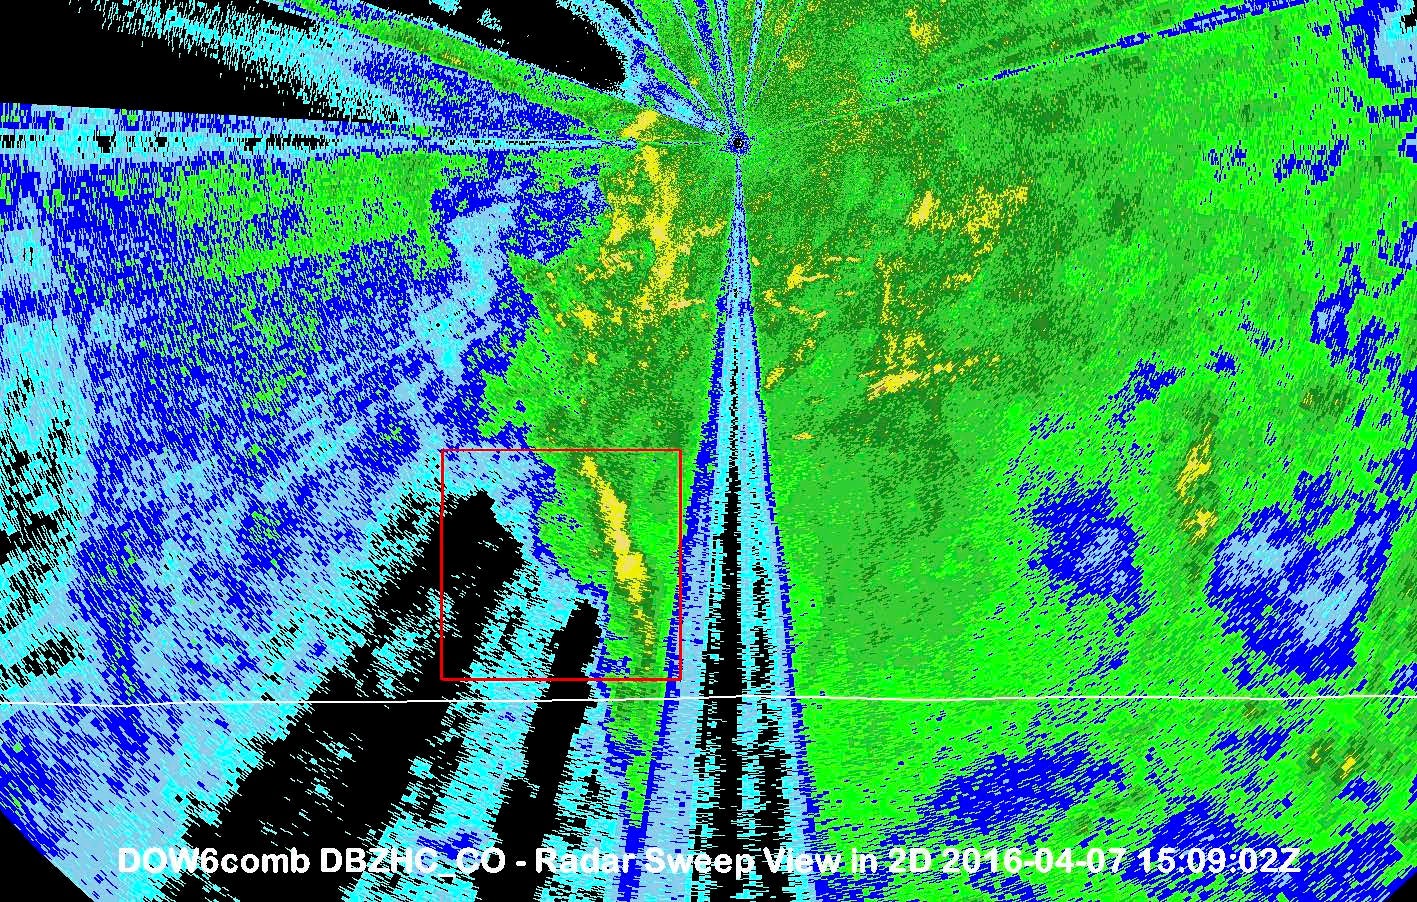
Light rain which had commenced just prior to the start of operations would increase and decrease in intensity throughout the period in advance of a thin line of strong convection. The most obvious sign of the trailing edges strength was the bowing of one segment moving northeast from Maryland to the DOW’s location (Fig. 8). This portion of the line also caused considerable attenuation, resulting in a lack of returns behind the bow that remained in place as it moved over time.
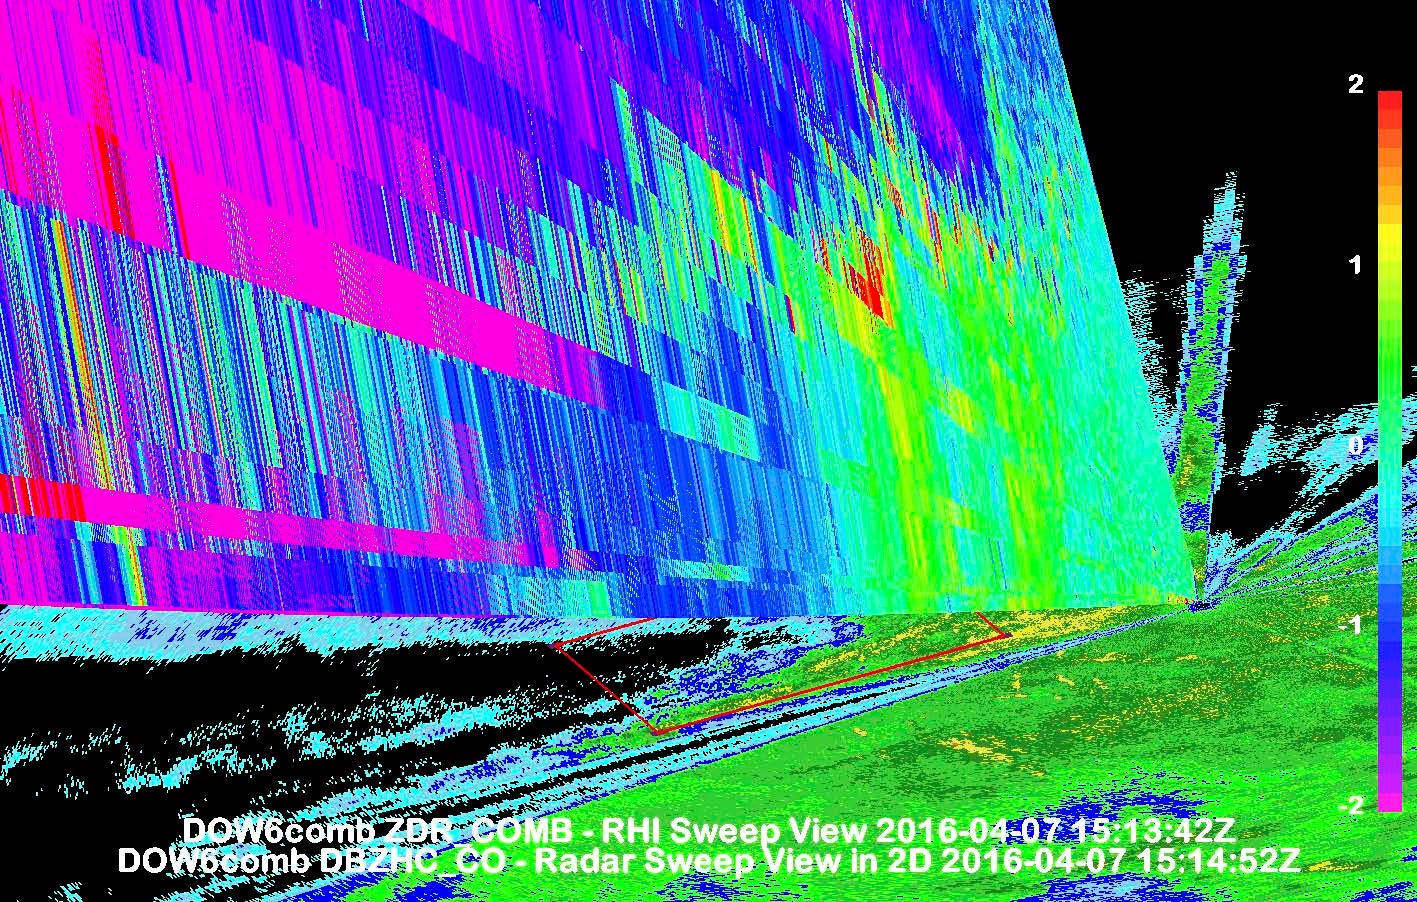
When this convective line reached the radar site, it produced heavy rain driven by strong winds with a highest measured gust from the DOW’s surface station of 12 ms-1 (27 mph). There was also small hail mixed in with this precipitation. Figure 9 shows an RHI scan through the line as it approached the radar. While two columns of larger positive values precede it, the final passage is characterized by values of differential reflectivity closer to zero. Slightly to the east on the Millersville campus, 0.96 inches of rain occurred with this event.
  |
|
|
Fig 8: Reflectivity at 1457 (left) and 1509 (right) UTC during IOP 3. The red box shows the bowing portion of the line and associated attenuation.
|
 |
|
Fig 9: RHI of differential reflectivity at 1513 UTC and PPI of reflectivity at 1514 UTC during IOP 3.
|
Additional Research and Classroom Use
The timing of the MEDOW project created a logistical issue in terms of using the data in the current semester’s courses since it was three weeks before the end of the semester. As a result plans are in place to incorporate the data for future assignments and projects in future offerings of Radar Meteorology and Physical Meteorology. Three students along with Brian Billings are further working on the data from IOP 2 and will present the results at the AMS Mountain Meteorology Conference in June 2016 in Burlington, VT.
Furthermore, the data collected during IOP 2 provided direct evidence to support the need for a radar in the local area to address the current radar data void. There are ongoing discussions and a focused effort on the development of a proposal over the summer.