Chronology
- Jul-May, 2007: Set-up TRAM Como Creek transect.
- Aug, 2006/Jun, 2007: Configure Hydra to sample Como Creek transect.
- Oct, 2006: Initial setup of fixed sensor network and AIRCOA along Como Creek Transect.
- Summer 2007: Data collection along Como Creek transect.
- Fall 2007: Move towers from Como Creek to CUFF/USGS transect.
- Spring/Summer 2008: Data collection along CUFF/USGS transect.
- Fall 2008: Equipment teardown along CUFF/USGS transect.
Site Description
Como Creek transect tower locations (from Differential GPS data taken by Lynette Laffee, horizontal precision ~0.5m, vertical precision ~1.0m):
| Tower# |
Altitude (m) |
Northing (m) |
Easting (m) |
| 1 |
3018.2 |
4431820.8 |
453491.8 |
| 2 |
3025.1 |
4431811.0 |
453493.3 |
| 3 |
3019.3 |
4431799.6 |
453492.3 |
| 4 |
3018.8 |
4431790.3 |
453488.2 |
| 5 |
3021.4 |
4431776.9 |
453489.3 |
| 6 |
3019.2 |
4431763.1 |
453492.2 |
| 7 |
3019.4 |
4431759.3 |
453488.1 |
| 8 |
3024.1 |
4431755.9 |
453478.8 |
| 9 |
3022.2 |
4431744.2 |
453481.7 |
| 10 |
3021.3 |
4431734.5 |
453475.0 |
| 11 |
3025.2 |
4431733.6 |
453464.1 |
Photographs
- The photos so far
- Half-hourly images from a USB camera on the chem shelter (downloaded daily at 1pm)
Data Plots
Click here to view qcplots.
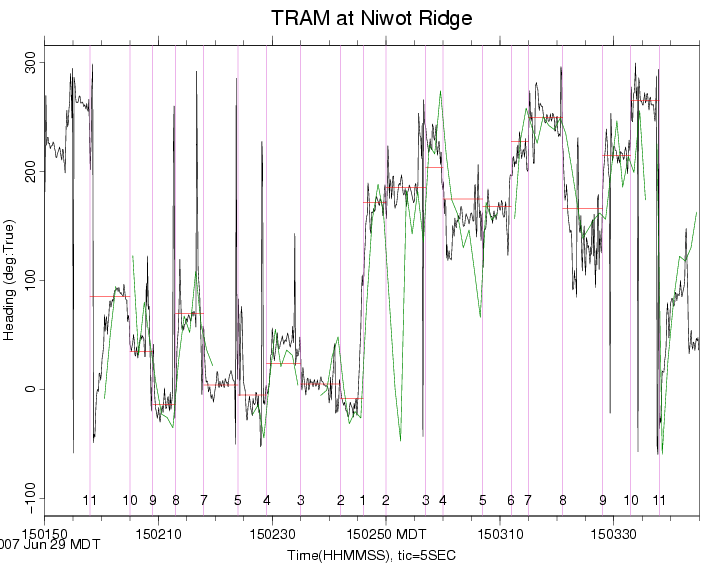
First plots from the only continuous run on 6/29/2007:
- Trolley heading from flux-gate compass (black), GPS (green), and expected from tower positions (red). Tower transits are indicated with vertical purple lines with tower numbers at bottom of plot. Note the RF data stream is continuous (sufficient range), but that the GPS signal drops out in some locations. The course bypasses tower #6 on the low leg (11->1).
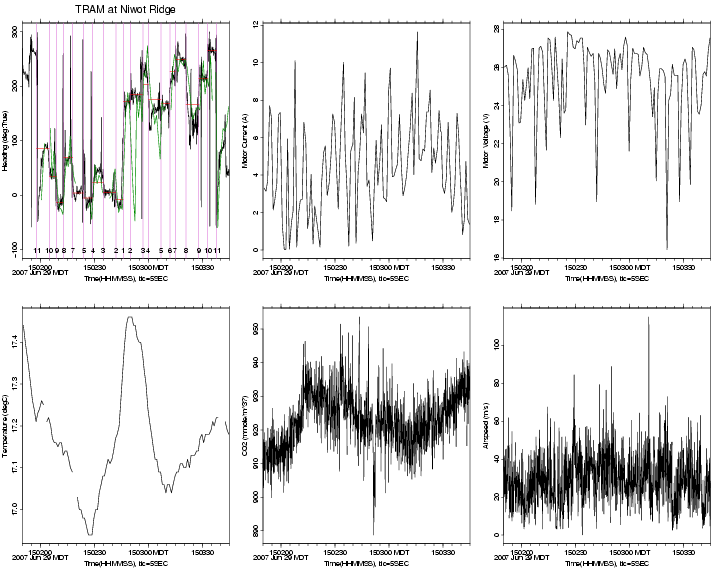
- Some data from the trolley. Note that the sonic anemometer data were bad during this run (cause as yet unknown). Also, the CO2 calibration has not been checked.
Data Download
None yet.

