The PSU science objectives focused on measuring methane emissions from coal mines and a watershed where methane leaks associated with gas drilling has been identified, and measuring carbon dioxide emissions from a high density metropolitan area (Philadelphia). One project sought to quantify emissions of methane from coal mines in southwestern Pennsylvania (RF06, 09 NOV 2017). Coal mines are reported to be the largest single point sources of methane emissions in the state of Pennsylvania. Figure 22 shows a strong plume of methane emanating from the location of the coal mine.
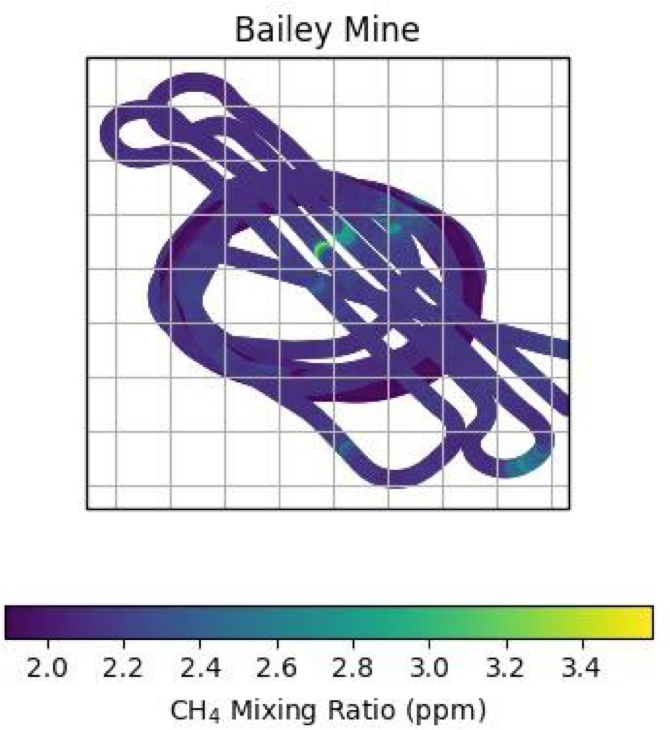
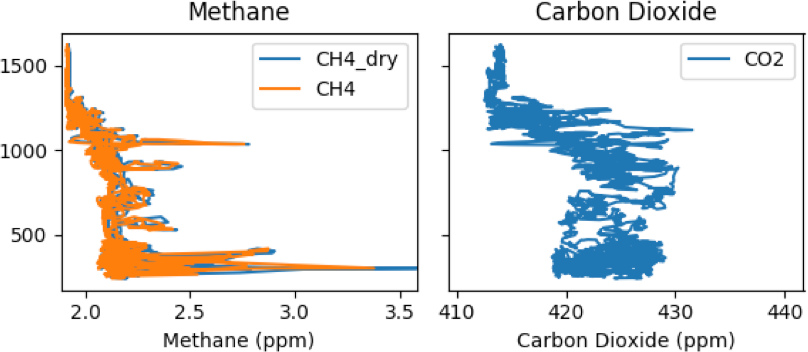
Figure 23 shows data from the same flight segments, illustrating their position with altitude. The flight levels span the entire atmospheric boundary layer (ABL) and show methane mole fractions that are elevated as much as 1.5 ppm above the upwind ABL mole fractions of about 2.1 ppm. ABL depth is about 1 km, and lower, free tropospheric mole fractions of about 1.9 ppm are observed aloft. Emission were estimates from two coal mines using a mass balance approach (Karion et al, 2015). Uncertainties in the emission rates were large due to a complex and probably polluted background in one case, and limited vertical mixing (Figure 23) in the second case. A more sophisticated analysis approach would be needed to derive a more precise estimate of emissions.
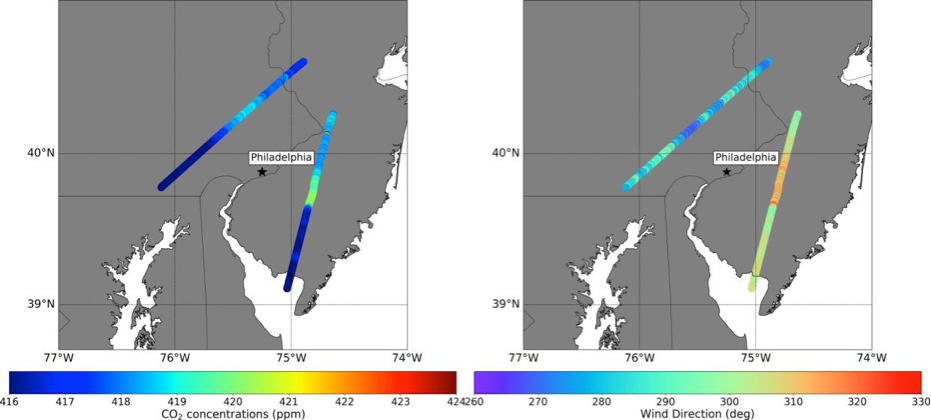
A second effort aimed to quantify carbon dioxide (CO2) emissions from Philadelphia (RF13a, RF13b). Upwind and downwind flights within the ABL (Figure 24) showed slightly elevated emissions downwind of the city, as well as heterogeneous upwind background conditions. The ABL on that day was surprisingly deep, and the flight was not high enough to locate the ABL top, leaving uncertainty concerning the depth of mixing. Emissions of CO2 were estimated (2.9x10² tons C hr-1) and were similar to the values available from a bottom-up inventory, albeit within fairly large uncertainty bounds in the airborne estimate.
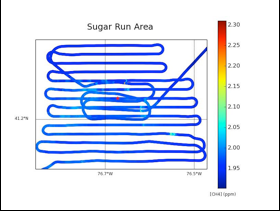
The third research flight searched for emissions from a watershed where a natural gas well is suspected to be leaking (RF05-Sugar Run-Salt Springs). Very high methane mole fractions have been measured from the ground, but no quantification of emissions into the atmosphere exists. A grid of data was collected within the ABL over the region of the suspected well failure (Figure 25). Significant, heterogeneous enhancements of 50-100 ppb of methane were observed very close to the watershed and may be associated with the emissions from the watershed. The plume structure, however, was complex and difficult to attribute to a single source location.