The planetary boundary layer (PBL) is the lowest layer of the atmosphere, encompassing surface interactions and most of the weather that affects daily life. The depth of the PBL starts at the Earth’s surface and extends anywhere from a few hundred meters to a few kilometers above the surface depending on environmental conditions. This variability in PBL height is important for air quality, atmospheric chemistry, and weather. For example, most atmospheric constituents within the PBL mix homogeneously, thus a shallow PBL confines pollutants to a small volume, whereas a deeper PBL would spread those pollutants over a larger volume thus lowering concentration and potential health risks.
While some aspects of PBL height are understood (such as the diurnal growth and decay cycle forced by solar heating), height variability over diverse surface types is not very well understood and is a valuable topic for research. In general, urban areas produce more heat and thus the PBL tends to be taller over cities. Oceans are typically cooler than land, and thus have lower PBL heights. Transitions away from these regions towards rural or coastal areas are not well characterized, in part because most PBL studies utilize fixed ground-based or radio sounding measurements that observe points, rather than spatial variation. Aircraft measurements are a great opportunity to observe this spatial variability in PBL height.
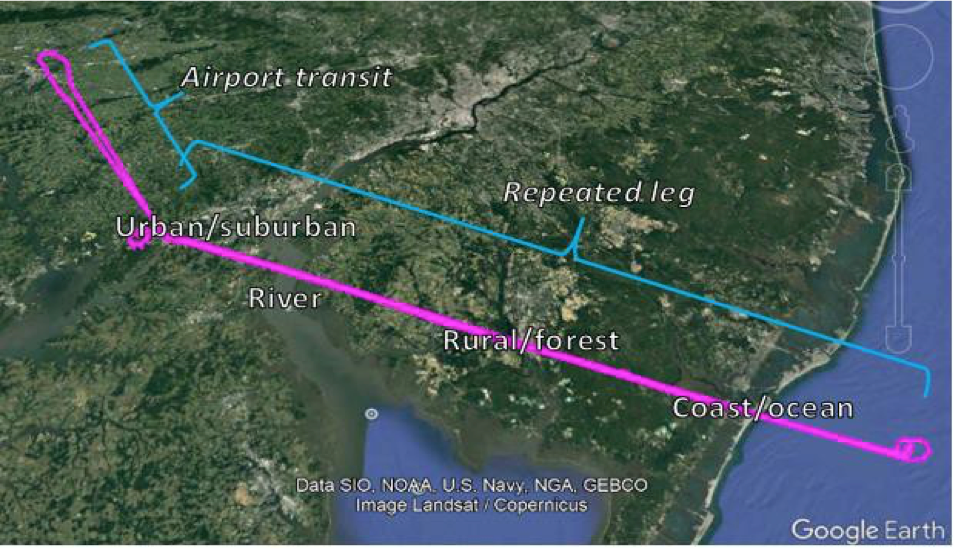
Research flight 09 (RF09) was designed to investigate the PBL height changes along a track that included urban or suburban areas, a river, rural land, forest, coast, and ocean. This track is shown in Figure 20. The flight track of interest was repeated four times to build up a robust data set. The first and fourth legs were sawtooth altitude patterns flying in and out of the PBL to measure PBL height via in situ instruments and served the purpose of characterizing the atmospheric conditions in and above the PBL. The sawtooth patterns only provide six point-measurements of PBL height along the track. Flight legs two and three provided continuous PBL height observations along the track by flying at constant altitude above the PBL, using the downward- pointing backscatter lidar onboard the aircraft to retrieve PBL heights. RF09 was conducted around 1 to 3 PM local time, when the PBL is expected to be near its maximum height for the day.
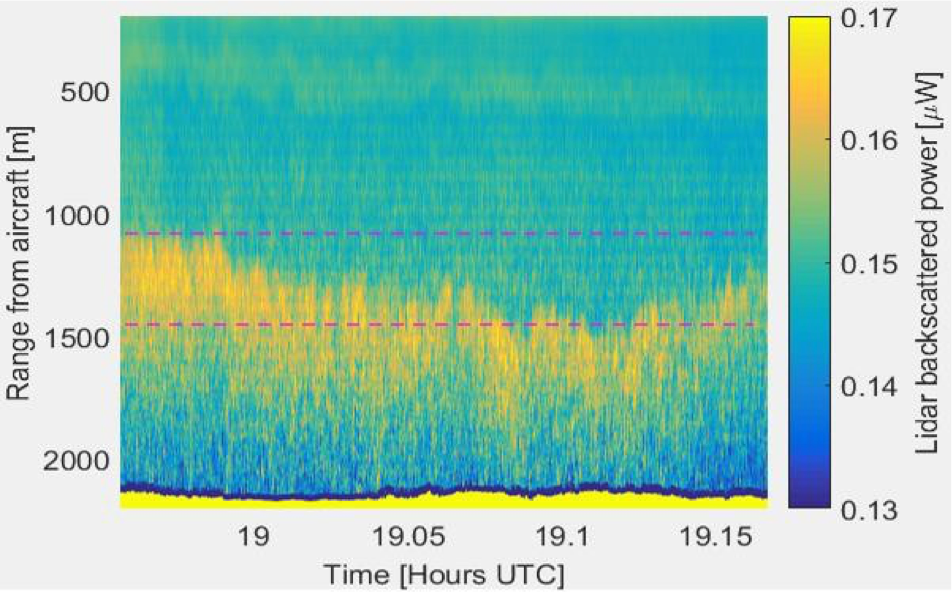
The flight was successful as planned. In situ measurements during the sawtooth pattern legs showed clear distinction between the PBL and free troposphere above it. The Wyoming Cloud Lidar (WCL) measurements during the constant altitude legs captured PBL heights with good data quality for most of the flight. A section of the third leg lidar data is shown in Figure 21; PBL height differences of 400m or more were observed along the flight path.
This analysis is still in preliminary stages. Future steps will improve data visualization and draw conclusions about PBL heights over different surface types. The impacts of the unavoidably coupled daily meteorology on this case study must also be considered. Extending beyond RF09, a similar flight path was flown for RF12 collecting PBL data shortly after sunrise. The RF12 dataset may corroborate the results of RF09, or provide new information about PBL spatial variability during the morning transition period. In the coming year, several graduate and undergraduate students will be using the data together with operational models for their research rotation work and some have expressed interest to use part of the data as a motivation in their master’s thesis study.