Another mission with high student involvement was based on a larger research project proposed by a group of Millersville students independent of SEAR-MAR or any meteorology course. Their goal over a two-year period is to perform the research, present the preliminary results at a series of conferences (the first being the annual Made in Millersville student conference; Dellandre et al. 2018), and ultimately author a journal article. The work involves a case study comparison of two cold air damming (CAD) events, and with the availability of the UWKA the second event could be supported by a unique dataset (see RF01 in Table 1).
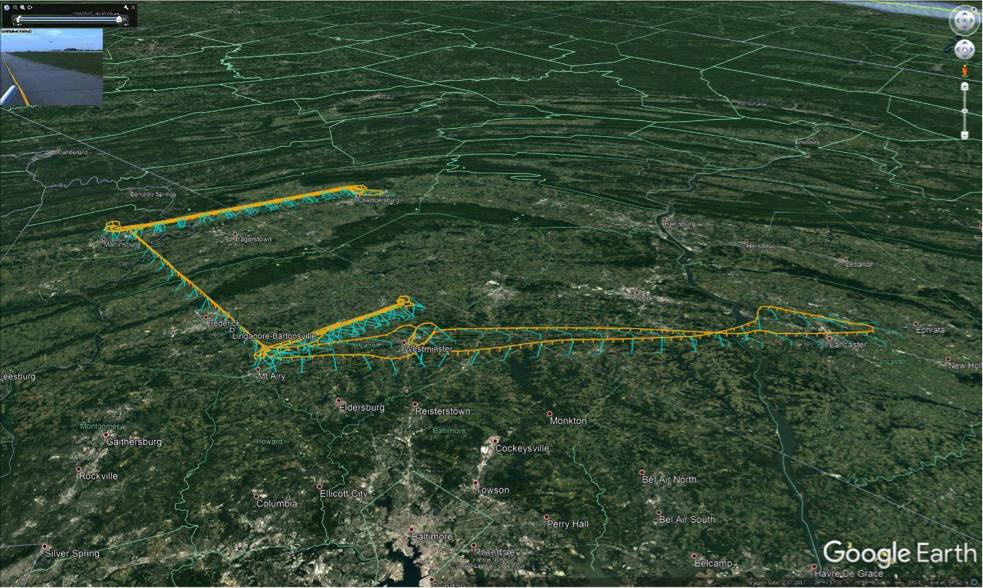
These students made an initial attempt to design a flight path over the valleys near Altoona, PA, the site of a significant historical CAD event. However, due to the King Air’s minimum altitude, these tracks turned out to be beneath the local crestline of the Appalachians. Therefore, the study area was shifted southward to the Cumberland Valley and downwind of the Blue Ridge Mountains (Fig. 10) with two flight altitudes and slow climbs and descents in between. There were also three missed approaches planned at small airports in Carrol County, MD and Franklin County, PA. Three MU students flew on the UWKA during this mission.
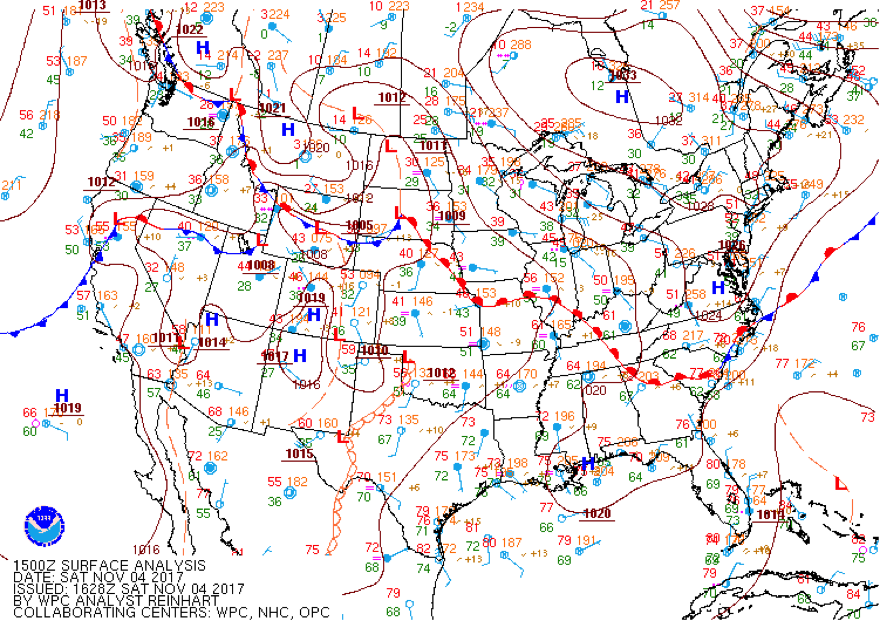
The ideal synoptic conditions occurred on the first day of the deployment (4 Nov) with a closed high forecast over the Ontario-Manitoba border and ridging isobars extending southward to Virginia (Fig. 11). While daylight conditions were required to fly the minimum altitudes, the mission was otherwise scheduled as early as possible to minimize the amount of heating and surface erosion of the cold air, so that takeoff was at 12 UTC (08 LST).
The rest of the student research team provided additional ground support by launching two Windsonds along the flight path. They first traveled to the Sharpsburg, MD area at 1230 UTC to obtain a sounding in the Cumberland Valley directly under the ferry leg. This was timed to coincide with the King Air’s overpass by communicating with students in Millersville’s Weather Center who were following the flight on NCAR Mission Coordinator. Moving north, students launched a second balloon. Both sondes were recovered after the second launch. To capture additional horizontal variation in the vertical structure, radiosondes were also used from the Millersville base site at 1230 UTC and by PSU at Bedford, PA at 1130 UTC.
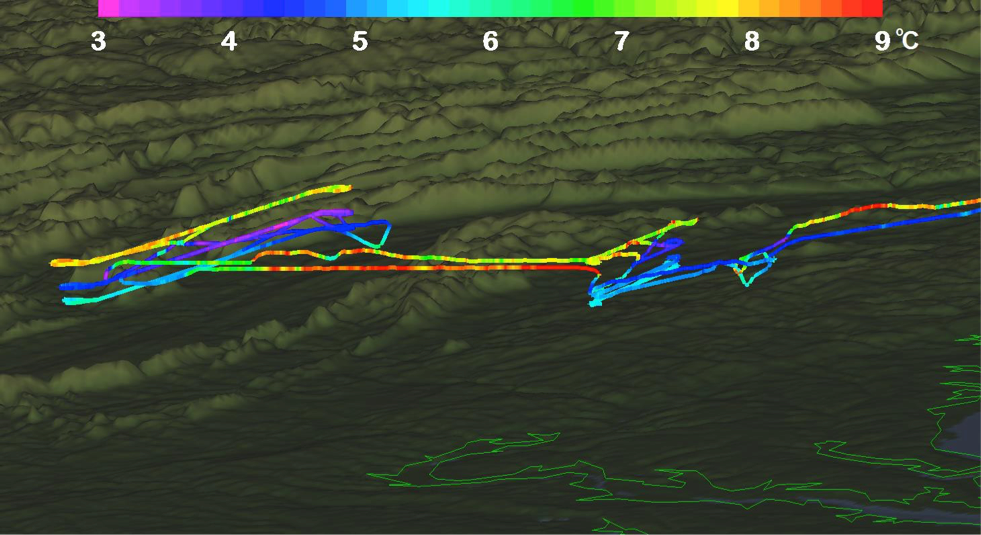
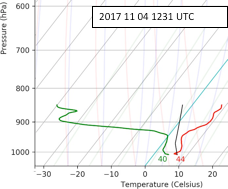
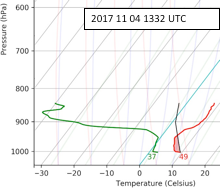
During the first missed approach and mountain parallel flight legs, it was found that temperature was higher nearer to the surface. However, as the King Air was ferrying westward, the plane was forced to climb to 4000’ to pass ATC at Frederick, MD. At this level, the warmer temperatures of the inversion were discovered. After discussion among the flight team and with participants in the Weather Center, it was agreed to add an additional flight level at a higher elevation along both sets of ridges. This new altitude and the one beneath it were used to map out the horizontal structure of the inversion, which is shown in Fig. 12. Moreover, the students reported visually observing fanning smokestack plumes during the flight. The inversion was also captured in all of the morning radiosonde launches. While the earlier soundings from Bedford and Sharpsburg, MD (Fig. 4a) have second surface-based inversions, the later profile from Waynesboro, PA (Fig. 4b) had the same decreasing temperatures seen in the King Air data. On returning from their trip, students made particular note of this dramatic difference in surface temperature between the two launch locations. While the extra hour of solar heating would have an obvious impact, it is also possible this is due to horizontal variations between up- and down-valley locations, as the King Air observed horizontal temperature variations along its valley legs.