GATE
GARP Atlantic Tropical Experiment

The Global Atmospheric Research Program's (GARP) Atlantic Tropical Experiment (GATE) took place in the summer of 1974 and lasted approximately 100 days. The experimental area centered over the tropical Atlantic Ocean with three observing periods (Phases) of approximately three weeks each (Phase I: 26 June to 16 July; Phase II: 28 July to 17 August; and Phase III: 30 August to 19 September). Because of its enormous size (72 nations were involved) and scope, the GATE experiment was divided into a Central Program, which ensured that the central objective was met, and five sub-programs, whose primary objectives were related to and supported the central objective.
SCIENTIFIC OBJECTIVES
The central objective of GATE was to look at the effects of smaller-scale tropical weather systems, such as cloud clusters, on larger scale motions (scale interaction), and to improve numerical modeling and prediction methods. This was done through collecting and providing datasets suitable for numerical-modeling testing and development of parameterization schemes for use in numerical models. The scales of tropical phenomena studied included wave-scale (104 km), cloud-cluster scale (103 km), mesoscale (102 km), and cumulus-scale (101 km). GATE data have been used for evaluation of models varying from large-eddy simulations to numerical weather prediction models, and for testing and evaluation of parameterization schemes for the boundary layer and mesoscale convective systems.
The five sub-programs and their primary objectives were:
- Synoptic-Scale Subprogram, to describe the synoptic scale phenomena from West Africa to the western Atlantic Ocean, and from the troposphere through the lower stratosphere.
- Convection Subprogram, to document mesoscale convective systems and their interaction with their environment and other scales.
- Boundary-Layer Subprogram, to document the surface fluxes, atmospheric boundary layer structure and fluxes, and boundary-layer interaction with clouds, for suppressed (fair-weather) to the highly disturbed conditions associated with precipitating convection.
- Radiation subprogram, to document the radiative heating profiles and on the net radiation and its components at the surface, for the range of convective conditions, from suppressed to highly disturbed.
- The Oceanographic Subprogram, to study ocean-atmosphere interaction at various scales, including the structure of the upper ocean, and the coupling between ocean currents and surface winds.
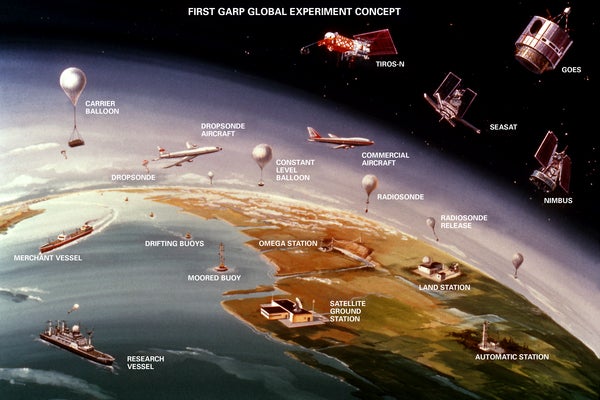
FACILITIES & OBSERVATIONS
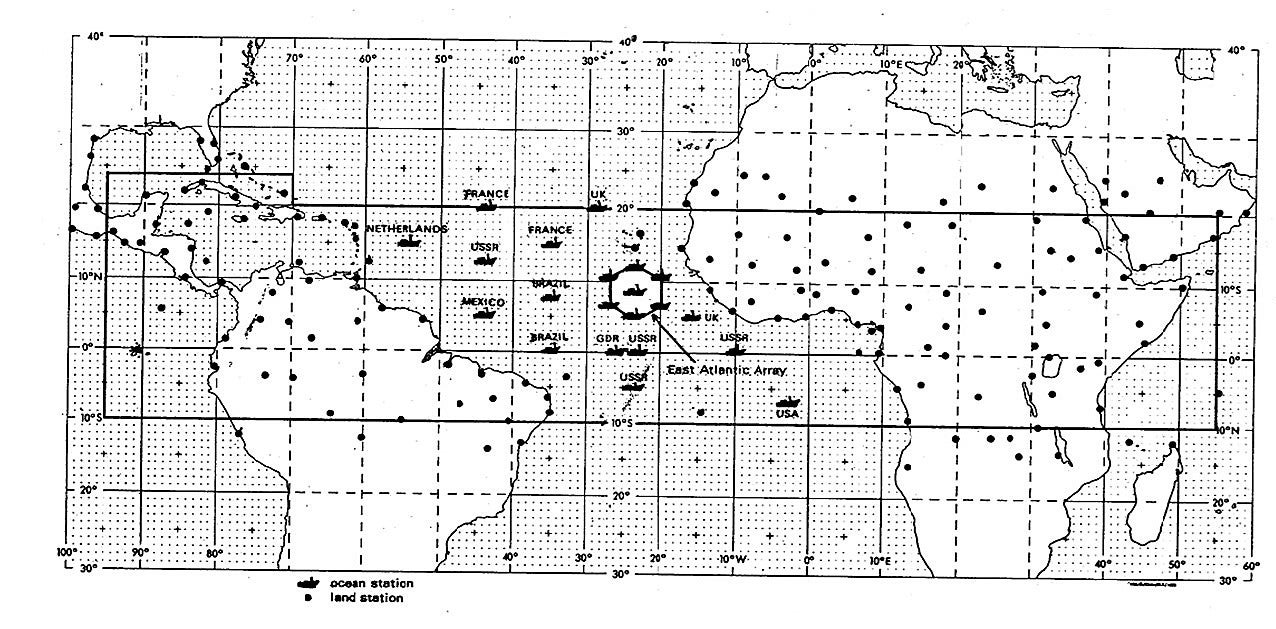
The Ship and Land observing network during GATE. Note: the ship distribution changed slightly from Phase to Phase (figure from ISMG/GATE 1974, courtesy of the American Meteorological Society).
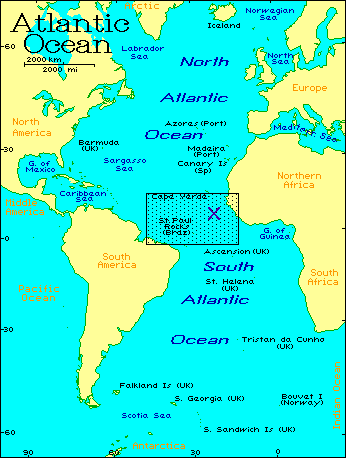
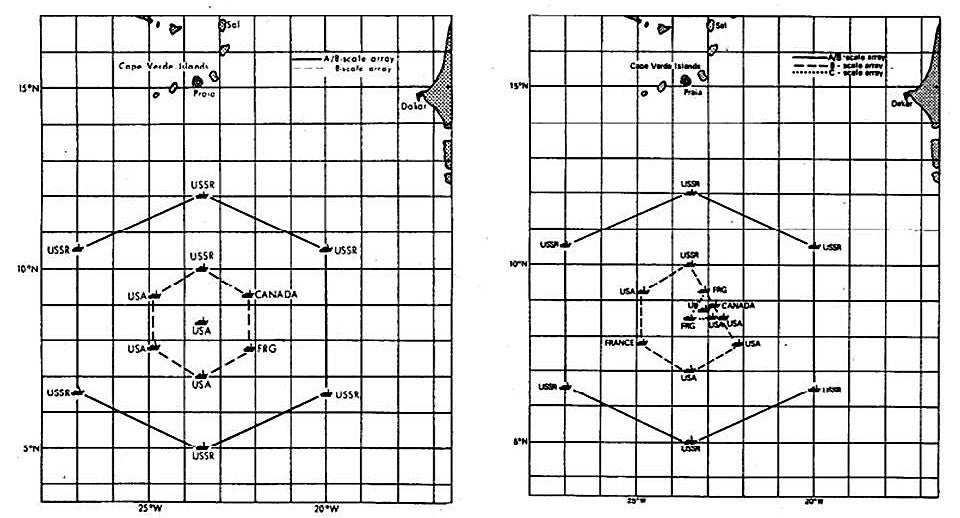
GATE Observations extended from West Africa to the western Atlantic Ocean, and from 10 S to 20 N, with concentric nested hexagons of ships in the eastern Atlantic at around 8 degrees north, 23-24 degrees West), namely the ~800-km diameter A-Scale Array, the 350-km diameter B-Scale array, and, for the third phase, a C-Scale (50-100 km) triangle on the NE part of the B-scale array for scale interaction studies. Thirty nine (39) ships were involved. GATE observations consisted of roughly three (3) multiple week phases, interrupted by 10-day periods to allow fine-tuning to adjust for scientific needs. Most ships provided upper air and surface observations. Many of the ships within the B-Scale array had additional instrumentation, including conventional (non-Doppler) radars, tethered balloons (one with flux-measurement capability), and one acoustic sounder.
Thirteen aircraft were deployed from Dakar, Senegal; most of these flew coordinated missions over the B-Scale Array during the three phases, with measurement altitudes ranging from 30 m for the NOAA-DC-6 and the NCAR Electra, to up to 6-7 km for the NASA-CV-990. Eleven of the aircraft had long-range capability of 4,000 km or more. Three of the aircraft – the NOAA-DC-6, the NCAR Electra, and the UK-C130 – had gust-probe capability; and several were equipped for cloud-physics and/or radiation measurements.
The upper air sounding network over the GATE land area was nearly tripled during GATE from available soundings in 1973 through augmentation of the World Weather Watch and efforts from participating countries involved in GATE. Continuous sets of A-scale data (surface and upper air) were taken at 12-hr intervals for each Phase. For the B-scale area, surface and upper air data were collected at 6-hr intervals.
Highest resolution imagery from geostationary and polar orbiting satellites (both visible and infrared spectrum) was used for operational planning as well as post-field data analysis. The SMS-1 geostationary satellite provided half-hourly visible and infrared images that were useful for mission planning and evaluation.
Intensive observing periods and primary and secondary aircraft missions were determined by a five-member Mission Selection Team, on the basis of anticipated weather conditions, platform status, and experiment objectives that needed to be met. This practice, combined with more thorough reviews between the phases, ensured that needed measurements were taken.
A general description of the GATE program and scientific objectives can be found in: Kuettner and Parker, 1976: GATE: Report on the Field Phase, Bull. Amer. Meteor. Soc., 57, pp. 11-27, and ISMG (1974), GATE, final international scientific plans, Bull. Amer. Meteor. Soc., 55. 711-719/ and further details on the GATE operations and data collection can be found in a series of GATE Reports (https://www.eol.ucar.edu/content/gate-reports).
|
|
|
|
|
GATE Aircraft
Photo courtesy
Margaret LeMone, UCAR |
GATE International Logo
|
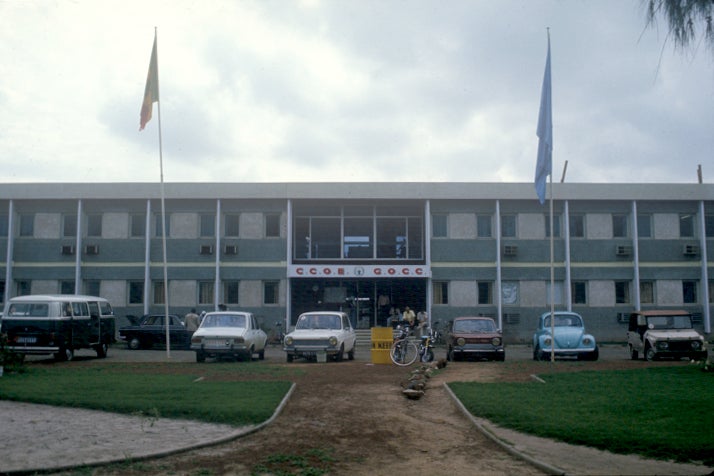
GATE Operations Control Center
Photo courtesy Margaret LeMone, UCAR |

GATE airplane photos courtesy Margaret (Peggy) LeMone, UCAR. GATE ship photos courtesy American Meteorological Society.
Unless otherwise noted, photos copyright University Corporation for Atmospheric Research.